Inspiration
There were many instances when we needed to know how many hours were logged over a particular set of issues. Unable to easily get that information, we wanted to create a plugin to gather the data and display it in an appealing way.
What it does
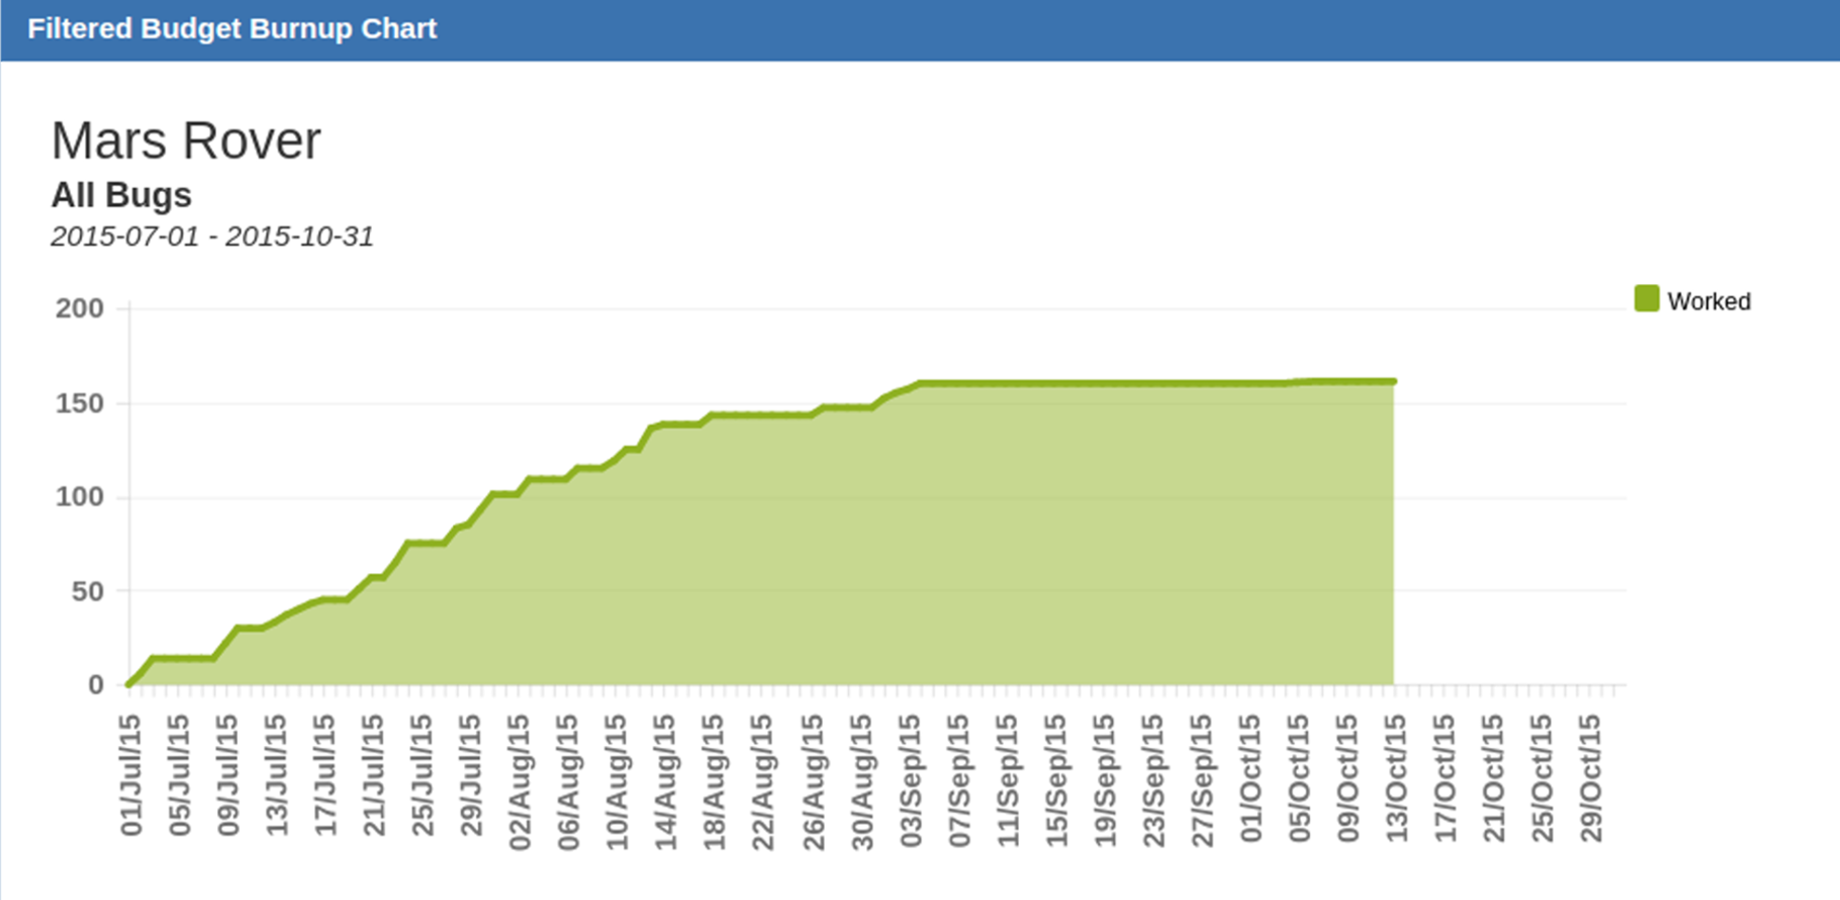
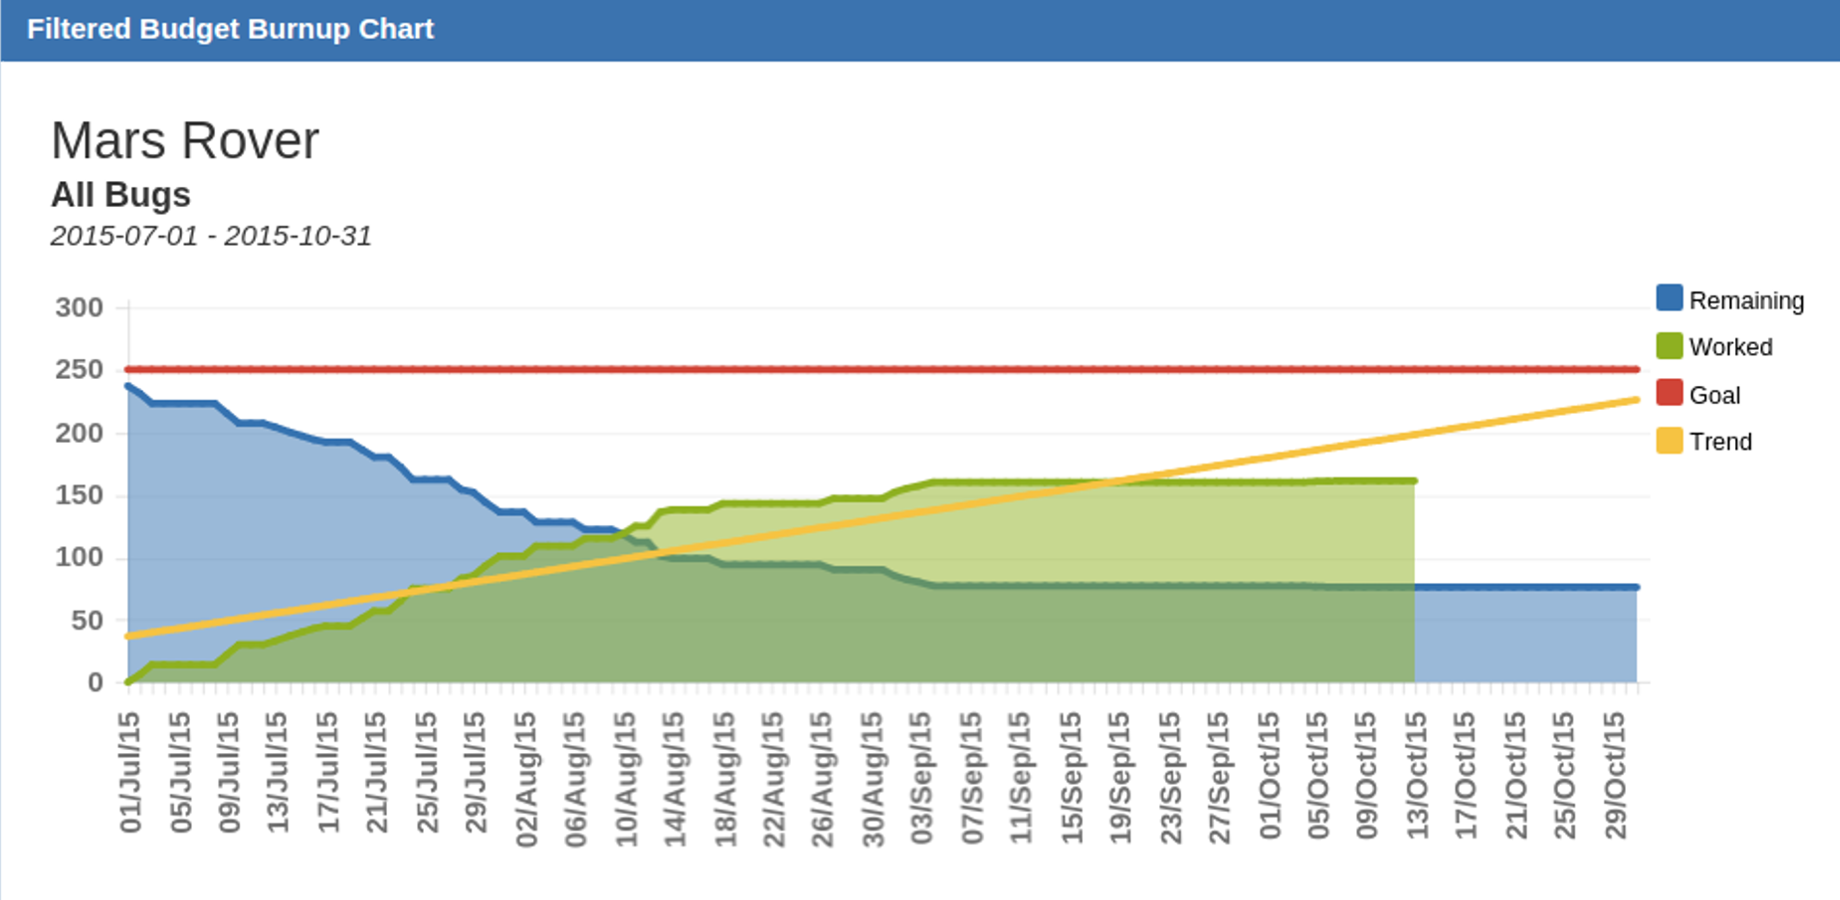
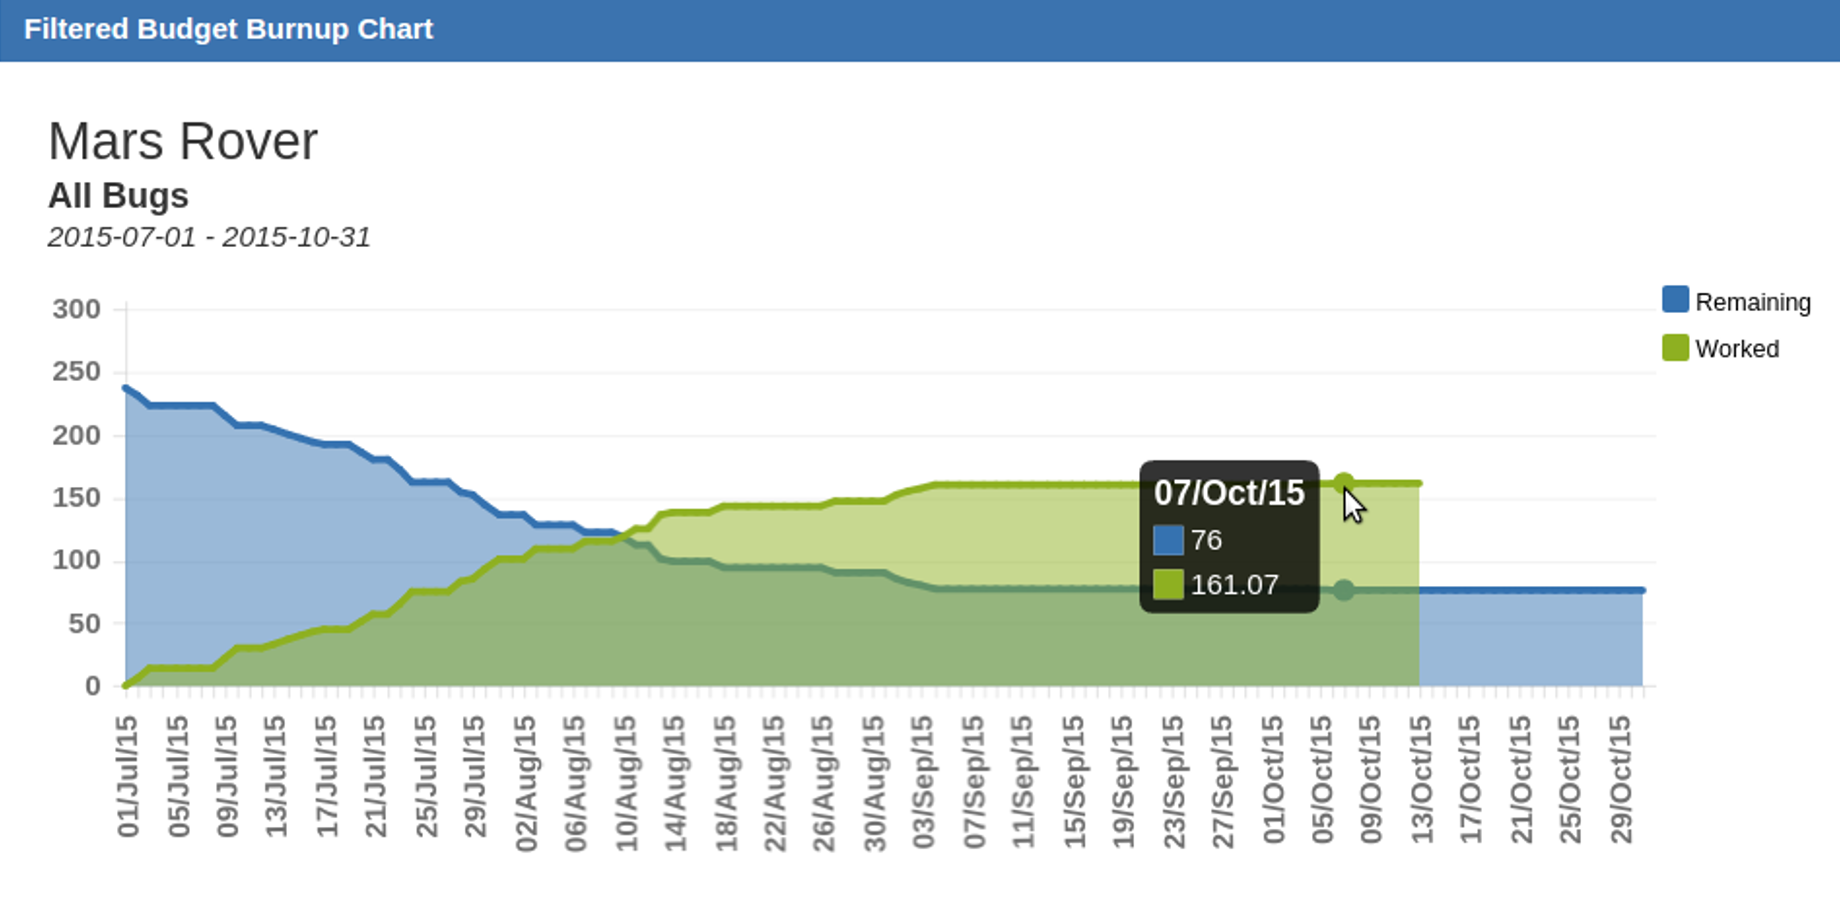
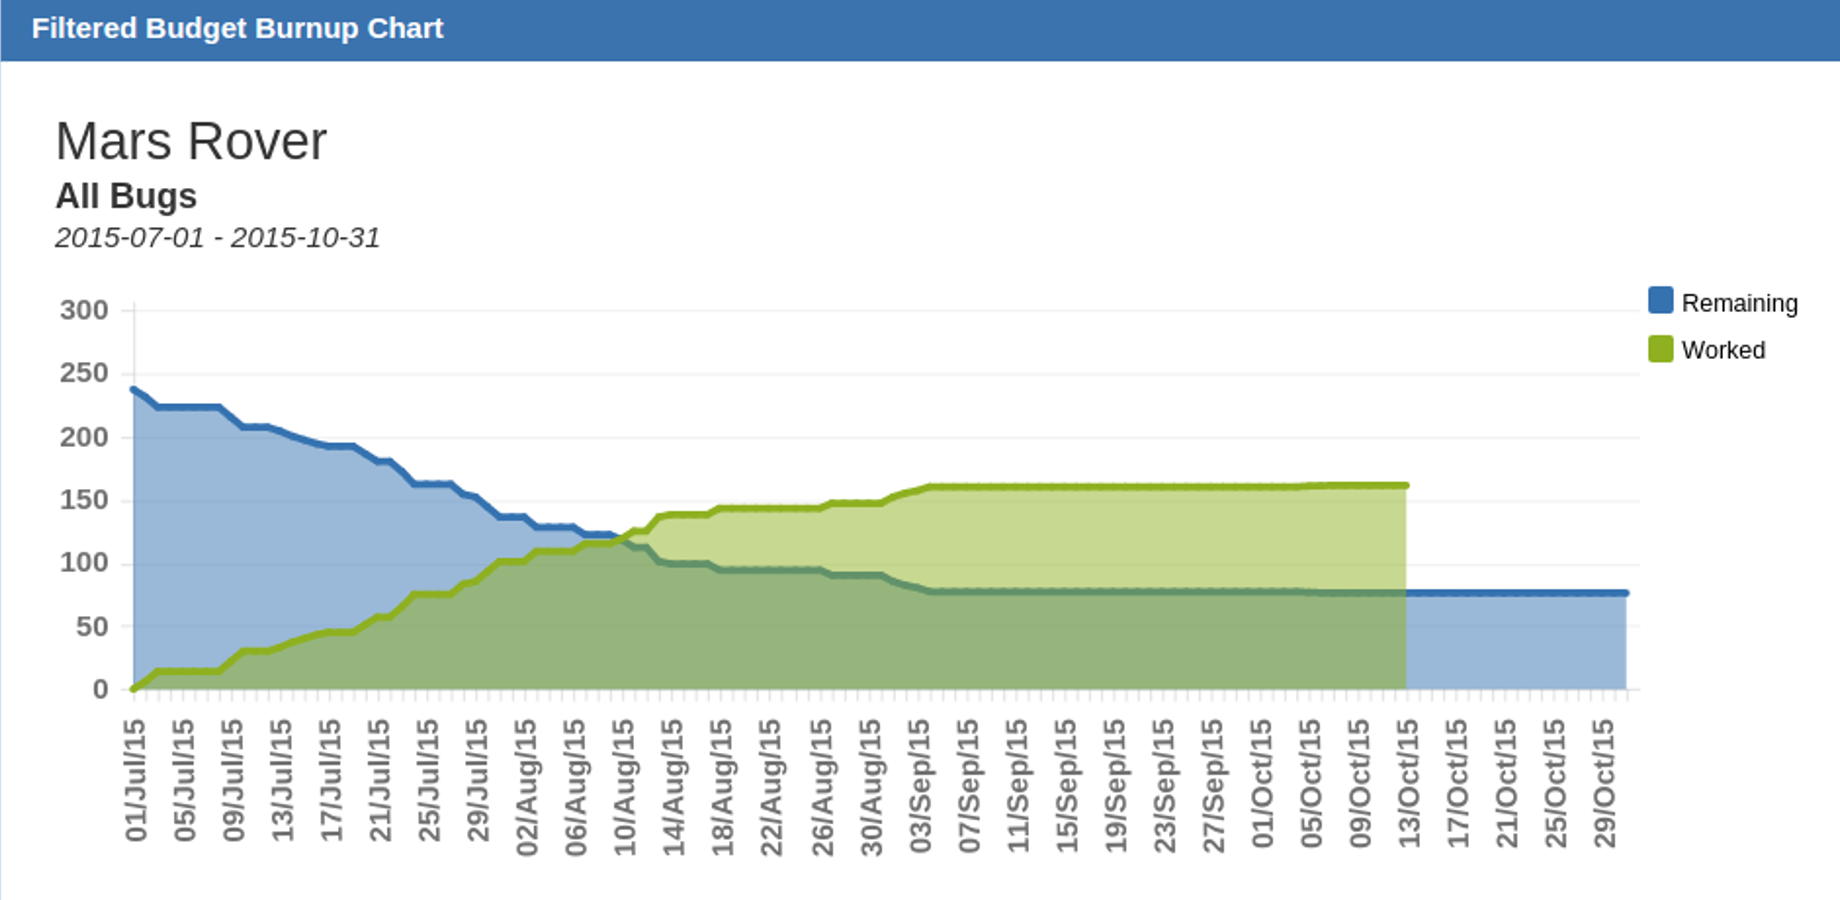
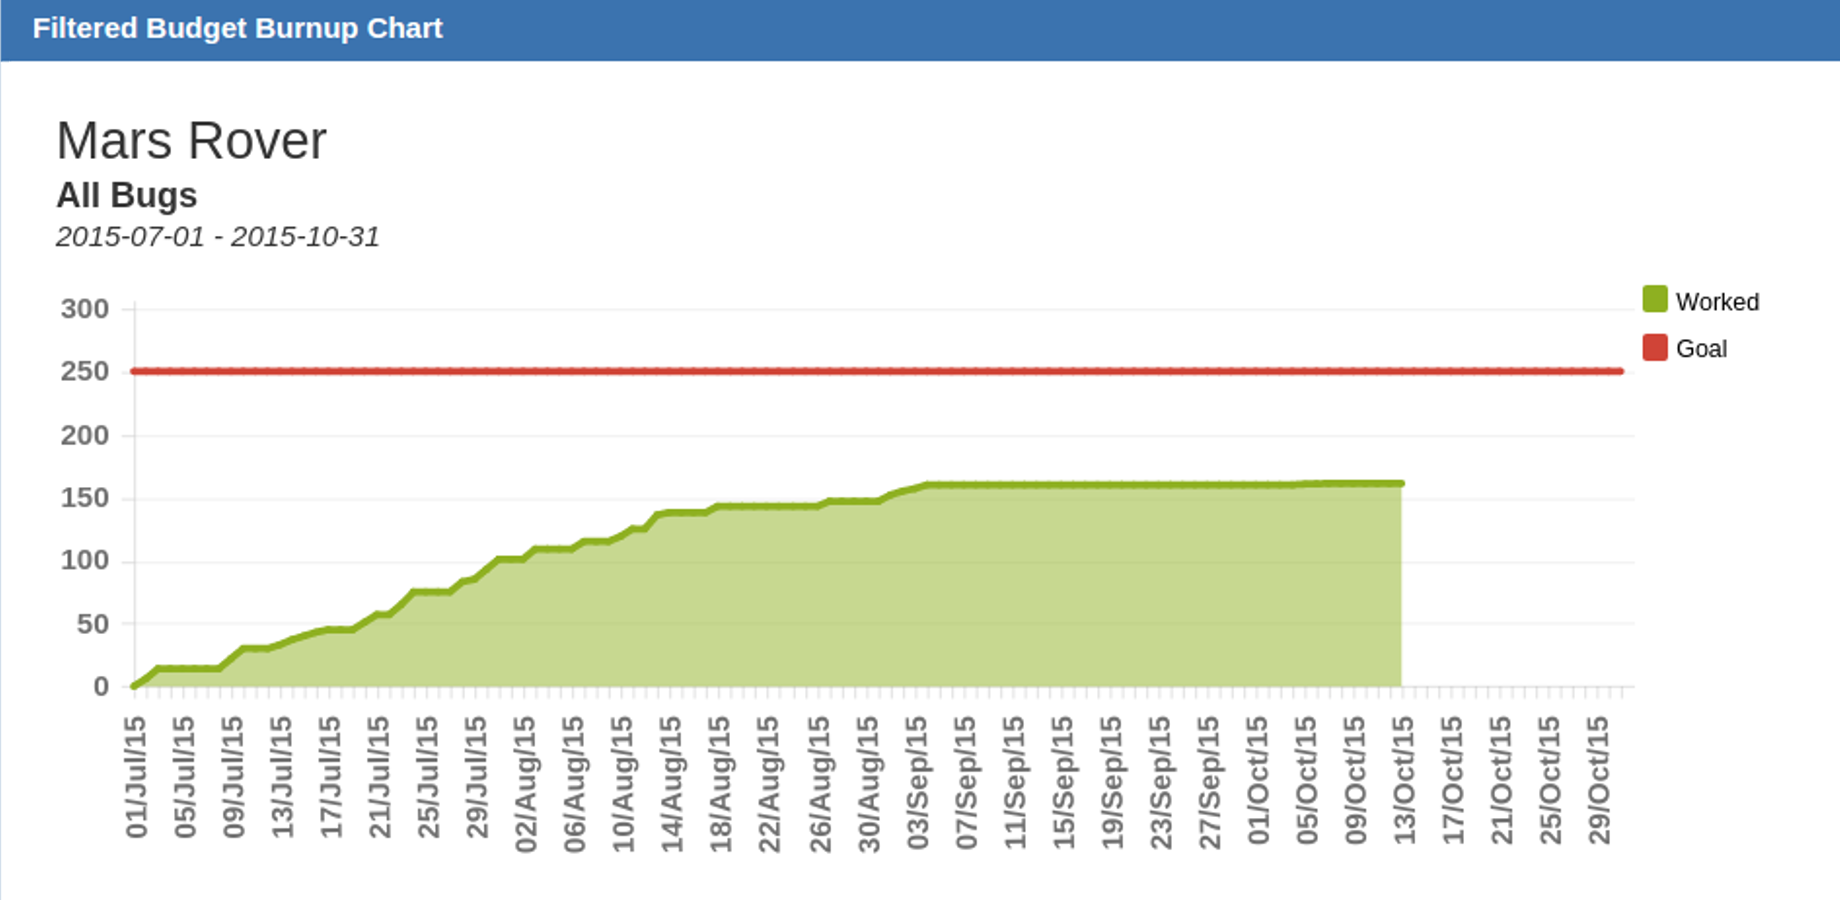
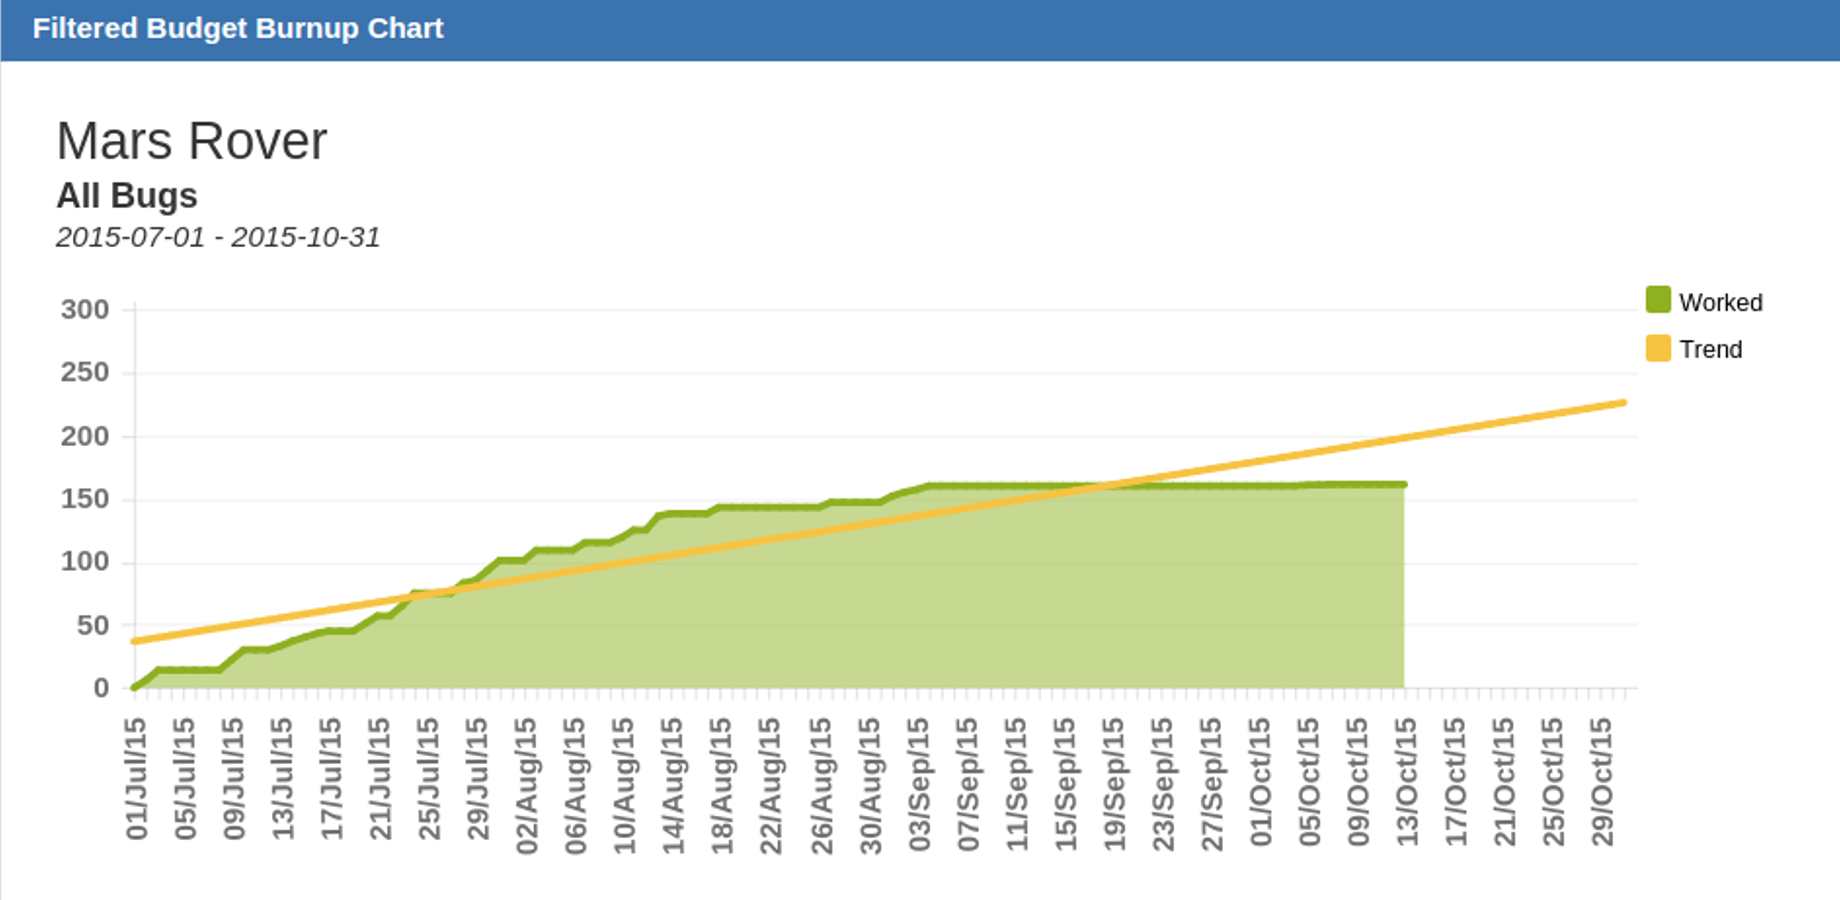
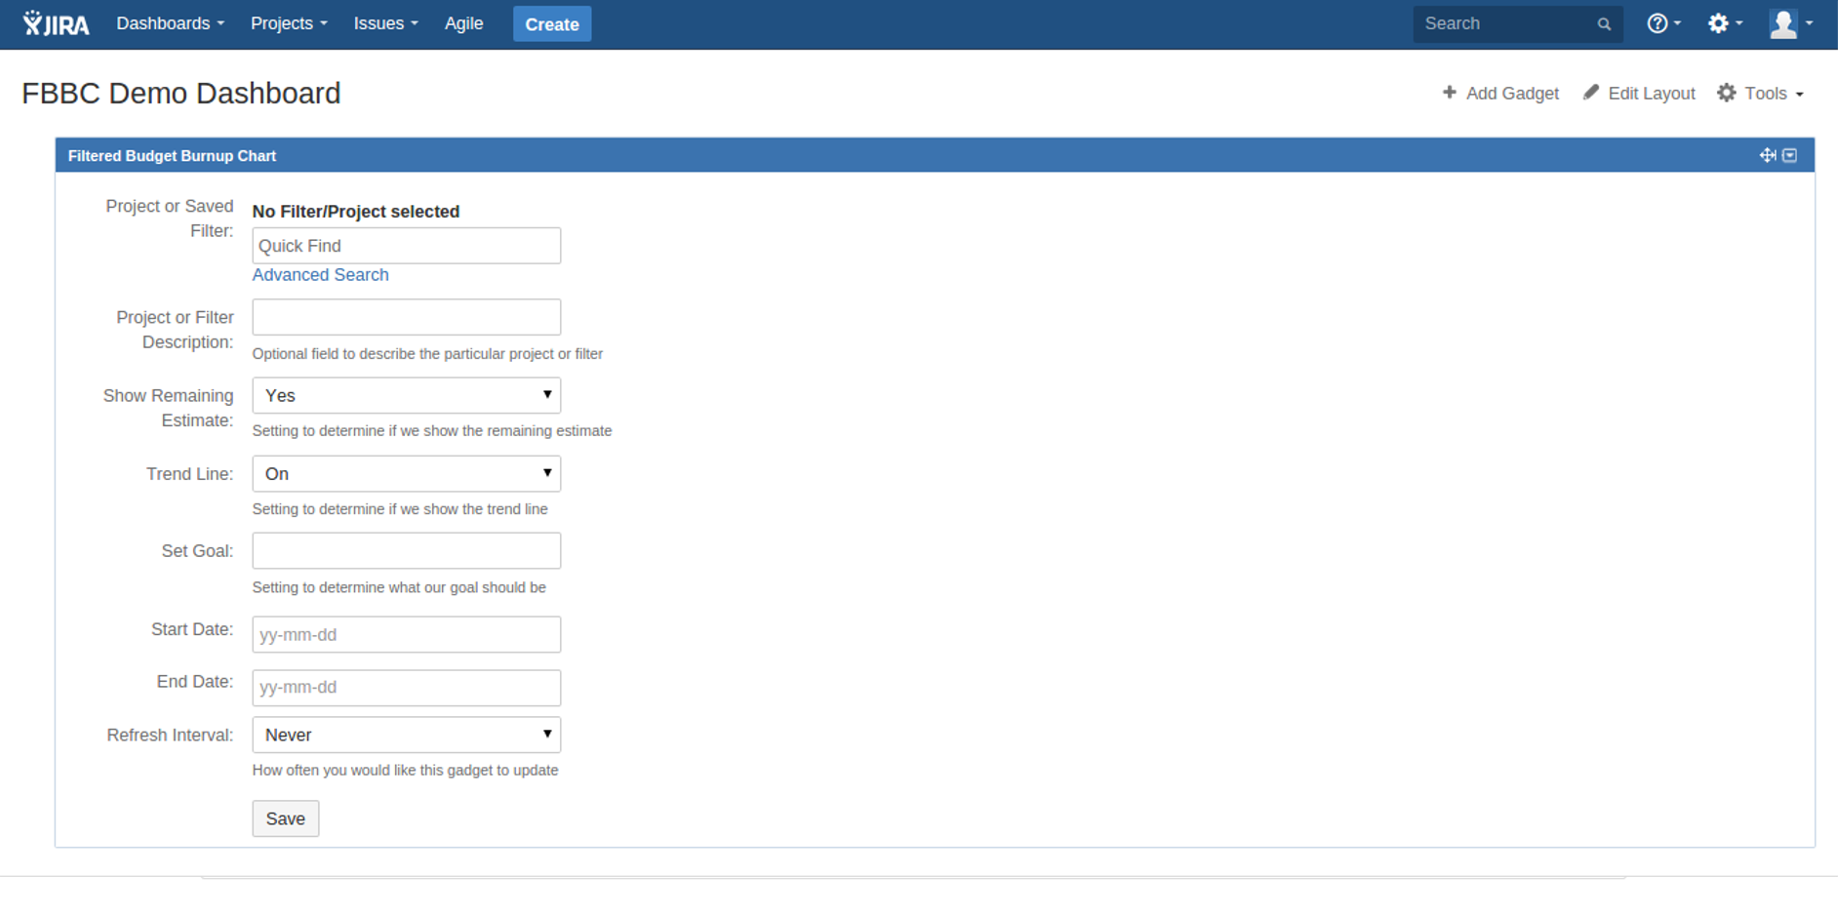
The Filtered Budget Burnup Chart calculates all the work completed for any project or filter and displays the results in an easy-to-read chart. Users also have the ability to show remaining estimates, show a trend line, or set a budget goal.
How I built it
Filtered Budget Burnup Chart was built over the course of several weeks using the Atlassian SDK, Java, JavaScript, jquery, and html.
Challenges I ran into
The algorithms to retrieve and display remaining estimates properly proved to be more difficult than we thought.
Accomplishments that I'm proud of
Our team has greatly improved our knowledge of the Atlassian SDK. We've created a plugin that will be highly useful in our own organization and wanted to release it to the marketplace for others to benefit from.
What I learned
One of our team members is a new developer and has learned a lot about the Atlassian software as well as improving their coding practices.
What's next for Filtered Budget Burnup Chart
Our team is currently in the early stages of created a connect version for this plugin. We are also open to adding new features in the future.
Built With
- aui
- java
- javascript
- jquery
- netbeans
- rest


Log in or sign up for Devpost to join the conversation.