-
-
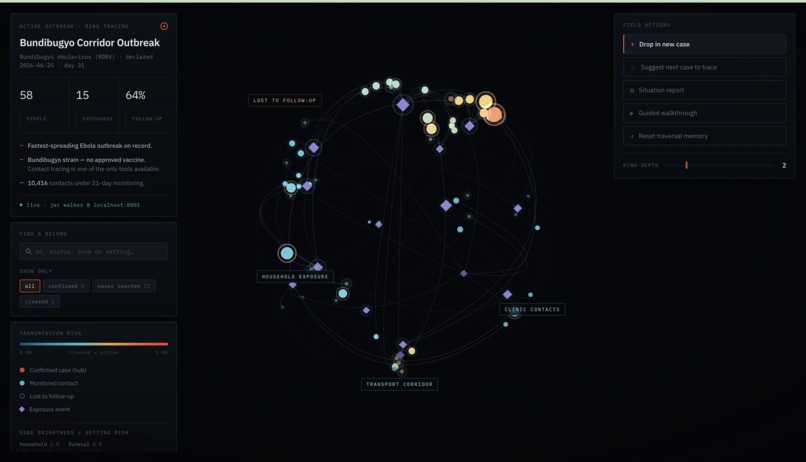
main user interface
Inspiration
We started the day scrolling through the same headlines everyone else was seeing: the DRC is in the middle of the fastest-spreading Ebola outbreak ever recorded, caused by a strain with no approved vaccine. When there's no pharmaceutical fix available, the only real weapons left are case isolation, supportive care, and contact tracing. Of those three, contact tracing is the one that actually gets ahead of the disease instead of just reacting to it.
What stuck with us was a single operational detail buried in the reporting: field teams were trying to monitor over 10,000 contacts, and someone had to decide, every single day, which of those contacts mattered most to check on first. That decision was mostly being made by hand. That felt like a problem we could actually help with in a day, not because we could cure a disease, but because "who do I check on first, given limited people and a lot of connections" is fundamentally a graph problem. We wanted to build something that treated it like one.
What it does
Filo represents an outbreak as a living graph. People and exposure events, like a household visit, a funeral, or a clinic trip, become nodes. When a new case is confirmed, an agent walks outward through the network to find everyone connected to it, scores each contact using real epidemiological factors, and hands that ranked list to an AI triage layer that turns it into an actual daily plan: who gets an in-person visit, who gets a phone check, and who can wait. It remembers everyone it has already traced, so a second confirmed case never re-processes contacts the system already knows about, and it flags anything unusual, like a case suddenly appearing in a health zone with no prior cases nearby. We also built a live 3D visualization so you can watch the network exist, not just read a table about it.
How we built it
We built Filo in Jac, a graph-native programming language where nodes, edges, and walkers are first-class citizens instead of something you bolt together out of dictionaries and lists. Person and ExposureEvent became our two node types, connected only through Attended edges, deliberately never connecting people directly to each other. Routing every connection through an event node meant one funeral with forty attendees became forty clean edges instead of a tangle of nearly a thousand person-to-person links, and it let each event carry real information, like its setting and date, that fed directly into our risk scoring.
The core of the project is a walker called TraceContacts. It performs a two-hop traversal from any confirmed case out through exposure events to other people, then scores each contact using three factors combined together: how risky the setting was, how recent the exposure was relative to Ebola's 21-day incubation window, and how many separate paths connected that person back to a case. On top of that traversal, we used Jac's by llm() feature to hand the ranked list to an AI model along with a real field capacity constraint, and got back a specific visit, phone, or wait recommendation with a one-line reason for each contact, instead of just a sorted list nobody could act on.
Because real, individual-level contact tracing data is confidential patient information we could never access, we generated a synthetic population instead, but we calibrated its scale using real, publicly available aggregate outbreak statistics by health zone, so the pressure and shape of our synthetic data actually reflected the real outbreak, even though no real person's information was ever used.
Challenges we ran into
Jac was new to all of us going in, and its syntax has genuinely shifted across recent versions, so more than once we built something against an example that turned out to be outdated and had to rebuild it against the current docs instead. Getting the risk-scoring formula right took longer than expected too. It's easy to combine three numbers into one score; it's much harder to make sure that score actually behaves the way a human would expect, like confirming by hand that a contact reachable through two separate events consistently outranked a similar contact reachable through only one. The memory and re-planning logic, keeping a second confirmed case from re-queuing people we'd already traced, ended up being the single trickiest piece to get right, mostly because it's also the easiest thing to fake without anyone noticing at a glance. And building a 3D interactive visualization that actually looked intentional, instead of like a default force-graph demo, under a hard deadline was its own separate scramble entirely.
What we learned
We learned that a graph model earns its keep the moment you have to answer a question like "how many independent ways is this person connected to a confirmed case," because that's a natural traversal in a graph and genuinely painful in a flat table or spreadsheet. We learned the difference between a script and an agent isn't a vibe, it's three concrete things: does it plan under a real constraint, does it remember across runs, and does it change its behavior when new information shows up. And we came away with a much sharper sense of where synthetic data is a legitimate substitute for real data and where it isn't; calibrating against real aggregate statistics let us build something that behaves like the real outbreak without ever touching a single real patient's information.
Built With
- byllm
- css
- html
- jac
- jaclang
- jaseci
- javascript
- llvmlite
- numba
- python
- three.js
- walker
- websockets
