Inspiration
We wanted to simplify how users analyze and visualize data from multiple CSV and Excel files using AI-driven insights and auto-generated charts.
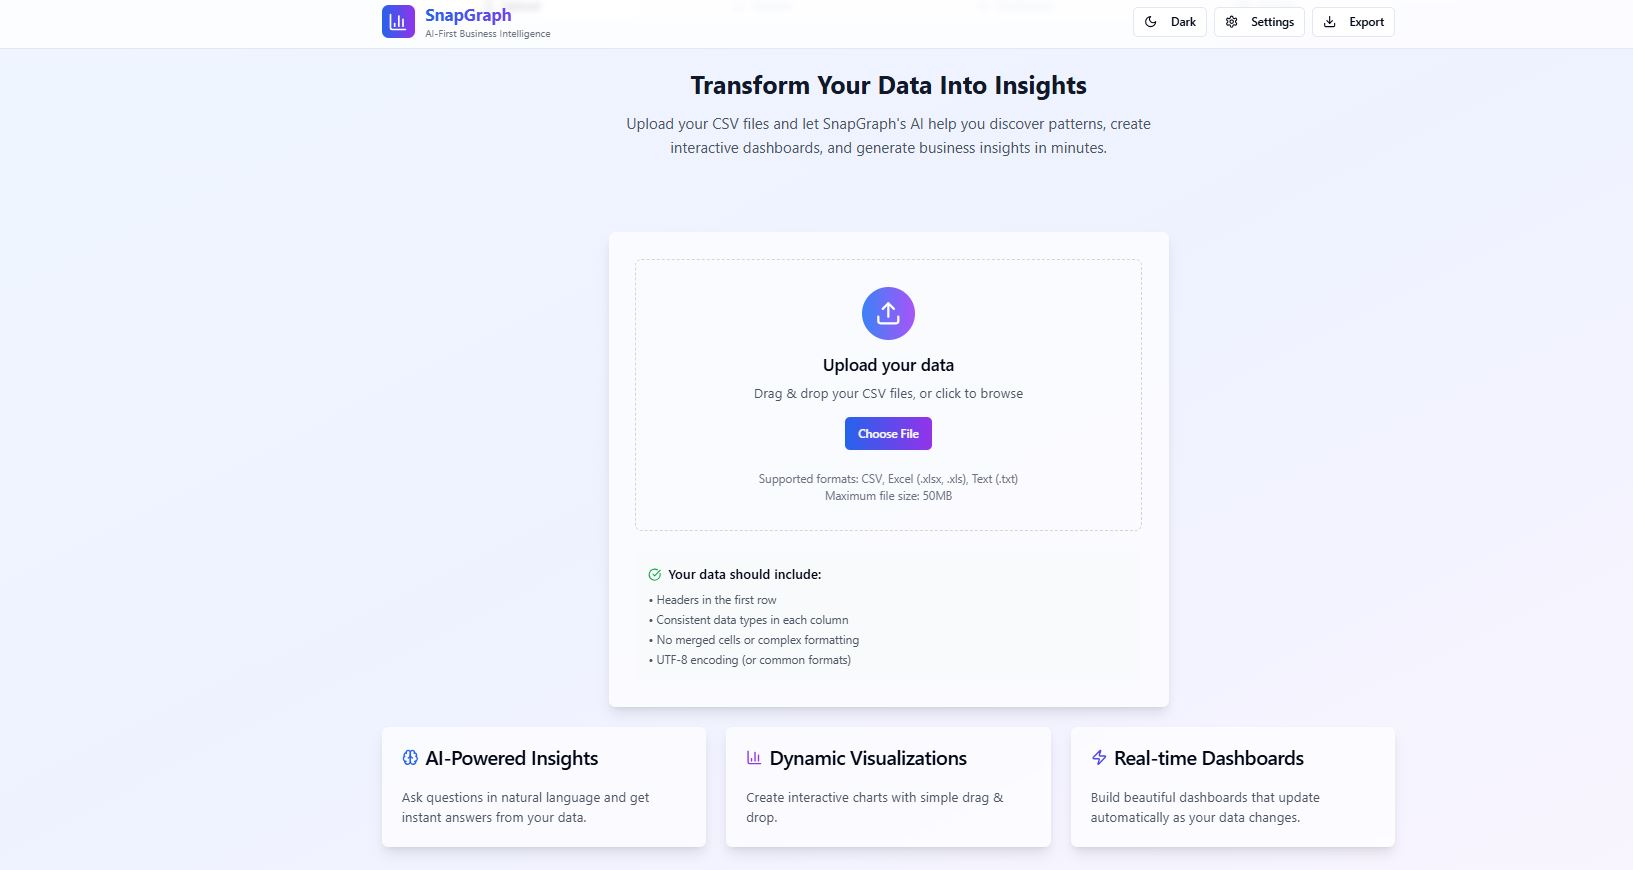
What it does
SnapGraph reads uploaded files, summarizes key insights using the Gemini API, and creates visual graphs automatically — making data understanding effortless.
How we built it
Built using HTML, CSS, and JavaScript, integrated with PapaParse for data handling, Chart.js for visualization, and Gemini API for AI insights.
Challenges we ran into
Handling multiple file uploads, merging datasets accurately, and optimizing real-time AI response speed.
Accomplishments that we're proud of
Successfully automated chart generation and AI insights across multiple files with a clean, intuitive interface.
What we learned
We learned how to combine AI models with frontend visualization tools and manage structured data efficiently.
What's next for SnapGraph
Adding natural language queries, database support, and real-time collaboration for advanced analytics.

Log in or sign up for Devpost to join the conversation.