-
-
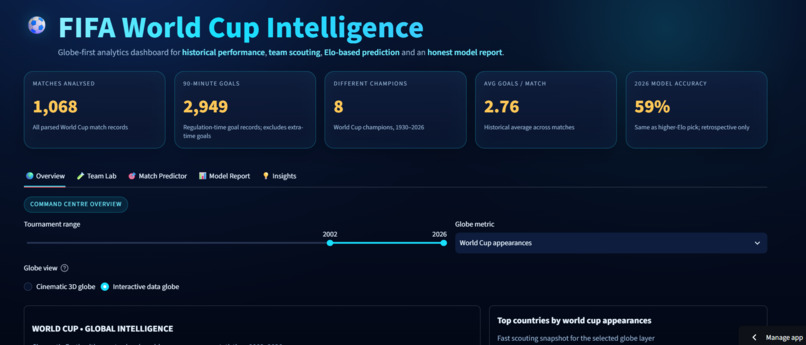
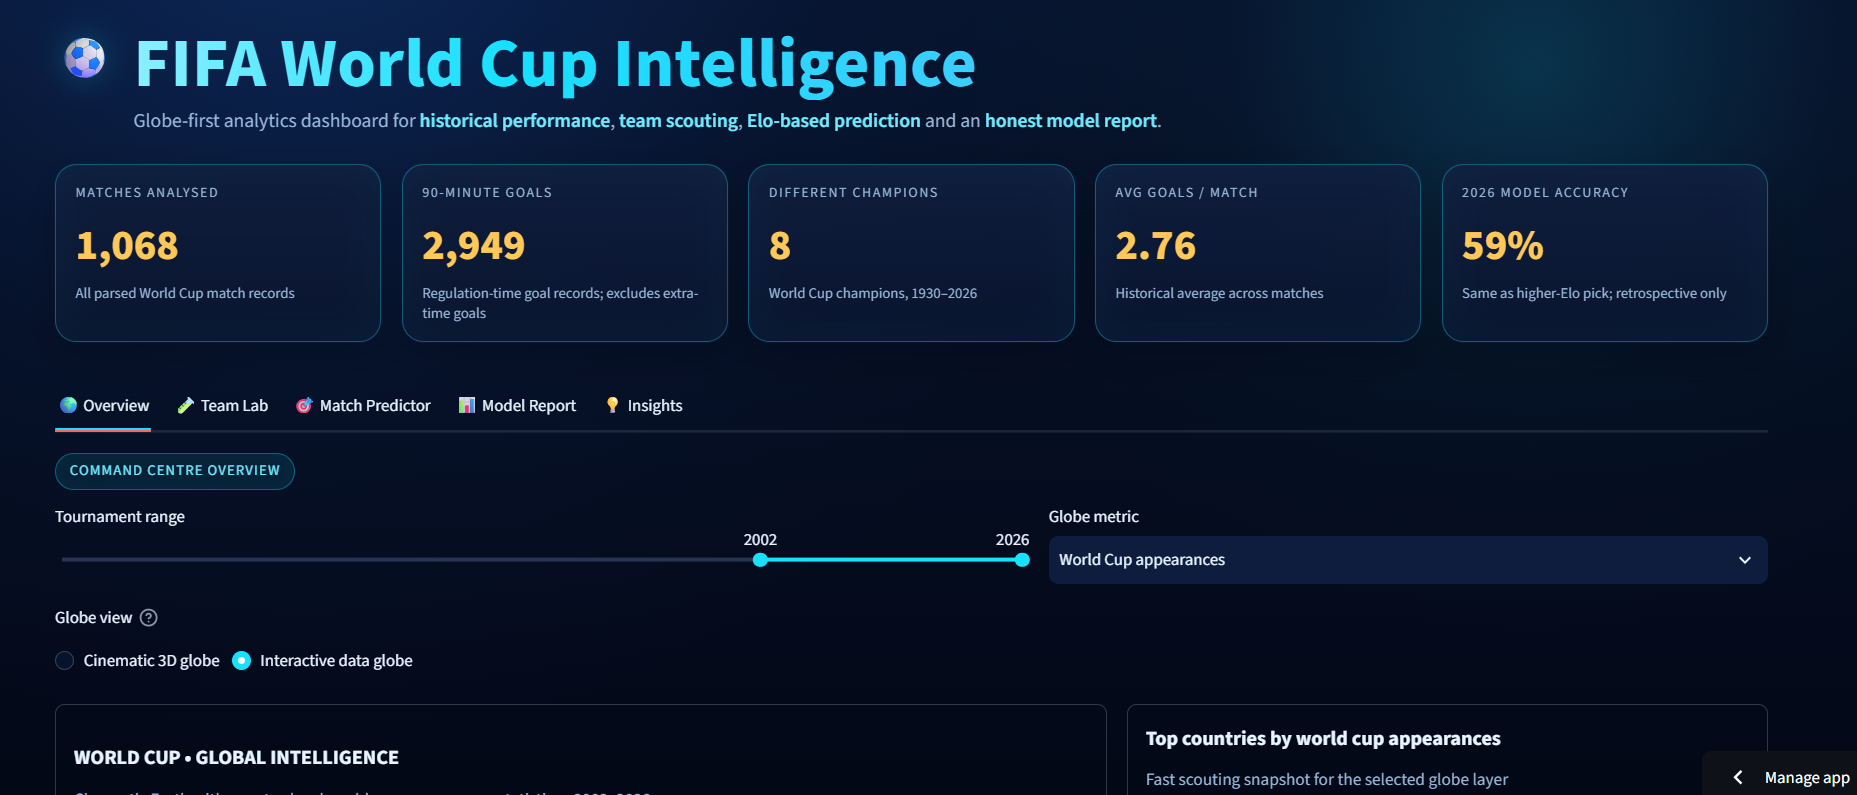
Dashboard header : Always-visible KPI summary cards
-
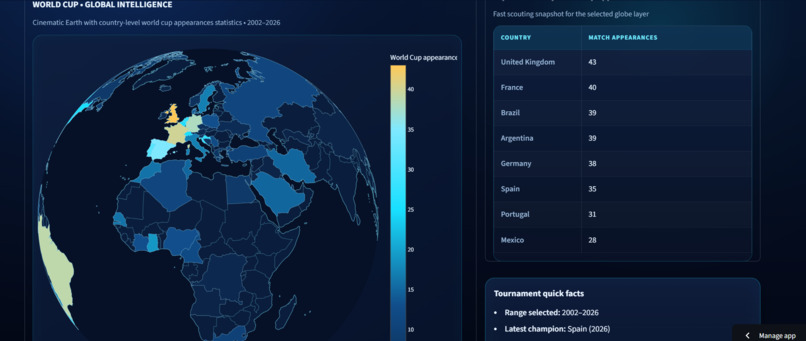
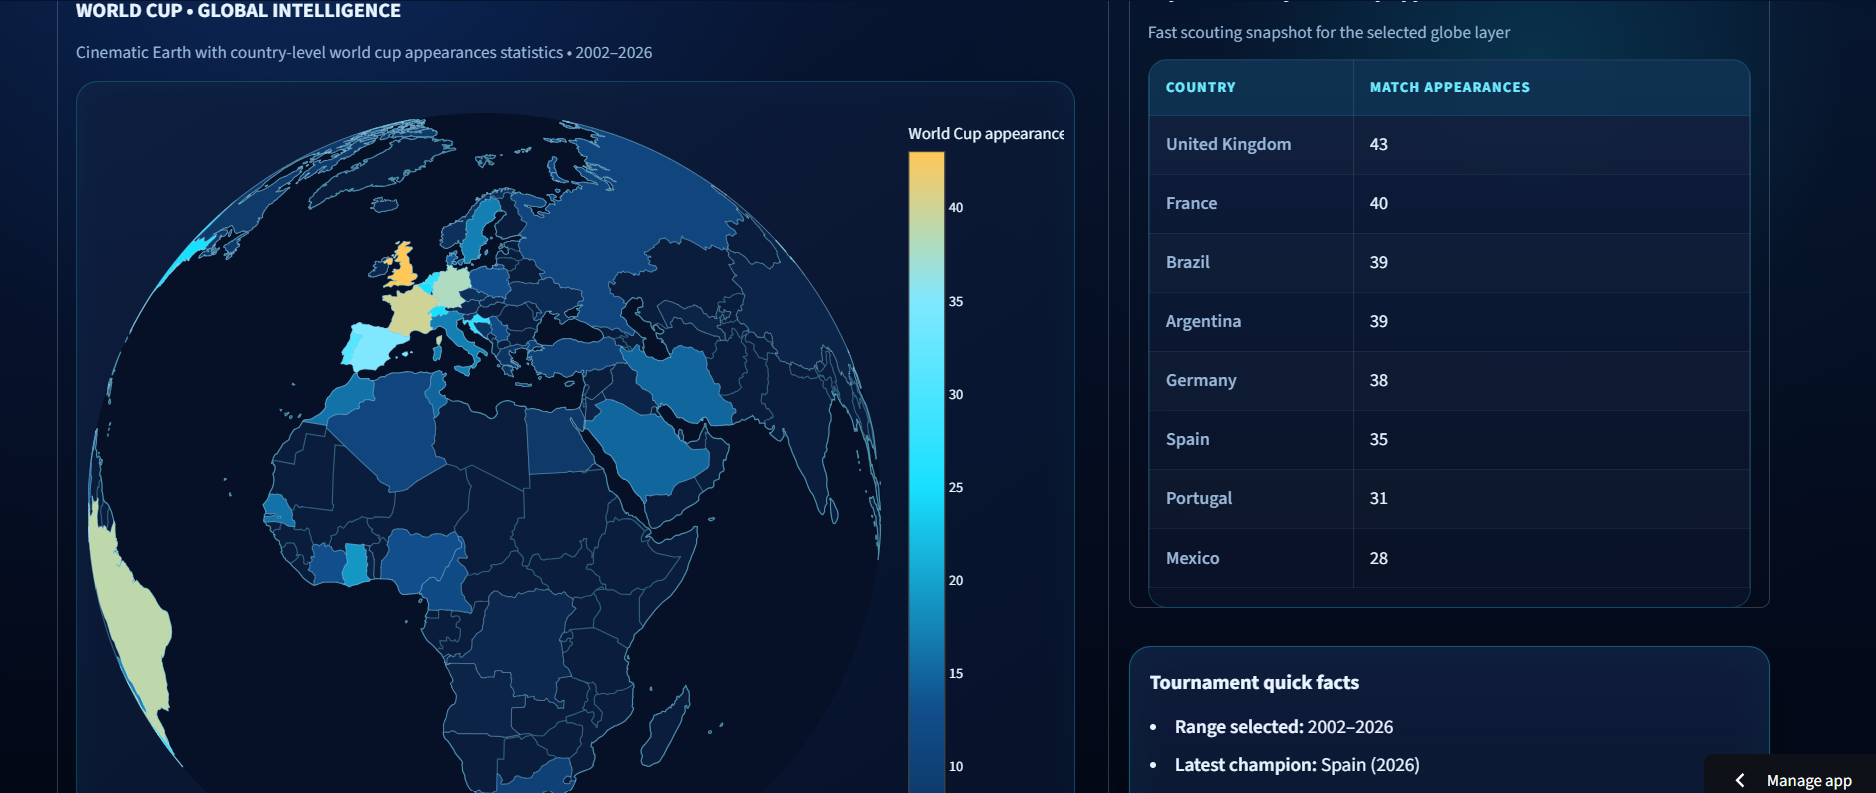
Overview : Main dashboard
-
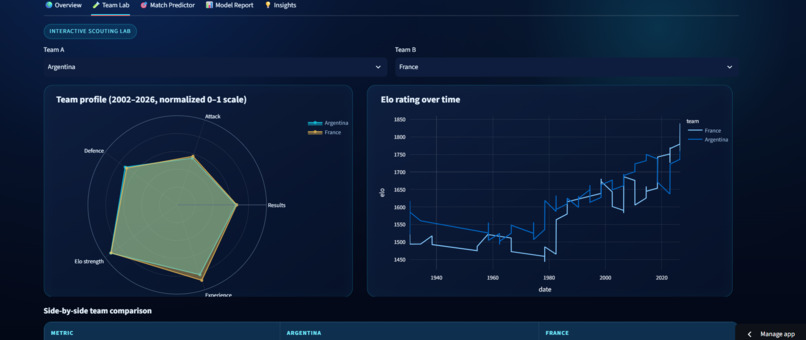
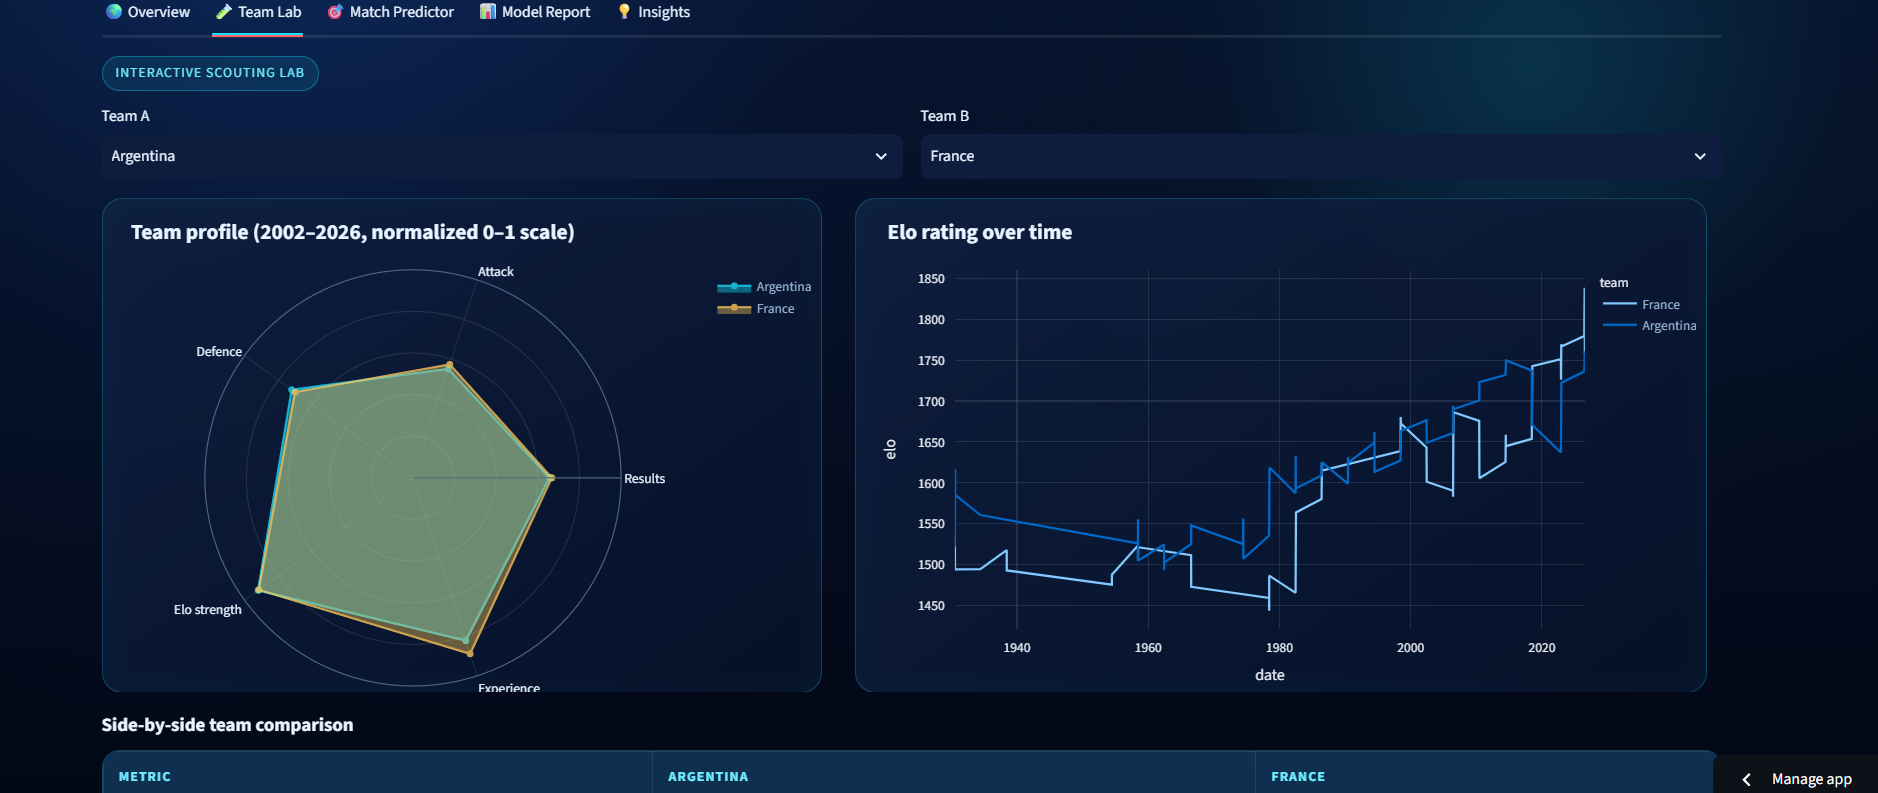
Team Lab : Team comparison
-
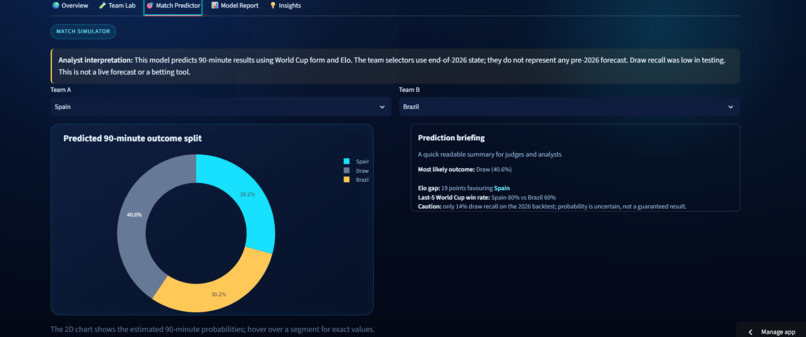
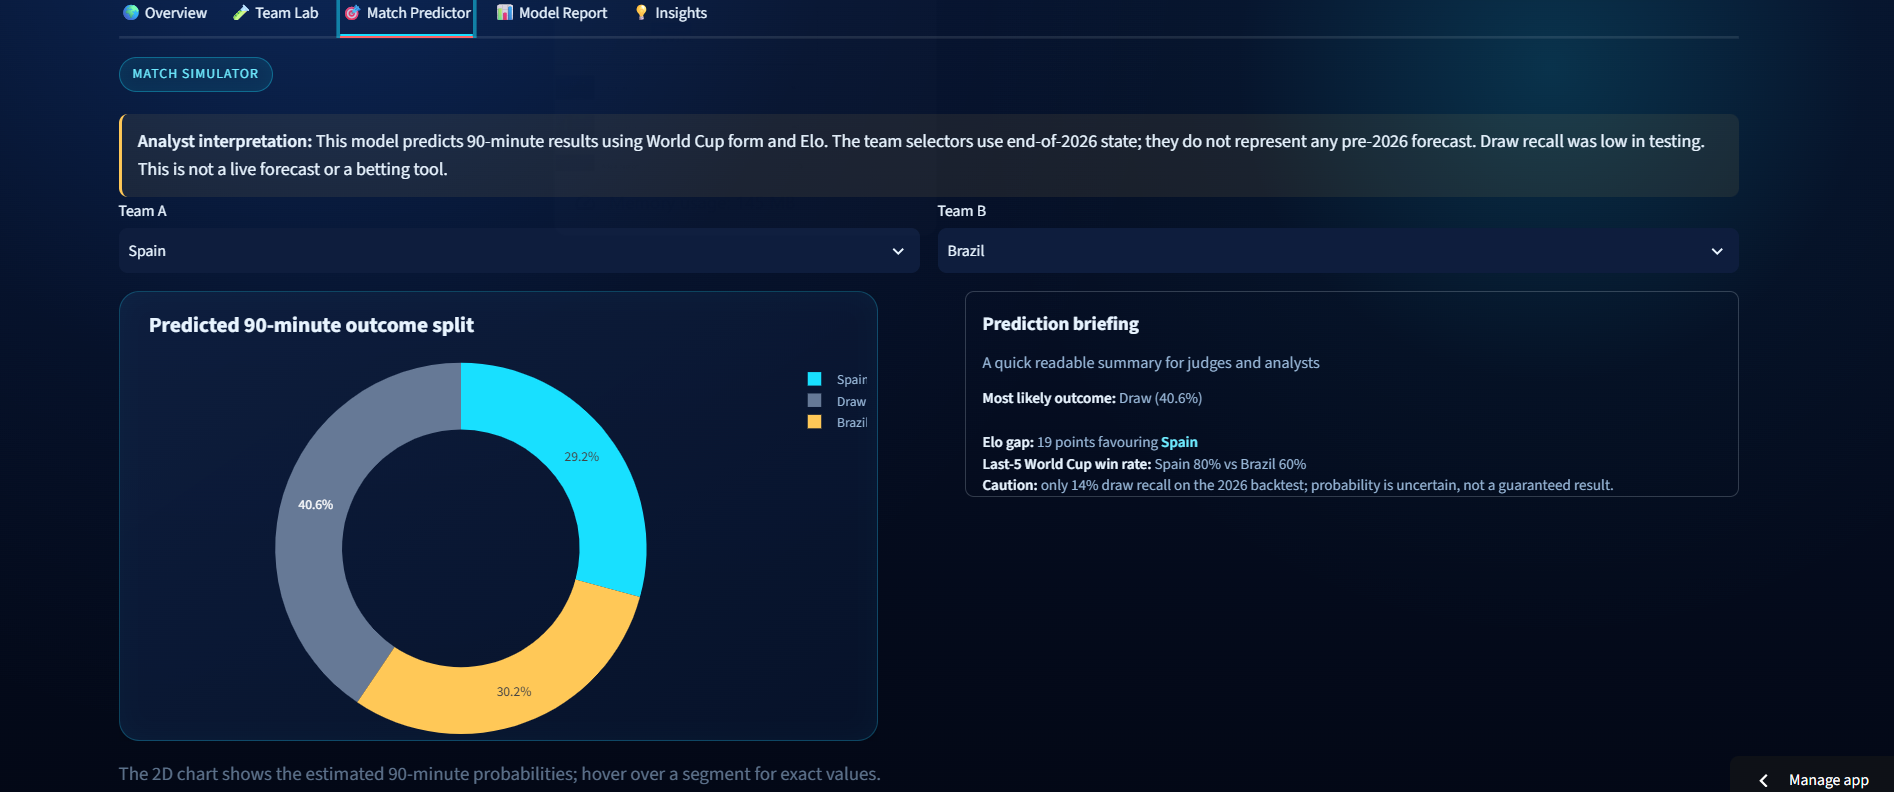
Match Predictor : Prediction interface
-
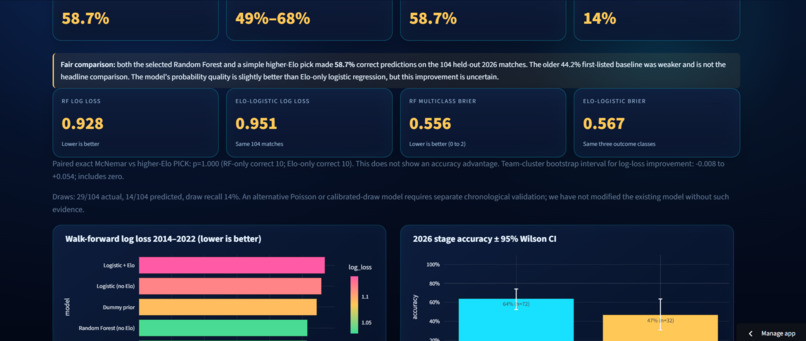
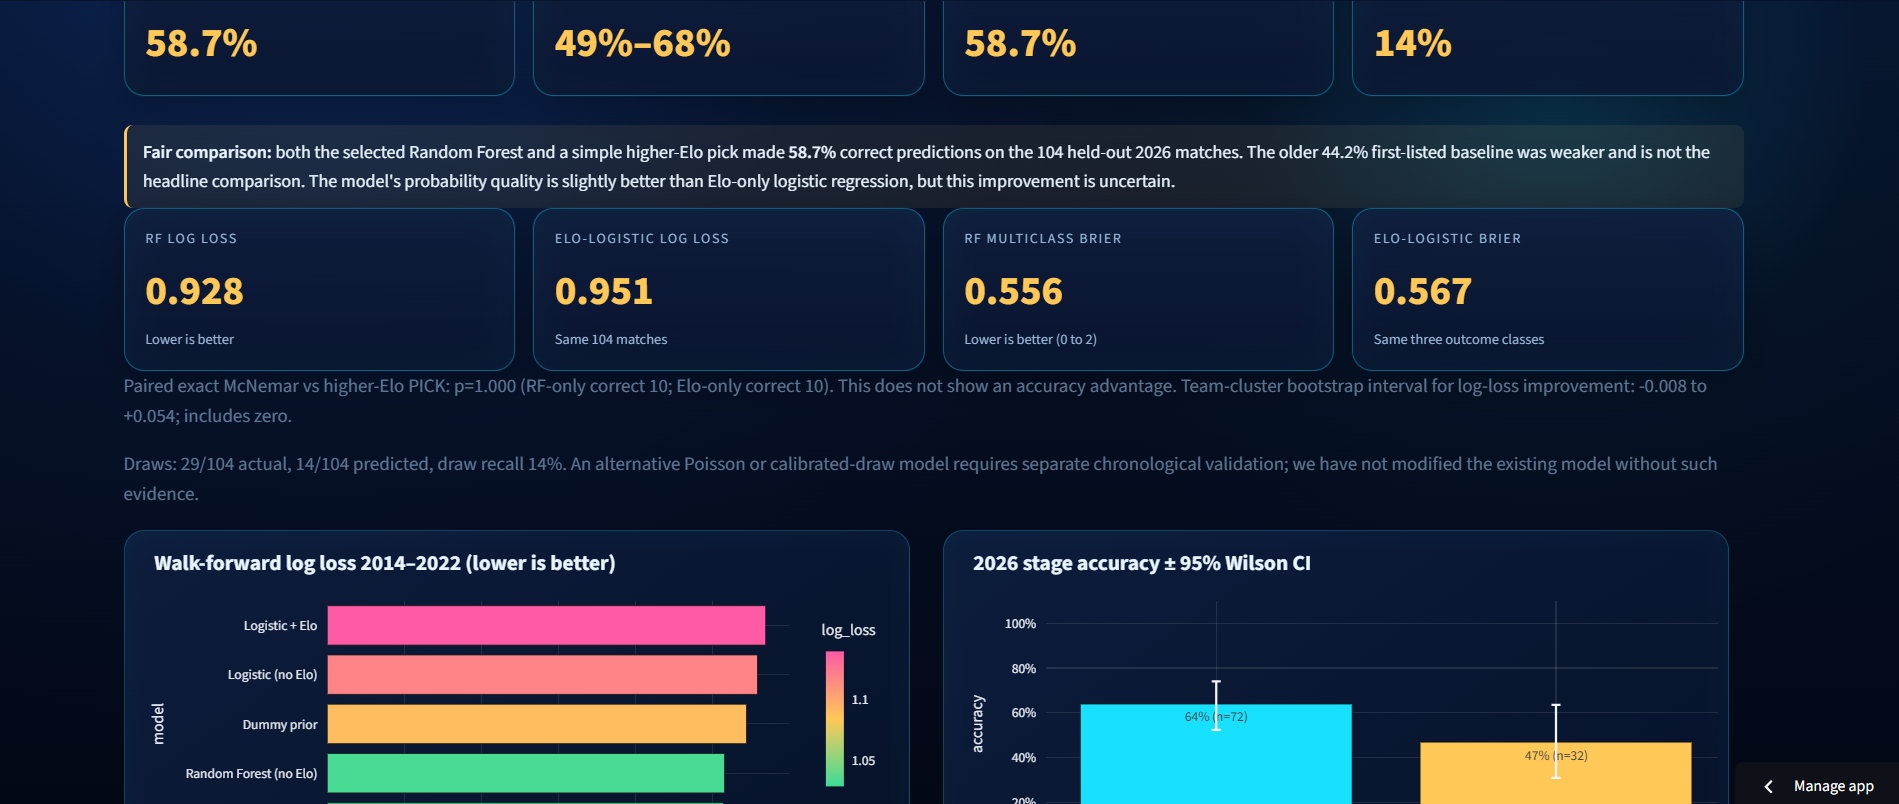
Model Report : Evaluation
-
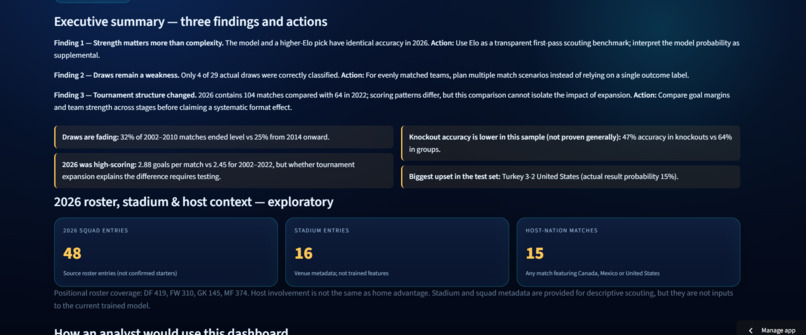
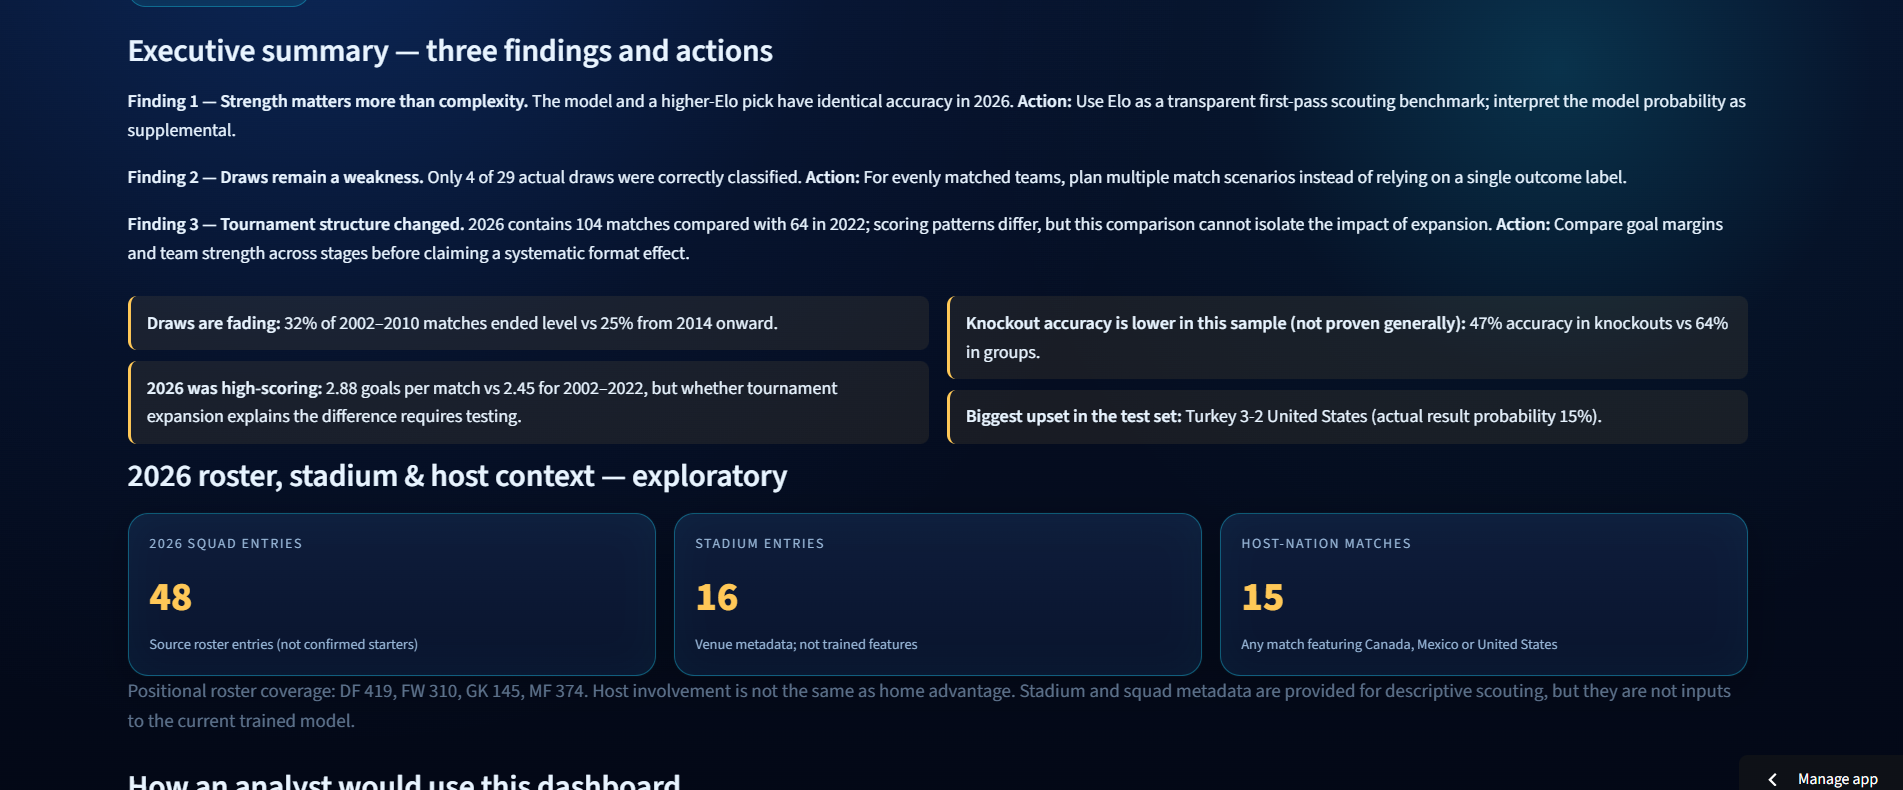
Insights : Three findings and actions
Inspiration
The FIFA World Cup has decades of historical data, yet exploring team performance, comparing national teams, and understanding match outcomes often requires switching between multiple sources. Traditional match prediction tools also tend to focus on predicted winners without explaining the historical evidence, uncertainty, or limitations behind their predictions.
This inspired me to develop FIFA World Cup Intelligence, an interactive sports analytics platform that combines historical visualization, team scouting, and machine learning. The goal is not simply to predict match outcomes, but to make football analytics more accessible, interpretable, and evidence-driven.
What it does
FIFA World Cup Intelligence transforms men's World Cup match data from 1930 to 2026 into an interactive dashboard featuring five main sections:
- Overview: Explore World Cup history through an interactive 3D globe, tournament statistics, championship distributions, and scoring trends.
- Team Lab: Compare national teams using historical Elo ratings, performance radar charts, offensive and defensive statistics, and illustrative historical lineups.
- Match Predictor: Explore retrospective match-outcome scenarios with Random Forest probabilities for a win, draw, or loss within 90 minutes.
- Model Report: Evaluate the model against simpler Elo-based benchmarks using accuracy, log loss, calibration, feature importance, and error analysis.
- Insights: Discover historical upsets, team performance patterns, defensive trends, and actionable analytical findings.
Rather than treating predictions as guaranteed results, the platform emphasizes understanding why a model produces its estimates and where those estimates may be unreliable.
How I built it
The project was developed using Python, Streamlit, Pandas, NumPy, Scikit-learn, Plotly, and Three.js.
I began by preparing historical World Cup match data, using OpenFootball's openly licensed dataset for the public release. Data cleaning, exploratory analysis, and feature engineering were performed using Python and Jupyter notebooks.
For predictive modeling, I implemented a Random Forest classifier and a historical World Cup-only Elo rating system. The modeling workflow uses chronological validation and a held-out 2026 tournament for retrospective evaluation, reducing the risk of introducing future match information into earlier training periods.
The interface was developed with Streamlit, while Plotly provides interactive statistical visualizations. Three.js powers immersive 3D elements, including the globe and football pitch visualizations.
Finally, the application was deployed through Streamlit Community Cloud, with the source code and reproducible analytical workflow published on GitHub.
Challenges I ran into
One major challenge was integrating historical match records across different World Cup eras while accounting for incomplete metadata, inconsistent tournament formats, and differences between regulation-time results and eventual knockout winners.
Another challenge was developing a meaningful predictive evaluation. A more complex machine-learning model does not necessarily outperform a simpler statistical benchmark, making it important to compare model results fairly rather than relying on accuracy alone.
Data licensing was another consideration. To support responsible public distribution, the released dataset was rebuilt using OpenFootball's CC0-licensed data, rather than redistributing earlier research data with unclear permissions.
From a development perspective, integrating interactive 3D visualizations with Streamlit, maintaining responsive layouts, and ensuring compatibility across visualization libraries required additional testing and refinement.
Accomplishments that I'm proud of
The project successfully combines historical analysis, interactive scouting, and machine-learning evaluation in one deployed application.
In the 2026 retrospective evaluation covering 104 matches, the Random Forest achieved 58.7% accuracy, matching the accuracy of a simple higher-Elo selection rule. Its multiclass log loss was 0.928, compared with 0.951 for an Elo-only logistic benchmark, although this difference does not establish reliable model superiority.
The evaluation also identified an important limitation: only 4 out of 29 actual draws were correctly classified, corresponding to 13.8% draw recall.
I am particularly proud that the dashboard communicates these weaknesses instead of presenting the machine-learning model as an unquestionably superior predictor. This makes the project useful for exploring uncertainty and choosing appropriate analytical methods.
What I learned
This project strengthened my practical understanding of the end-to-end data science workflow, from data preparation and feature engineering to model development, evaluation, visualization, and deployment.
Most importantly, I learned that model complexity does not automatically translate into better predictive performance. Establishing strong baselines, preventing data leakage, evaluating probability quality, and communicating limitations are essential components of responsible sports analytics.
I also gained experience integrating machine learning into an interactive application and making technical findings understandable to a wider audience.
What's next
Future improvements could include expanding the dataset beyond World Cup tournaments, experimenting with additional probabilistic models, improving draw prediction and calibration, and incorporating more contextual team-level features.
I would also like to enhance the scouting experience with richer historical comparisons and more detailed explanations of match-outcome scenarios.
Ultimately, FIFA World Cup Intelligence aims to demonstrate how data science can support more transparent and informed football analysis rather than simply generating predictions.
Built With
- javascript
- jupyter
- matplotlib
- numpy
- pandas
- plotly
- python
- scikit-learn
- scipy
- streamlit
- three.js

Log in or sign up for Devpost to join the conversation.