-
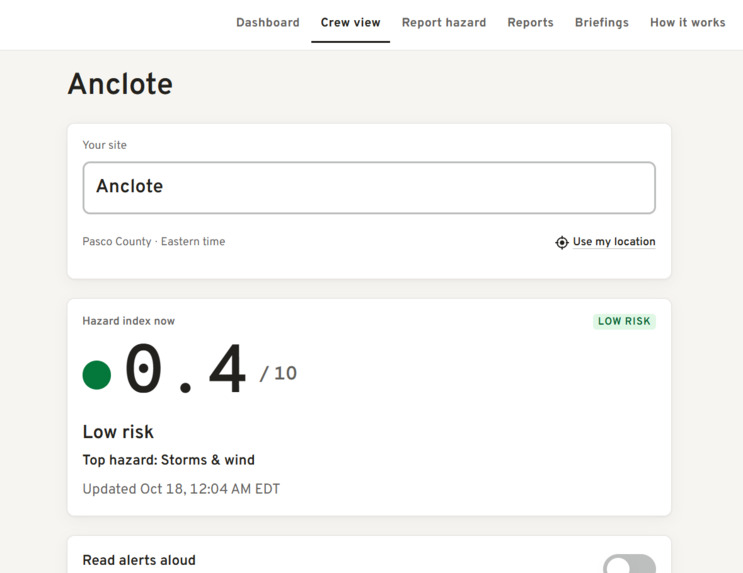
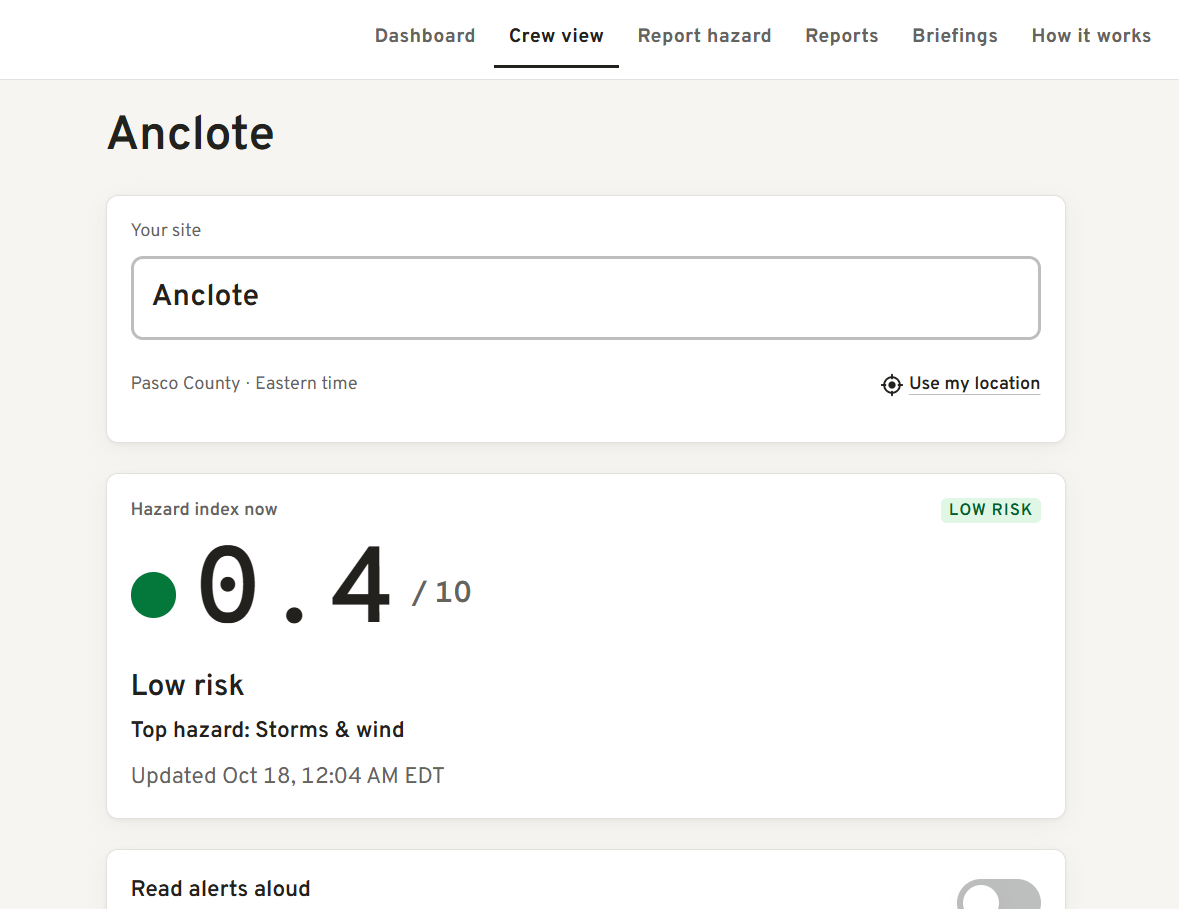
Crew View
-
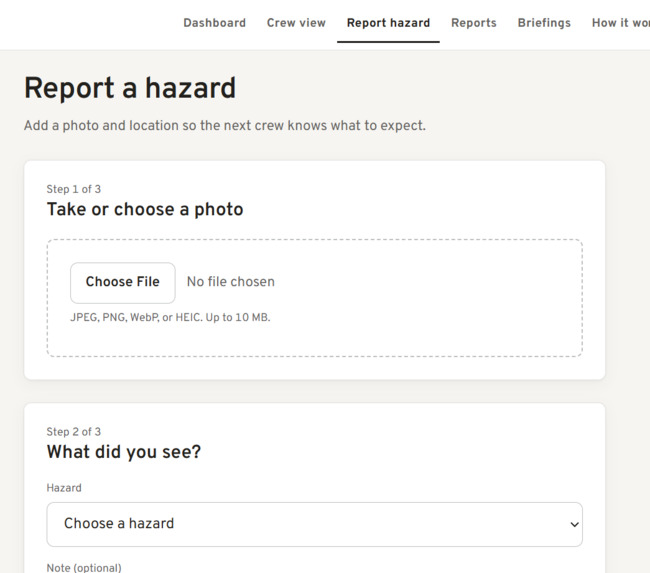
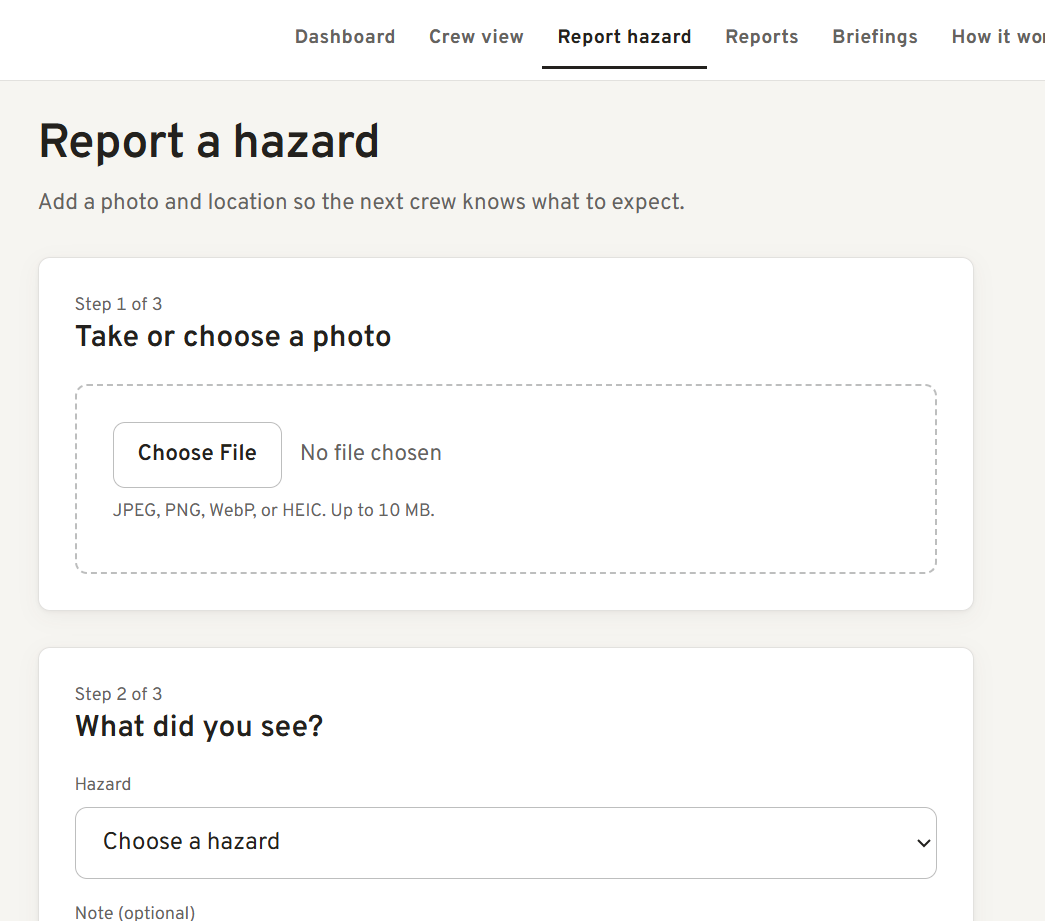
Crew Reports
-
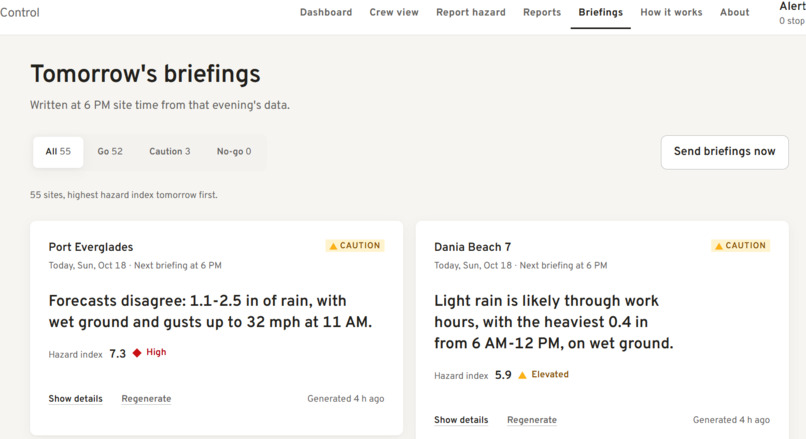
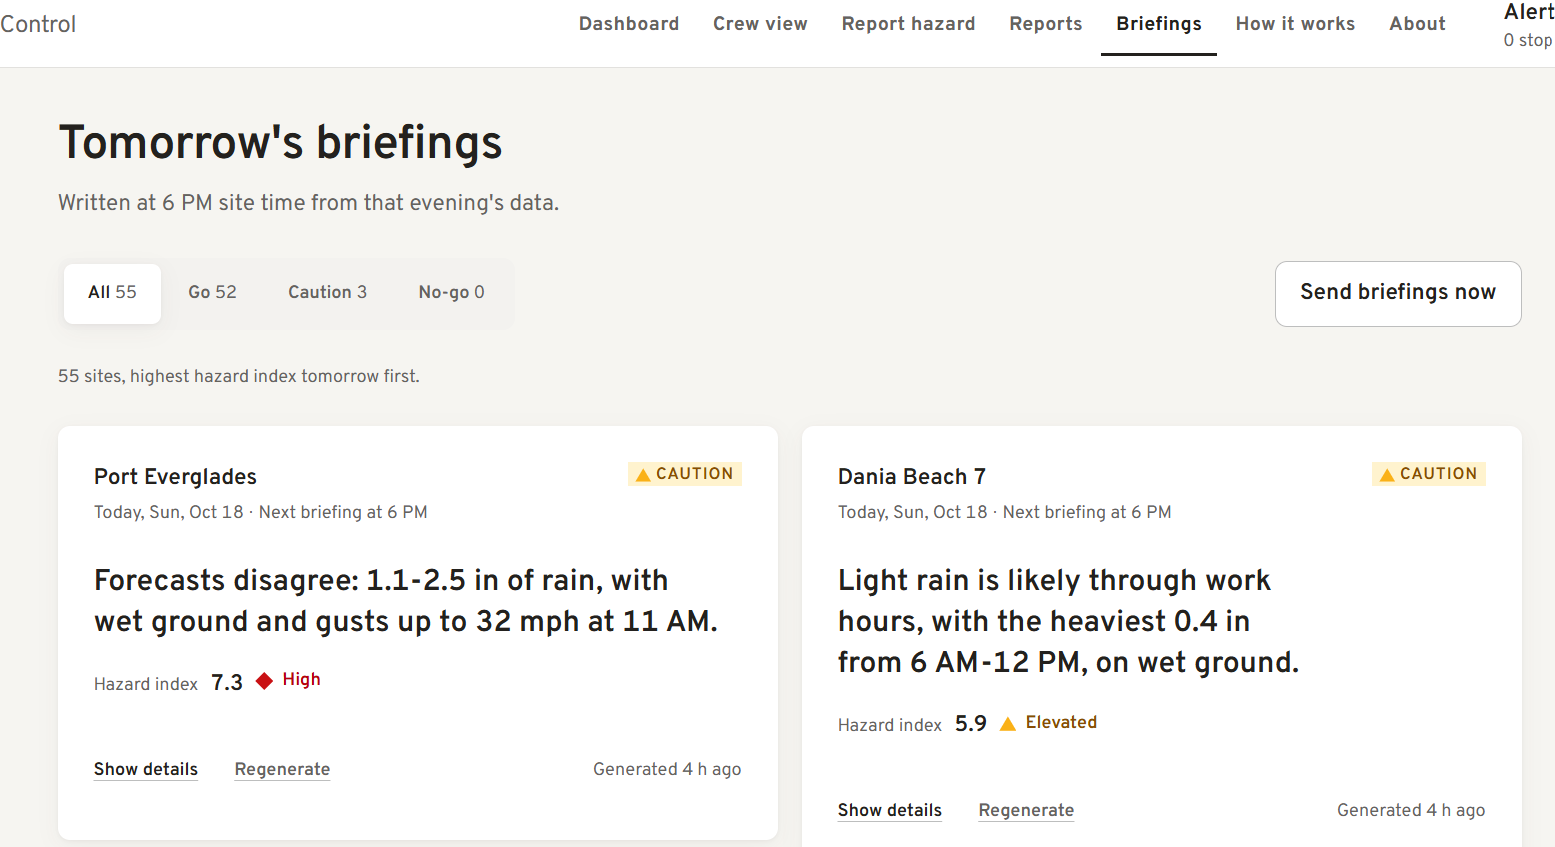
Briefings
-
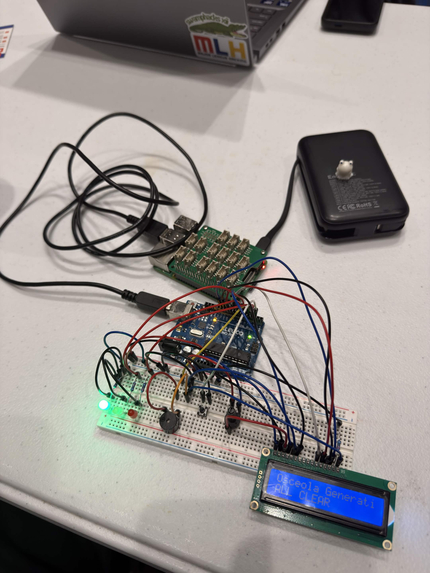
Hardware (Standby)
-
Dashboard
Inspiration
Heavily inspired by the Sperry Tech PlanIT Control challenge, we tasked ourselves to make an accessible platform that shows the hazards affecting plant sites with easy to understand statistics and interface. All the information to know whether or not a work site is safe the day before already exists, however it's spread across several agencies and apps, which forces a judgement call every night to decide if it's safe. We aimed to get rid of that by turning that data into clear decisions with Fieldcast.
What it does
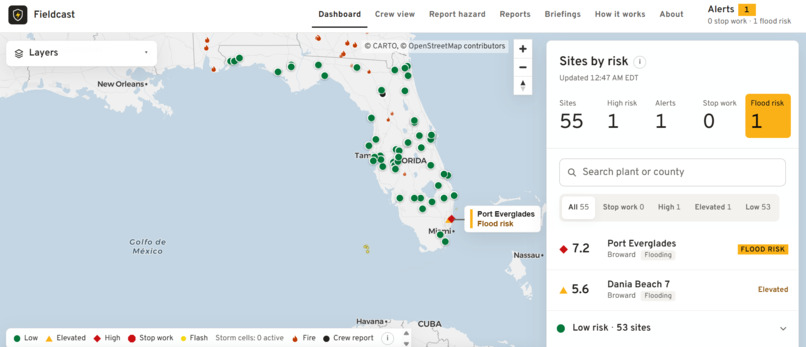
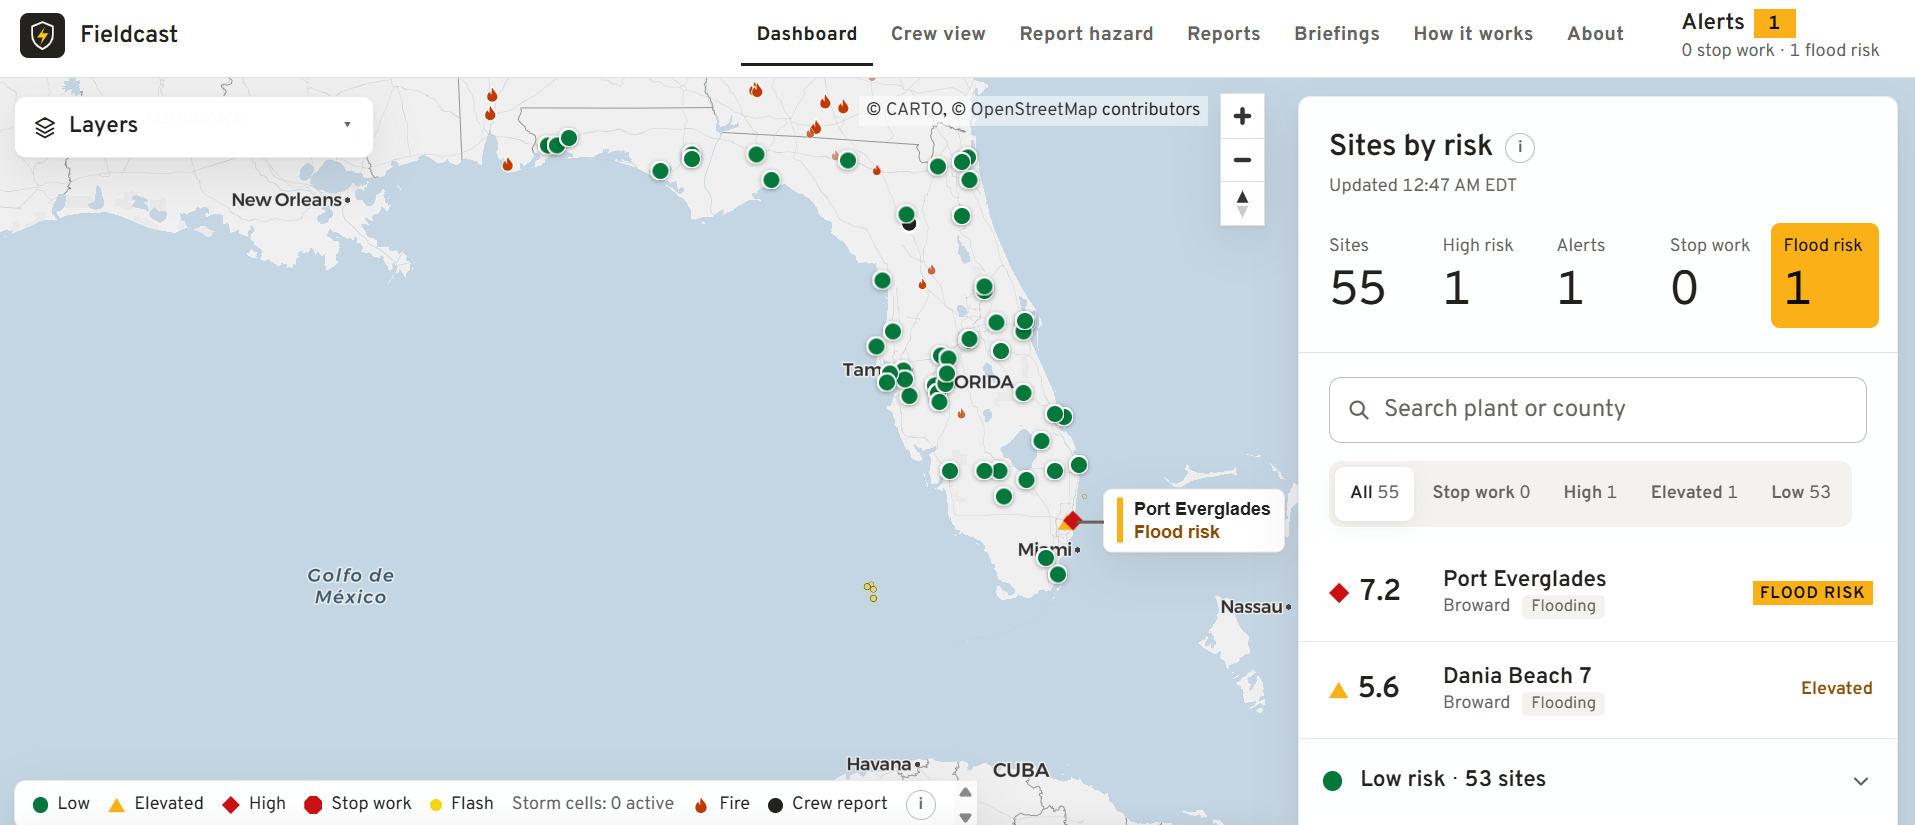
We watch over 55 real Florida power plants using information from the EIA-860M dataset, checking for hazards like heat, lightning, flooding, soil, wildfire, and wildlife, live at stormsafecrews.us.
We check every guideline provided in the challenge: Lightning = stop work. We check and process every lightning strike provided by the GOES-19 satellite to ensure no lightning strikes are within 10 miles of a site. If any are detected within range, we recommend all work is stopped for 30 minutes, with each new strike within range resetting the timer. If a lightning storm is predicted to come within the 10 mile range, a warning is provided on the site.
Flood warnings from heavy rain. We ensure any area with a high chance of flooding gets an alert, from NWS flood warnings and our rain forecast.
Next-day safety briefings provided at 6 PM, every day, in each site's own time zone.
Crew reports directly to the website, where other workers on site can easily know of any hazards that we can't detect with our data.
A dashboard, showing all sites with our hazard rating, allowing any management to quickly know what sites are at risk from a brief look.
A personally trained model built on LightGBM that provides a 0-10 hazard rating personalized for each site.
Of course, we didn't stop there:
We have push notifications, accessible for any person that needs it. You shouldn't have to rely on the diligence of management to know if a site is about to become too hazardous for work.
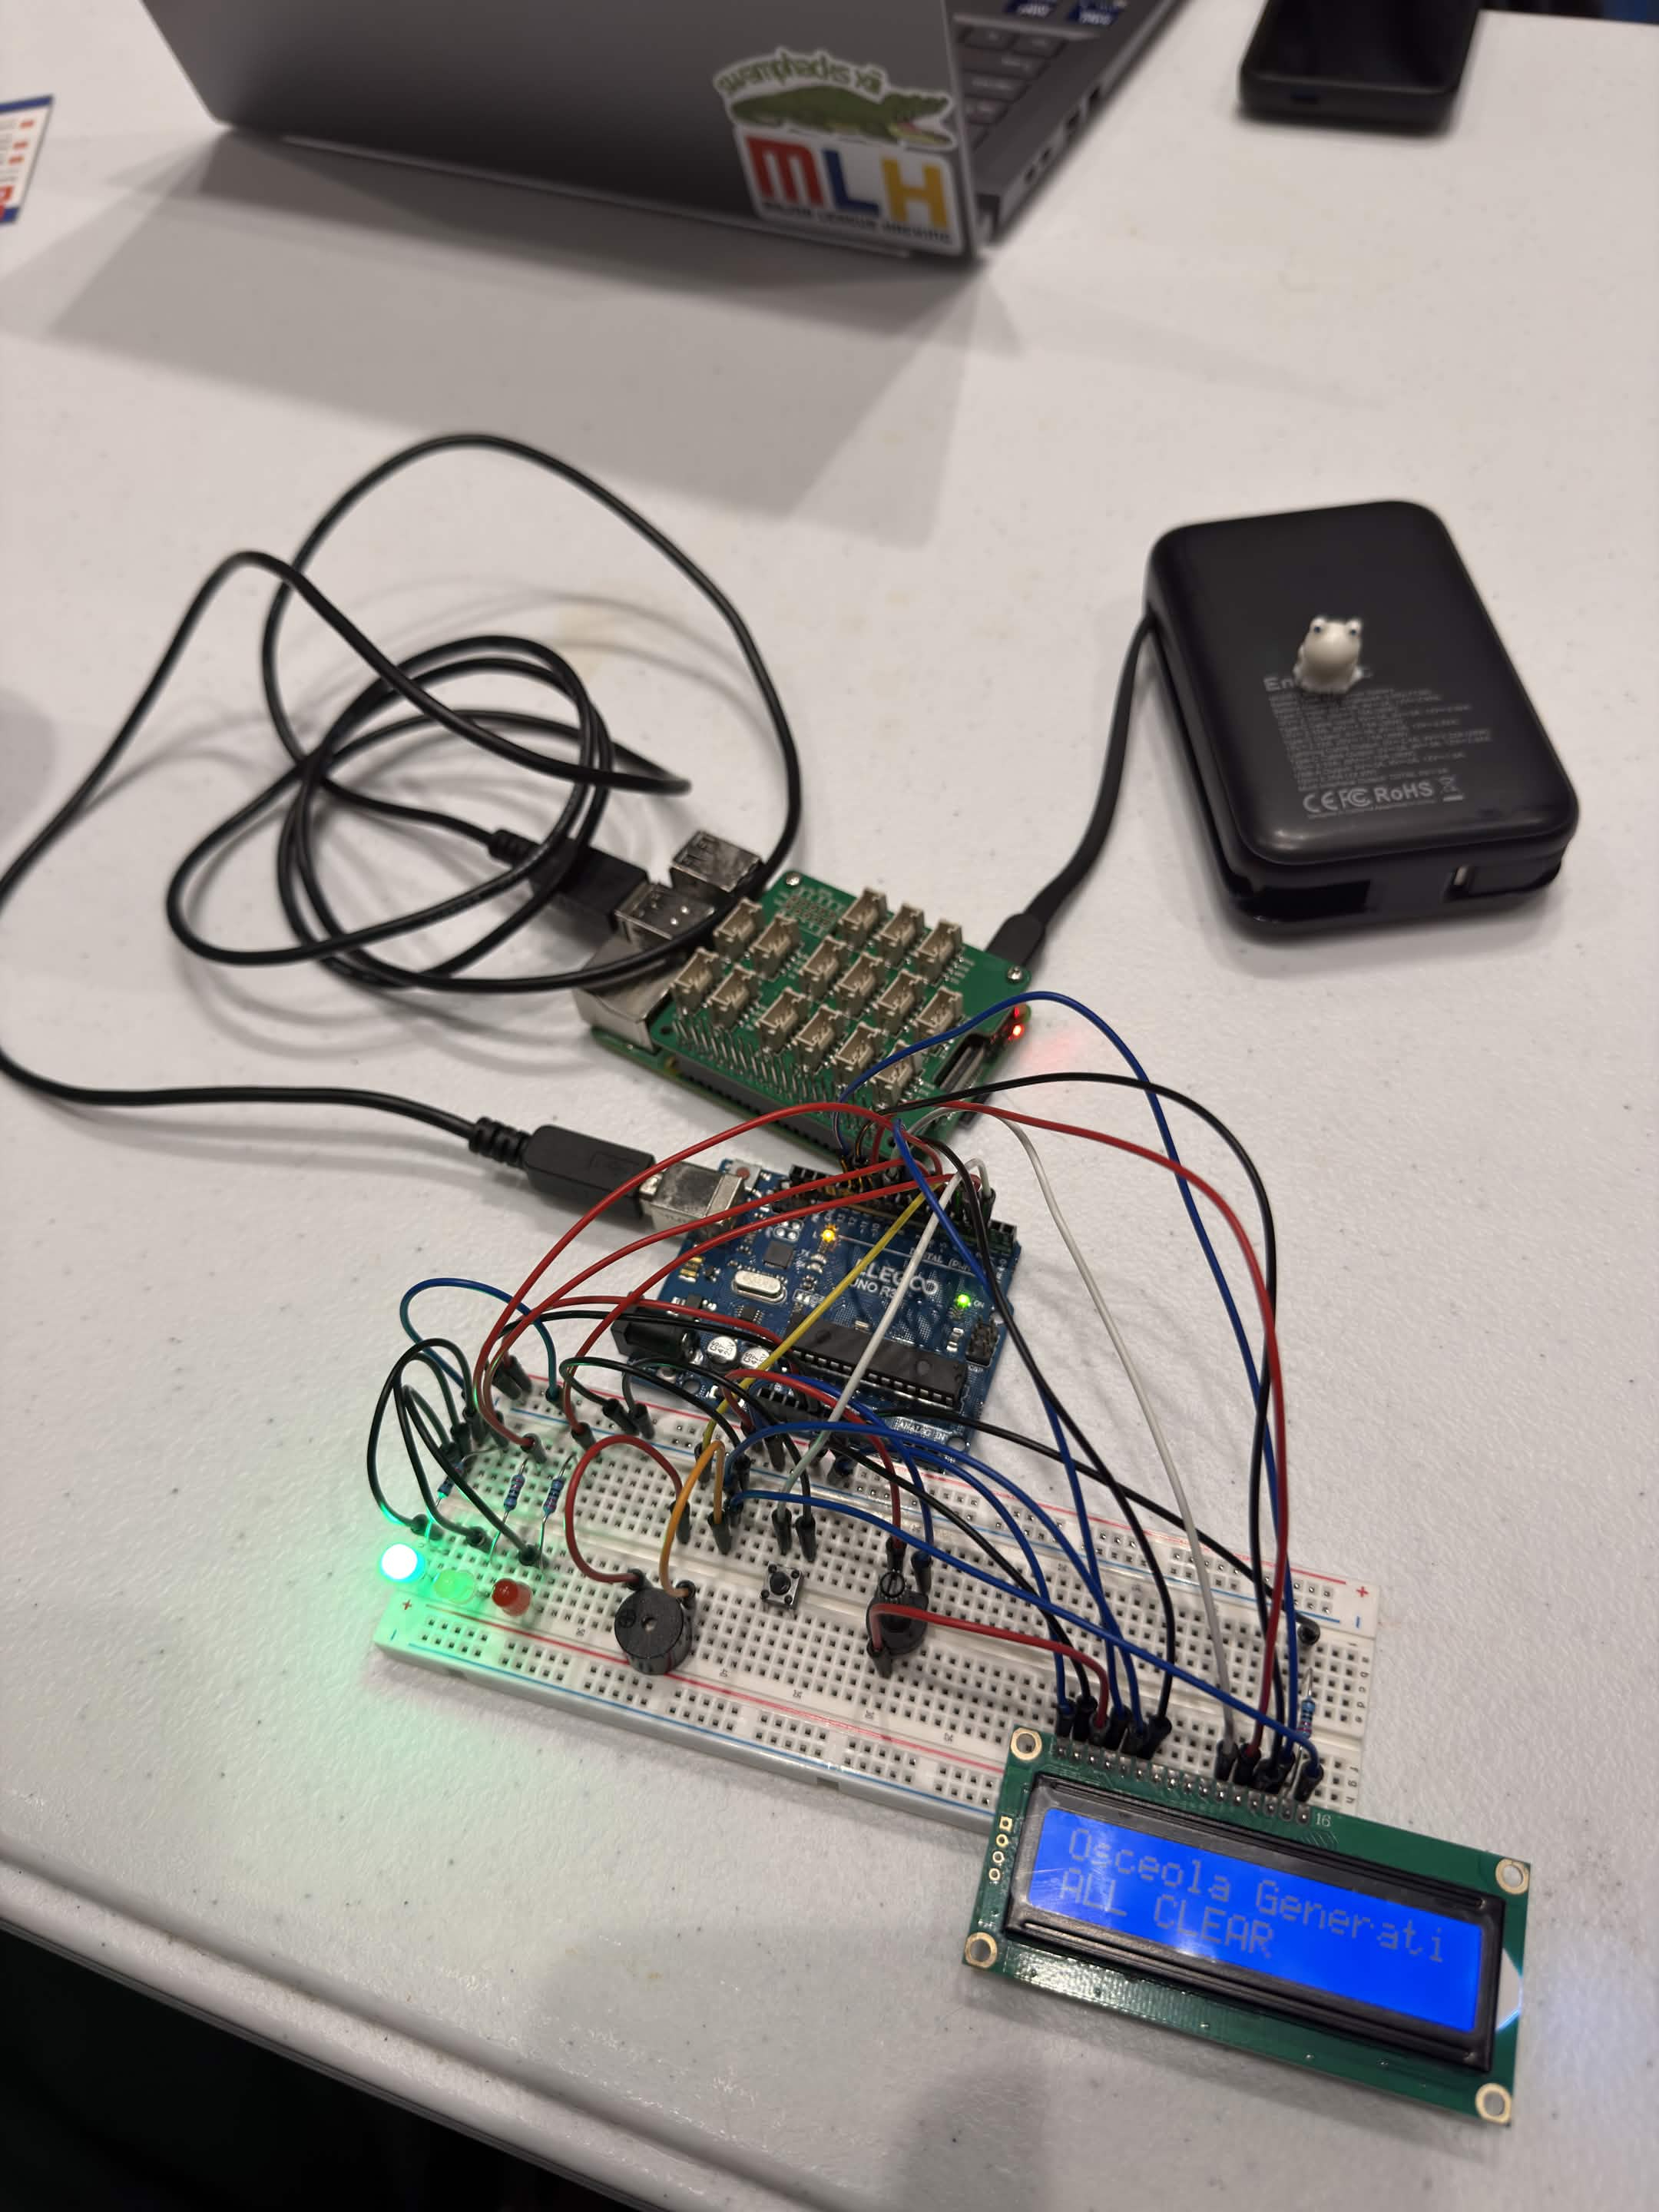
We designed a prototype beacon that connects directly to our API and plays an alarm any time a strike is detected within 10 miles. Anytime work should be halted, it is known.
We build on honesty and trust: we don't claim anything if we don't know it. Our service is down? We let them know. The satellite feed stalls? An active stop-work stays in place with "Waiting for lightning data", and no all-clear goes out until the data is back.
Proof that our system works: our replay system runs through a real storm, showing every strike that got picked up and every site that was told to stop work.
Most importantly, we didn't just build the app, it's actively working right now at stormsafecrews.us, with live information already provided.
How we built it
For the lightning strikes, we take the information directly from the GOES-19 satellite every 20 seconds. The information we obtain from Open-Meteo, NWS alerts, FEMA flood zones, USGS rivers, NASA FIRMS fires and iNaturalist is stored in Tiger Data (TimescaleDB).
The hazard model is built on LightGBM, trained on archived HRRR forecasts, predicting the chance that a severe-weather event is logged near the site that day. Trained on 2022-2023, calibrated on 2024, and tested on 2025 data. Live conditions (lightning, NWS warnings, crew reports) are safety rules that can only raise the rating: an active stop-work puts a site at 9.0 or higher.
Arrival forecast: storm cells from the last 20 minutes of flashes are tracked and projected toward each site. Advisories live in their own table, so they can't touch a stop-work.
Grounded briefings: Claude writes each briefing from a JSON file of facts. Code checks every number and hazard word against it and keeps the text under 150 words; then Claude Haiku rereads it. A rejected draft gets one retry, then Gemini, then a template. The go / no-go call is made in code, never by a model.
The beacon checks our API every 3 seconds. When a stop-work starts, it goes red. It only goes green once our server says it is clear, and if it can't confirm, it shows NO DATA instead.
Challenges we ran into
Originally, we built our program to work off of when we processed the data. We quickly found the major flaws in that: improperly timed holds, and late processing not properly extending them. We had to change to the strike time instead.
When detecting wildfires, power plants look exactly like them. False detections were high as a result of their heat generation and smoke-like products. We disabled detections within 1 km of our sites and of Florida's thermal plants. If there are any fires in that range, workers will be able to report them using the app, ensuring all fires are taken into account.
The night before judging, we found that if the satellite feed stalled, a stop-work's 30-minute countdown would still run out and send an all-clear, even though no new data had arrived to confirm it. We changed it so a stop-work is held until the feed is back and any late strikes are checked, and only then can it clear.
Accomplishments that we're proud of
On 2025 data, which the model never saw in training, our model beat the climatology baseline (the historical average for that site and time of year) by about 4x on PR-AUC (0.128 vs 0.032). Its ROC-AUC was 0.84 vs 0.62: given a hazardous day and a calm one, it ranks the hazardous day as riskier 84% of the time.
Using the August 4th, 2025 storm as our baseline, we found that we were able to:
Warn 8 of 13 stop-works before they started, a median of 10.8 minutes ahead (one storm, which we also tuned on).
Save stop-work alerts a median of 35 seconds after the strike, nearly all of which comes from the GOES-19 satellite's own delivery time.
What we learned
When it happens vs when we got it are very different, and we know now that mixing them up can be a serious safety issue.
Last knowns are always better than any confident guess. We made sure to only rely on and show data that we actually know.
For our hardware lead William, he got his first experience getting an Arduino Uno, a breadboard, and a Raspberry Pi 4 working together. Where normally our issues come from the code, William found that this time, the wiring and power were the most difficult part. William got experienced with testing one part at a time, finding the problem and troubleshooting it.
For our frontend lead Abid, he went through a lot of redesigns before deciding that our current one is the one. Although we originally came in with a basic UI for a prototype, it ended up sticking a lot more than we wanted it to. He knows now that we should have a much clearer design in mind for our frontend in the beginning, since it definitely gets harder to redesign as you get used to the temporary design.
For our backend lead John, he learned best safety precautions for representing unknown data, i.e. showing unknown instead of all clear. We got valuable experience training models, and whilst doing so, we also realized that some measures are better than others for judging a model. For this model, it's best to compare against baselines instead of just accuracy. He learned how to develop an end-to-end production system with a cloud server, time-series database, and live satellite data. He learned how to coordinate several coding agents whilst also performing code review, ensuring no work turned the whole project into mush with one broken push.
What's next for Fieldcast
Train our model on more data, for more accurate predictions and hazard numbers. Safety margins for the strike data, given that the GOES-19 satellite can only be accurate to 8-14 km. Instead of a prototype beacon, we can implement it to work with any already existing speaker infrastructure that sites may have. Our notification system sends everything, so improvements could be for anti-spam, where if an excess of events occur in a small timeframe you don't get an overflow of notifications. Account systems, so that any supervisor from any device sees only the sites they need, every time.
Built With
- arduino
- caddy
- claude
- codex
- fastapi
- github
- lightgbm
- maplibre-gl
- next.js
- numpy
- pandas
- python
- raspberry-pi
- tailwind-css
- tigerdata
- timescaledb
- typescript
- vercel
- vultr


Log in or sign up for Devpost to join the conversation.