Inspiration
Watching Toyota GR Cup races, we noticed drivers struggled to understand where they were losing time compared to competitors. Raw telemetry data existed but wasn't accessible or actionable. We wanted to democratize professional racing analytics—making it easy for any driver or coach to extract insights that usually require expensive specialized software.
What it does
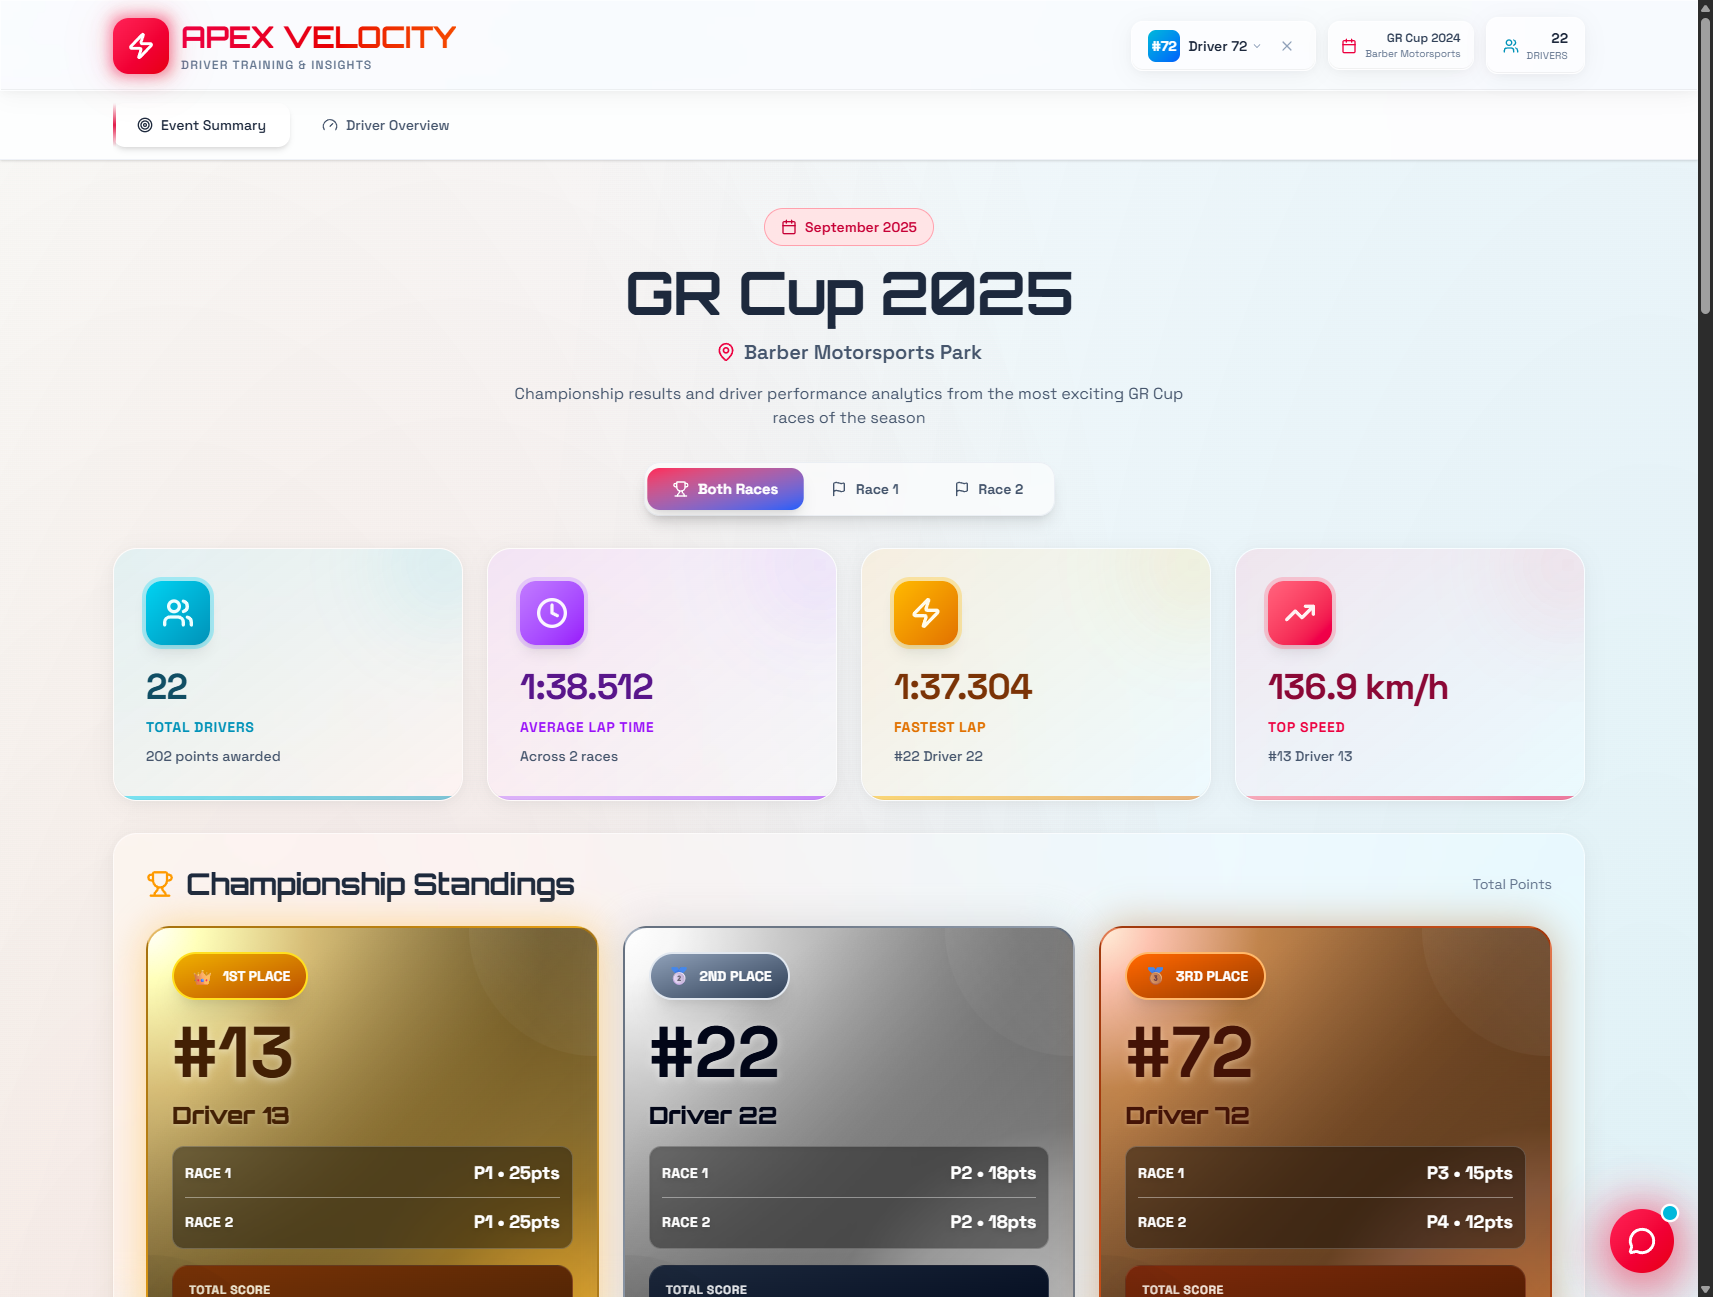
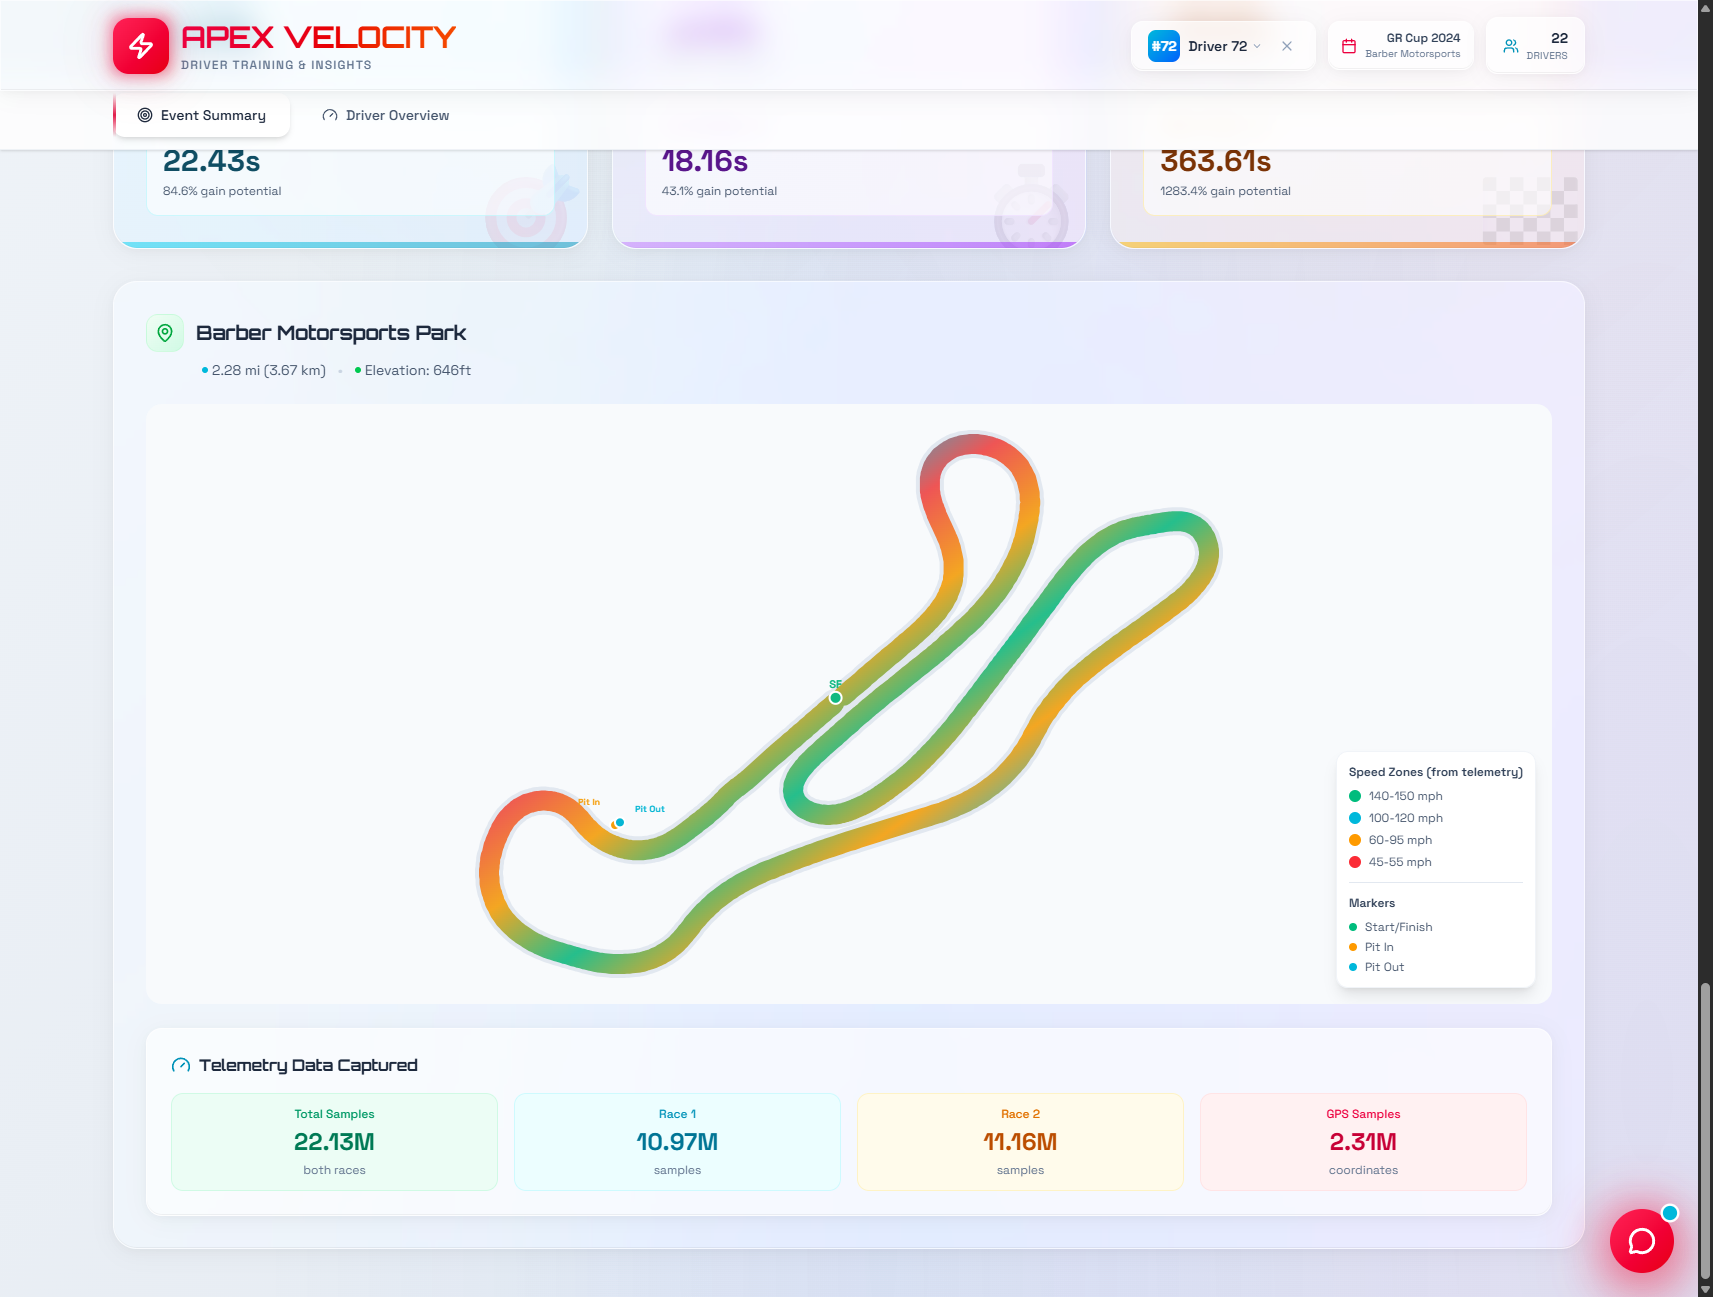
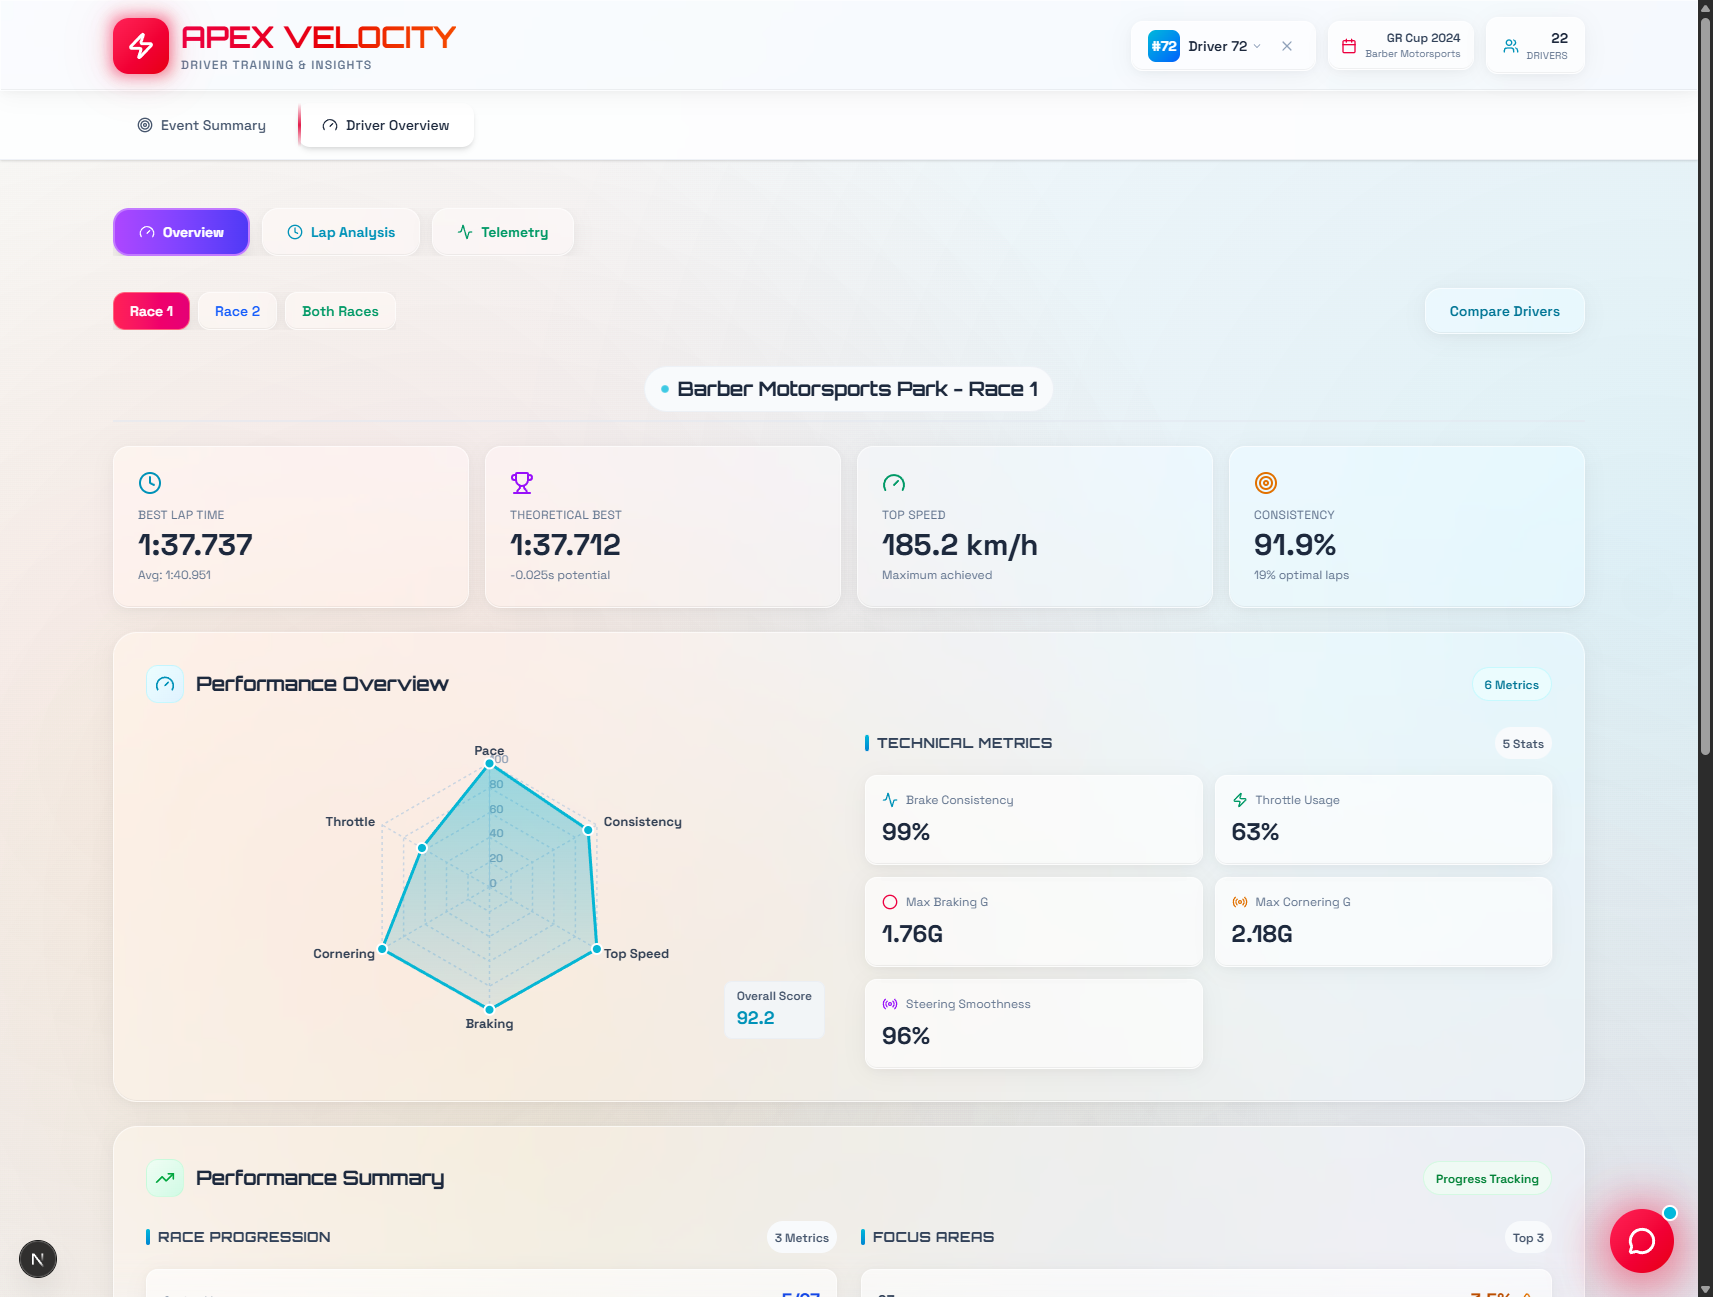
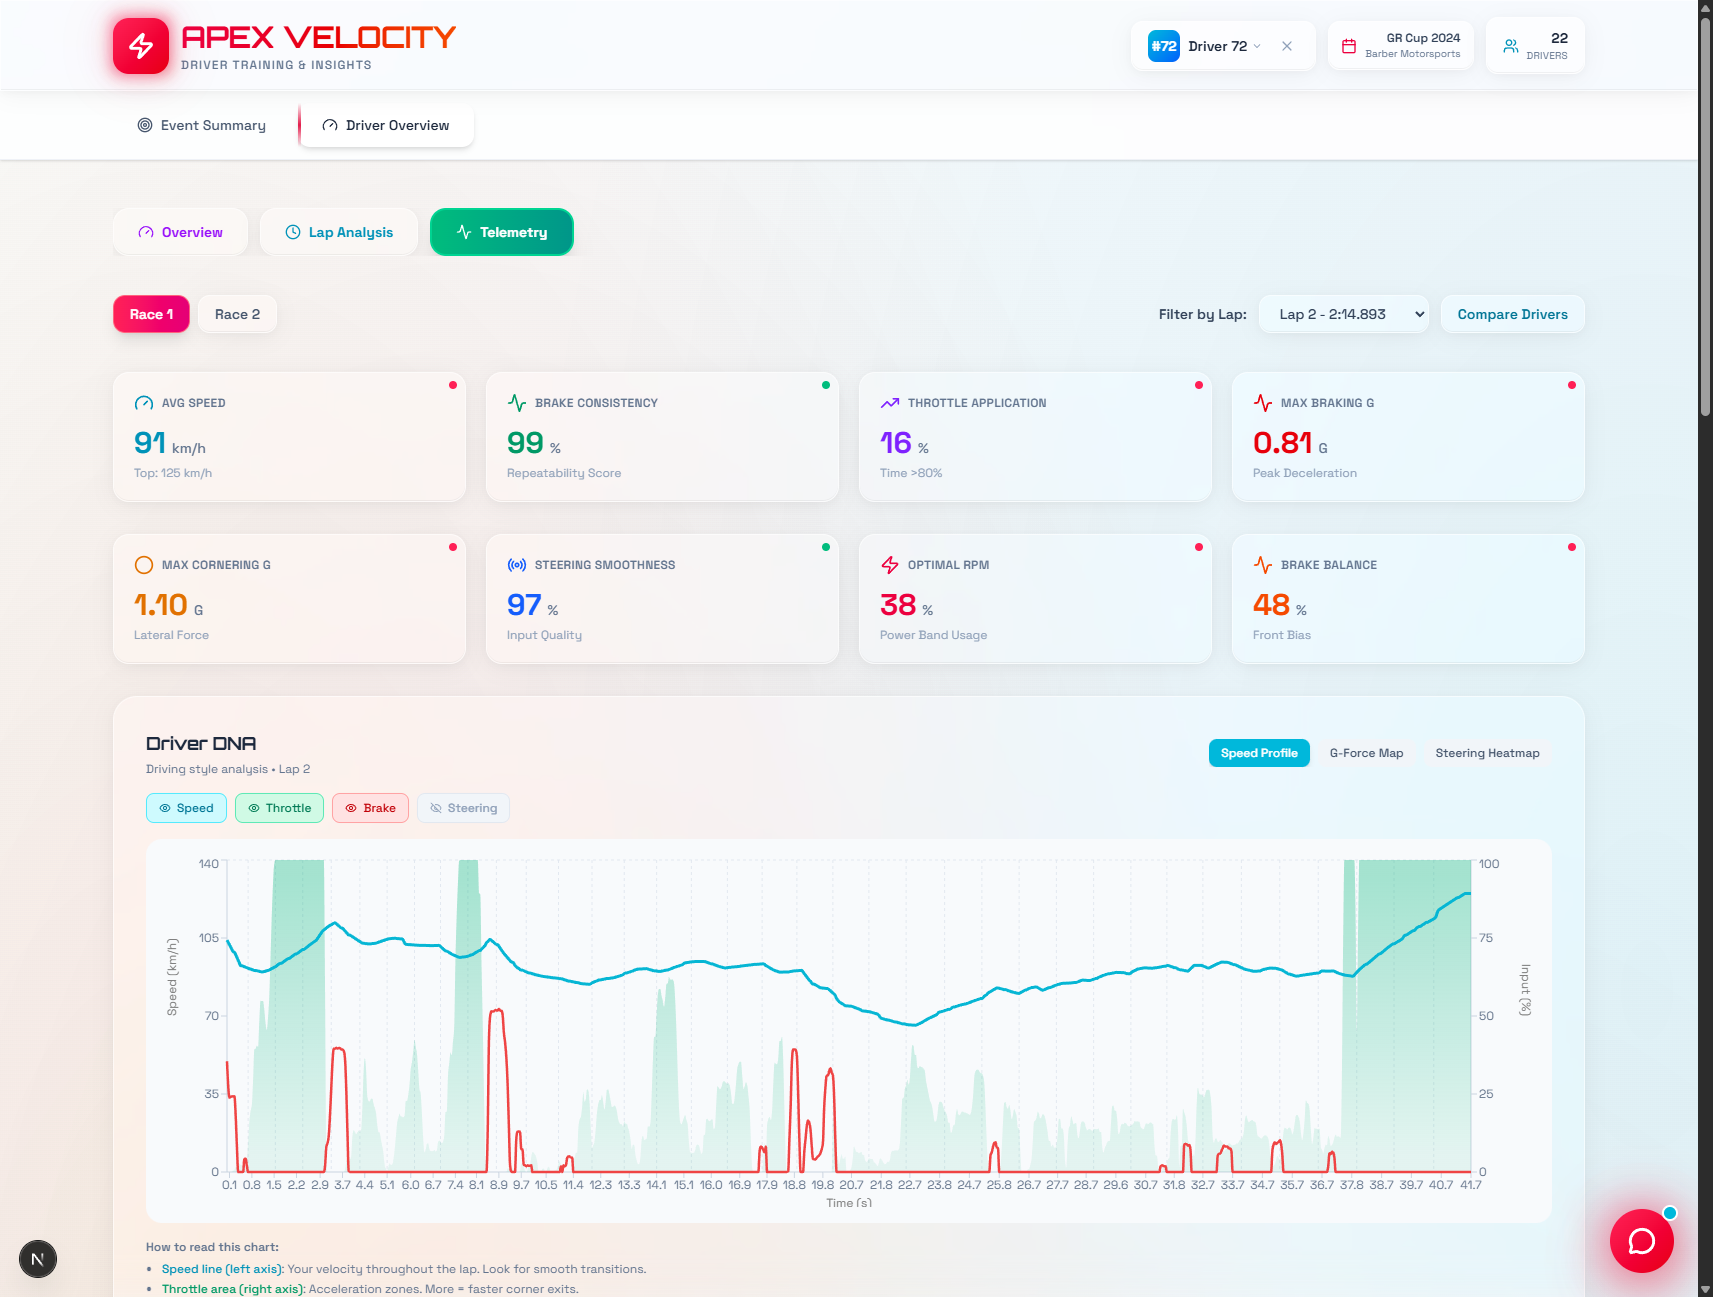
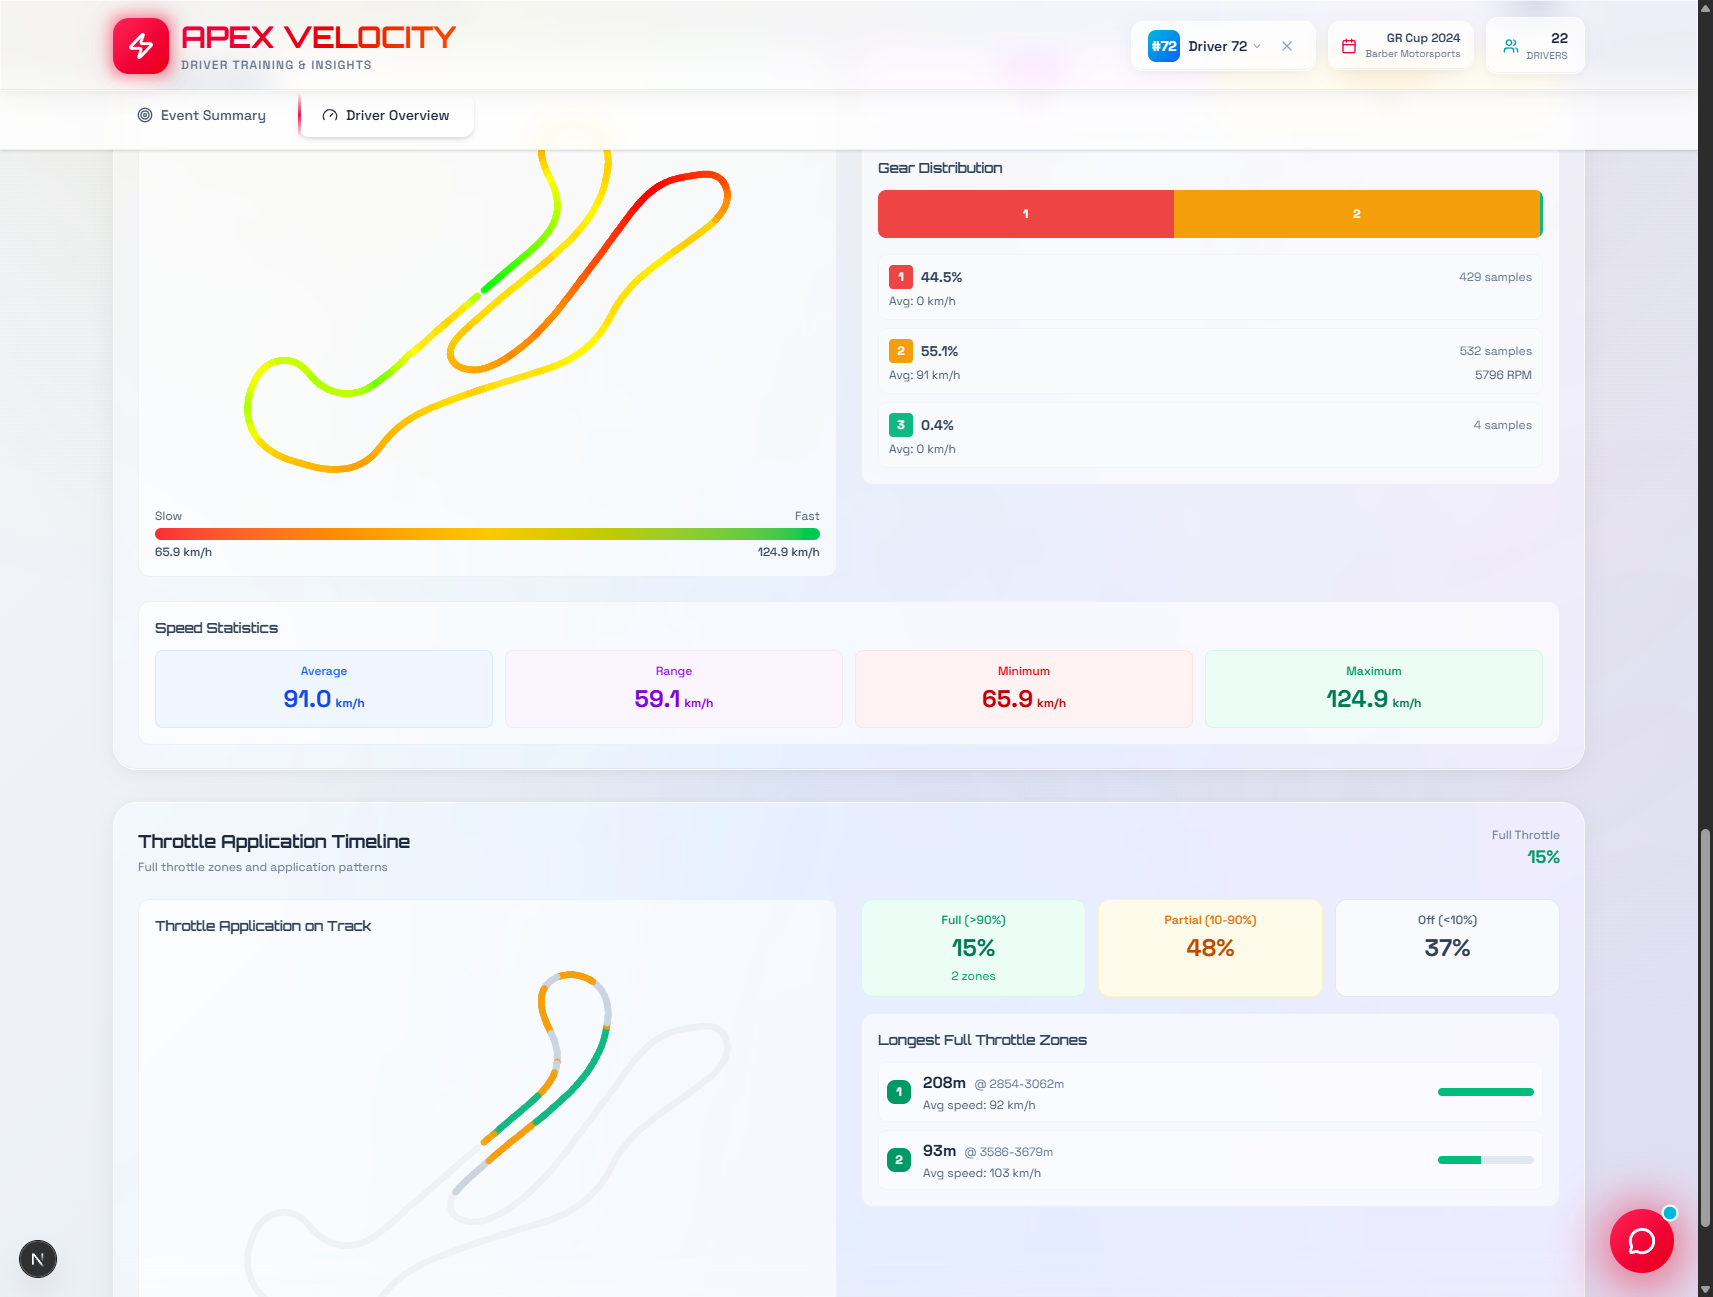
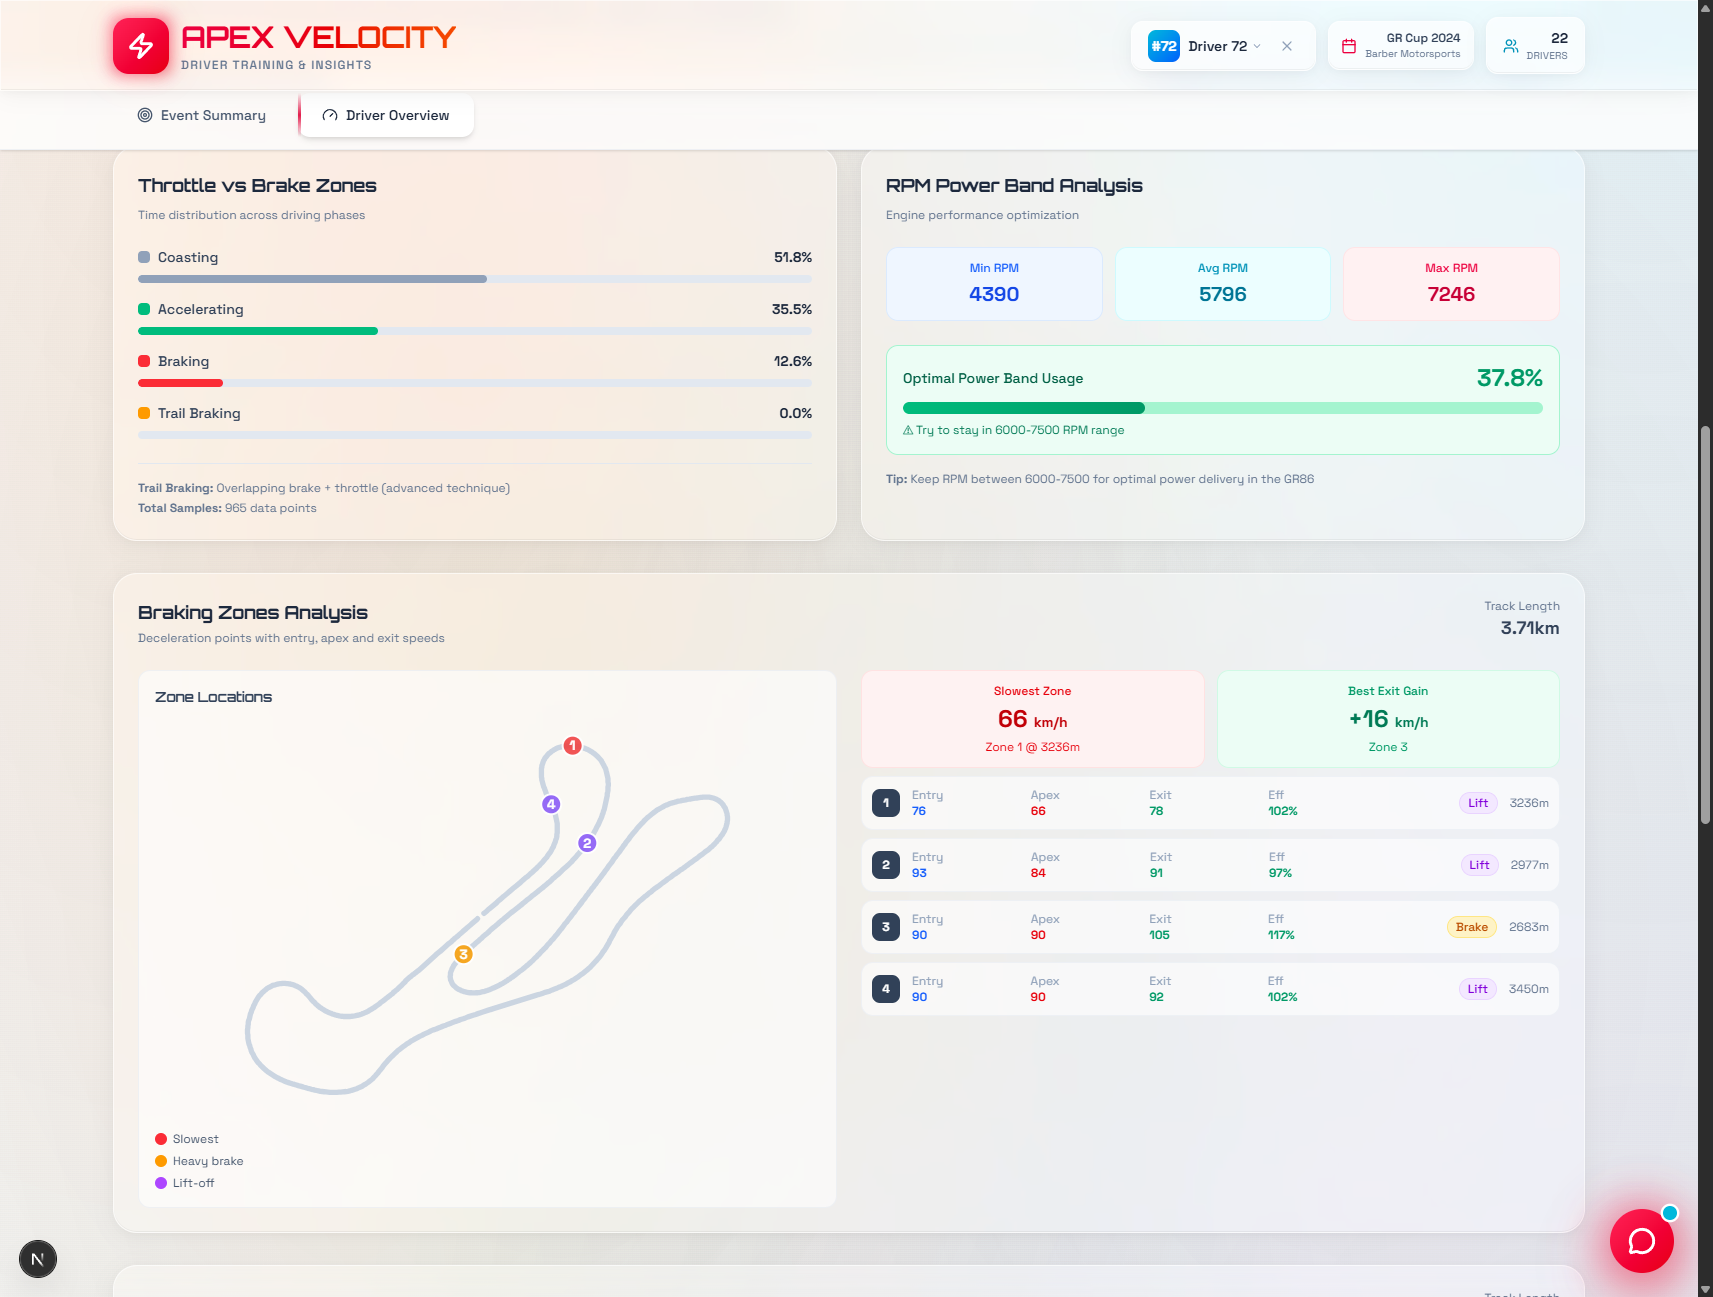
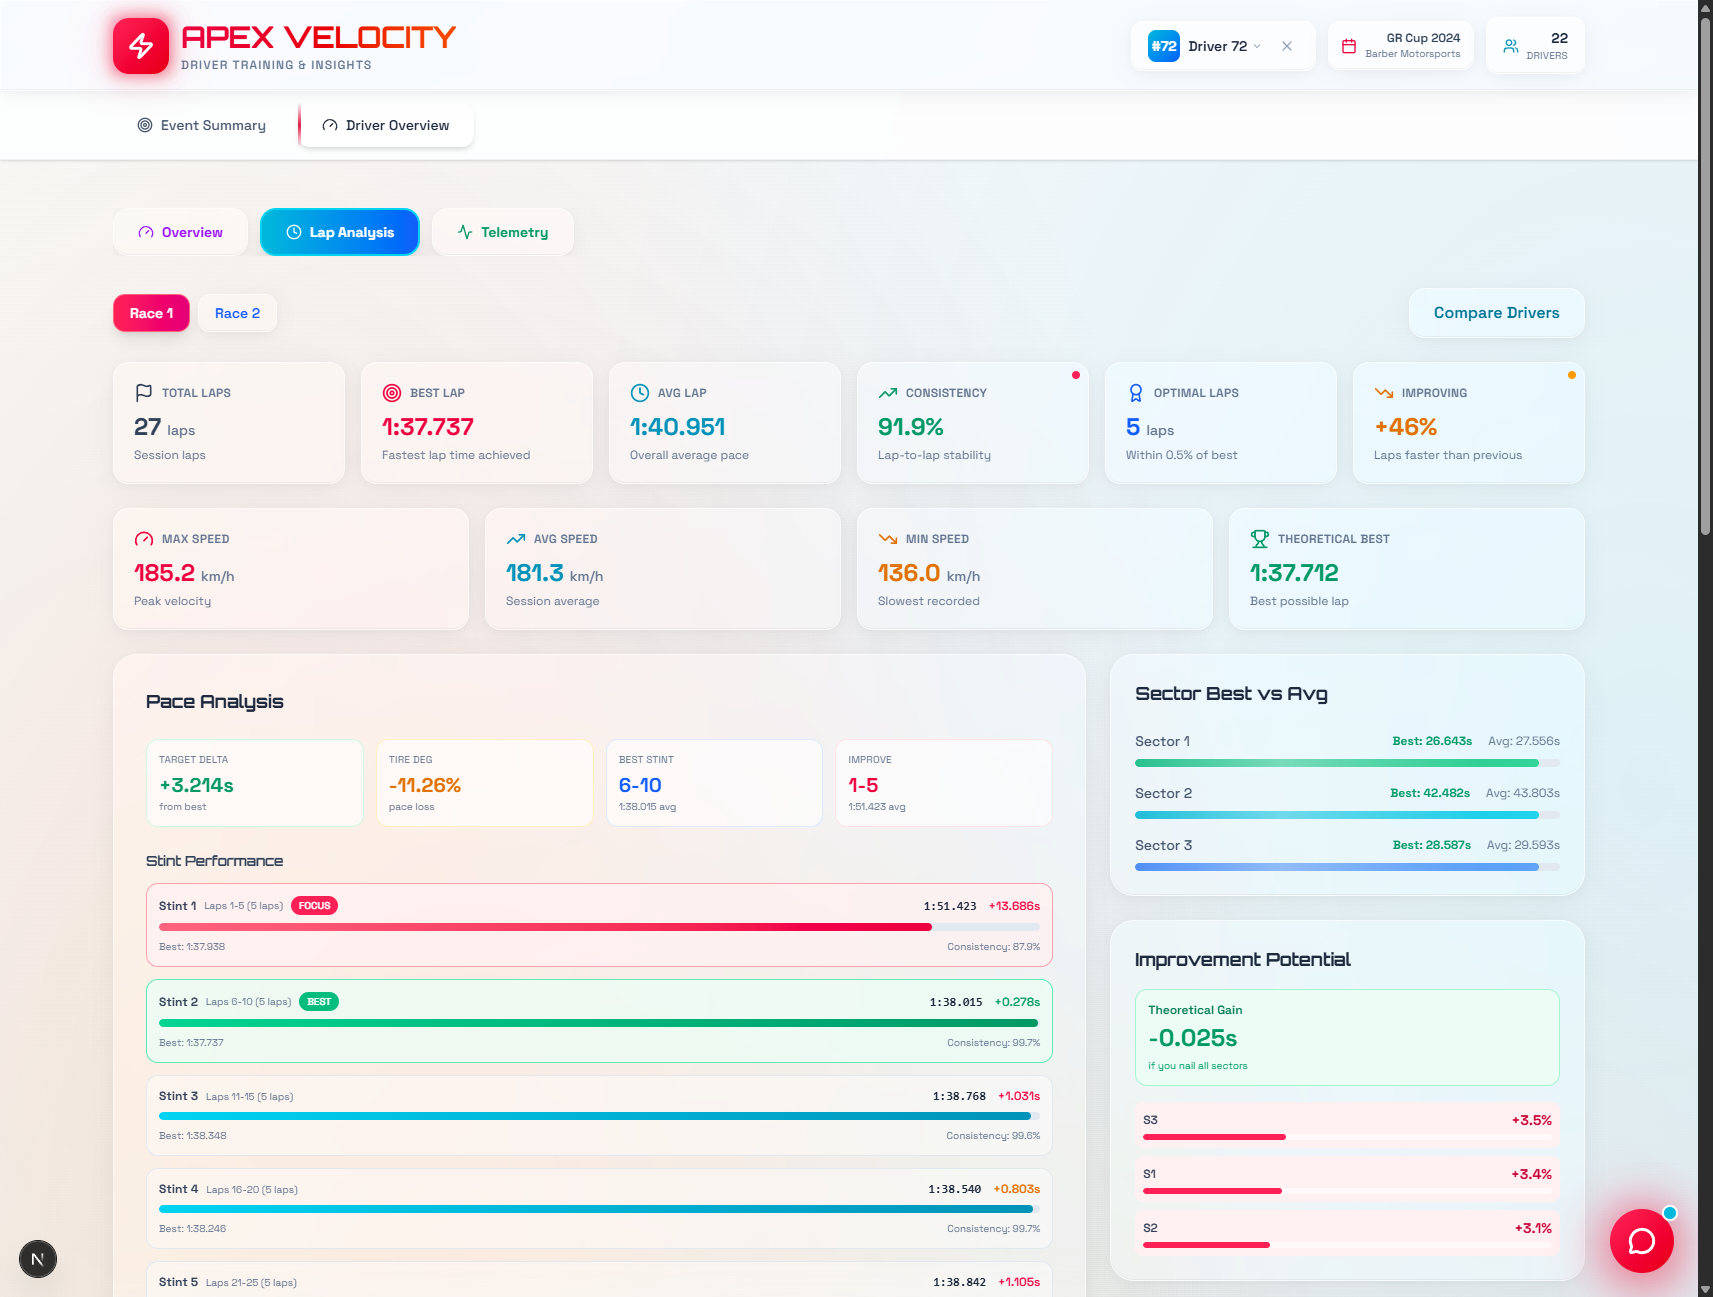
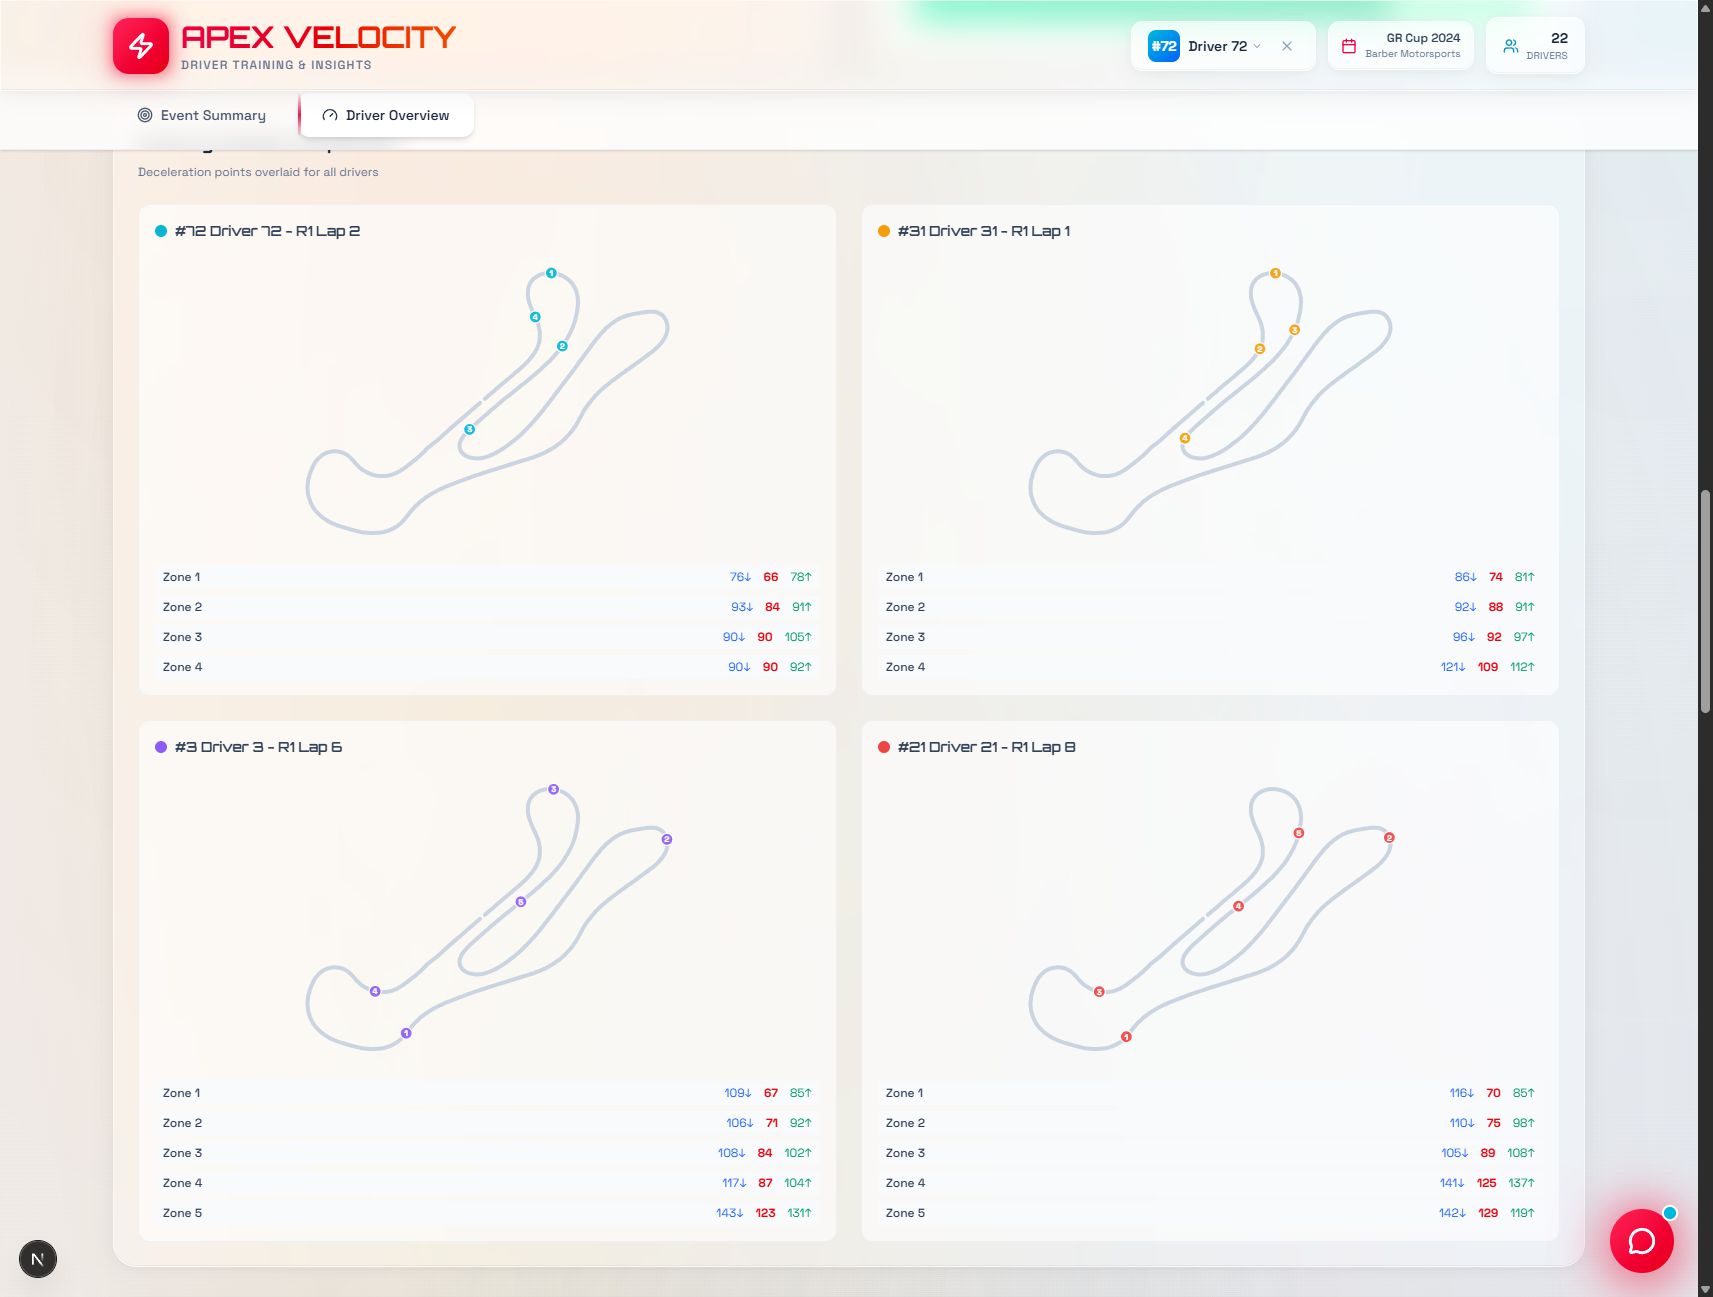
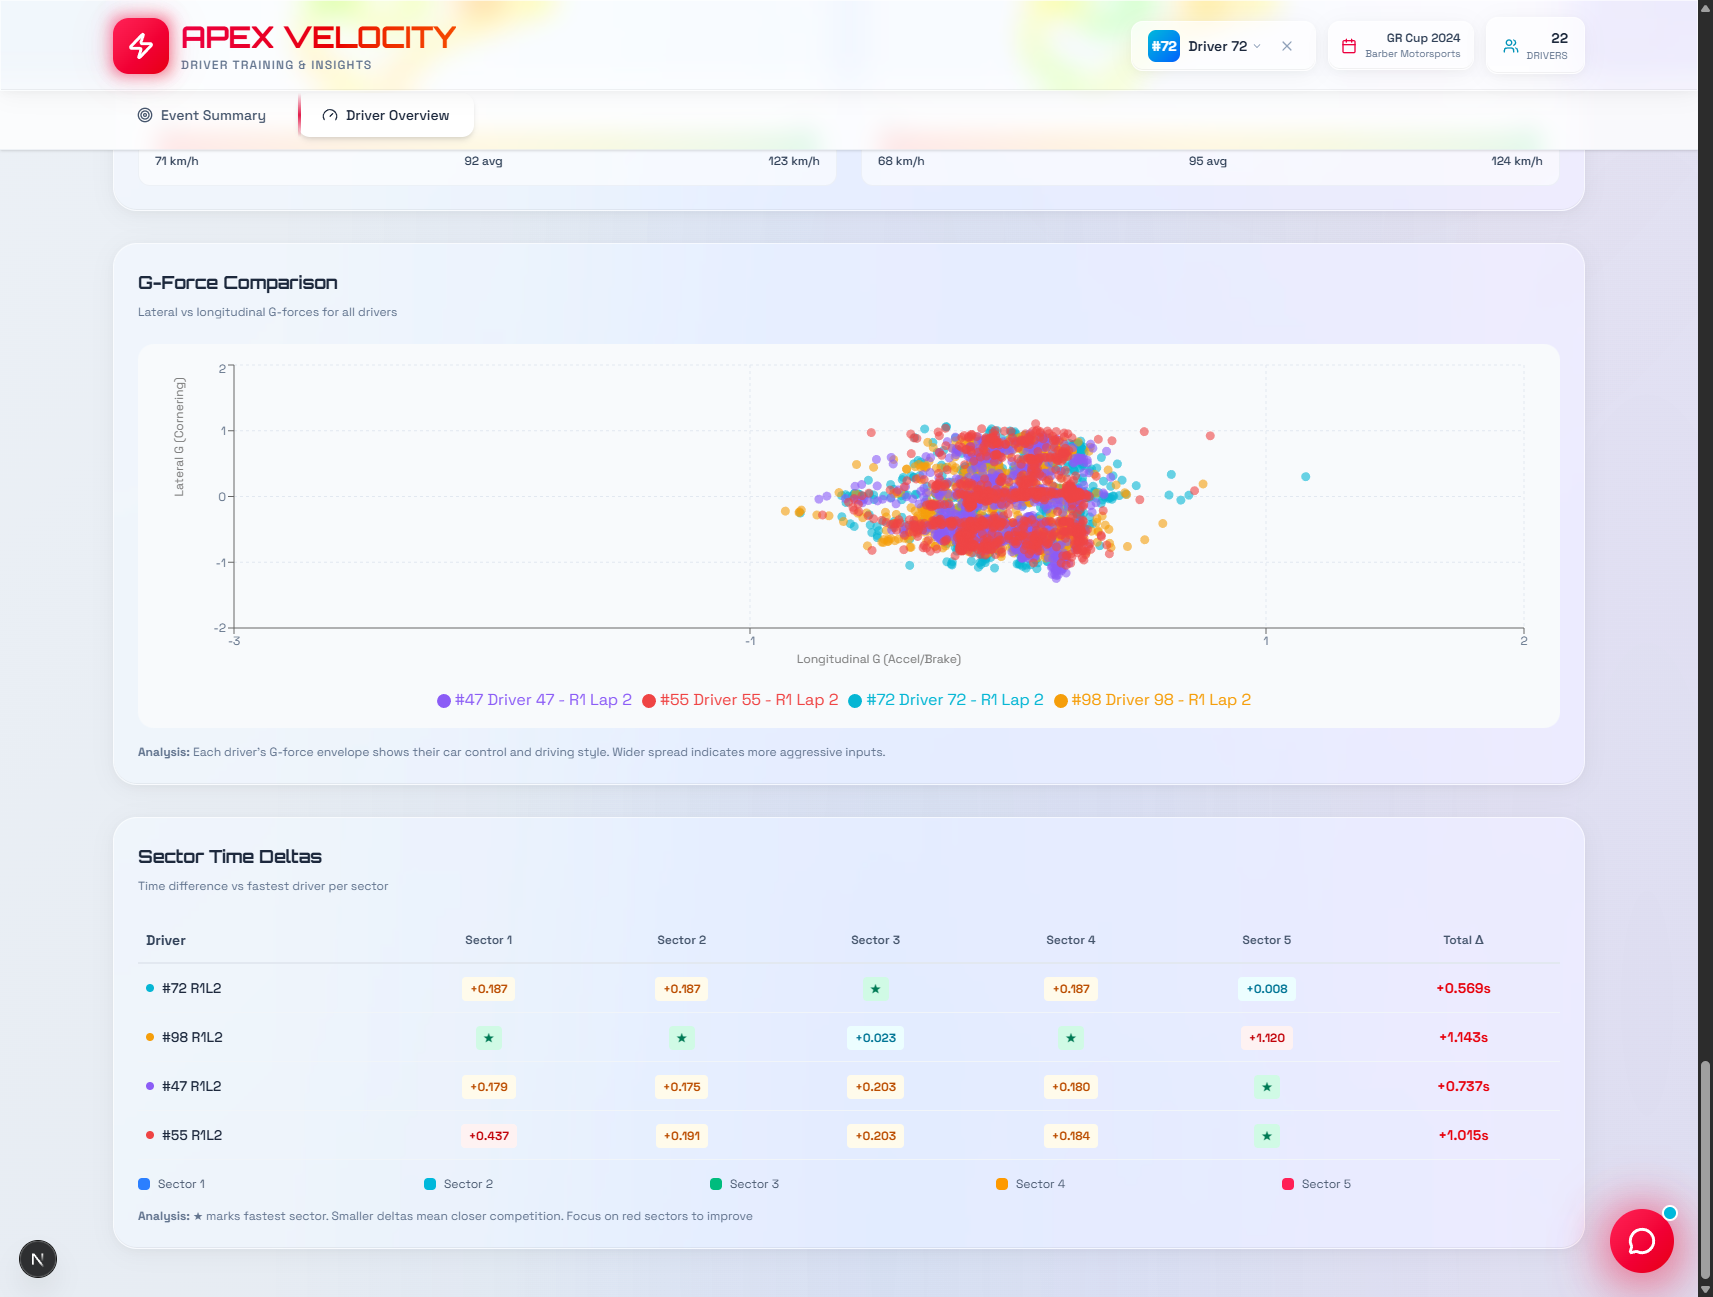
Apex Velocity analyzes Toyota GR Cup racing data and presents it through three core views. The Driver Overview shows performance metrics and an interactive GPS racing line visualization. Lap Analysis breaks down every lap with timing comparisons between drivers. The Telemetry View reveals detailed data like G-forces, speed, braking points, and throttle application—all with side-by-side driver comparisons to identify exactly where faster drivers gain their advantage.
How we built it
We built Apex Velocity with Next.js 15 for a fast, responsive web app, PostgreSQL with Prisma for storing race data, and Tailwind CSS v4 for a clean, modern interface. We processed the Barber Motorsports Park CSV data into a structured database, generated accurate GPS track paths, and created interactive visualizations that make complex telemetry data intuitive. The app runs entirely in the browser—no installation needed.
Challenges we ran into
Processing and normalizing the raw CSV telemetry data was complex. GPS coordinates needed precise mapping to create accurate track visualizations. We had to balance showing detailed technical data without overwhelming users. Performance optimization was critical—rendering thousands of telemetry points smoothly required careful component architecture and data management strategies.
Accomplishments that we're proud of
We created a professional-grade analytics platform that feels simple to use. The interactive track visualization accurately shows racing lines from real GPS data. The driver comparison feature makes it instantly clear where performance differences occur. We achieved smooth performance even with large datasets, and the responsive design works beautifully on any device.
What we learned
Racing telemetry is incredibly nuanced—small differences in braking points or racing lines create significant lap time variations. We learned advanced data visualization techniques, GPS coordinate mapping, and how to present complex information clearly. Working with real racing data taught us to think like engineers and coaches, understanding what insights actually matter for improving performance.
What's next for Apex Velocity
We want to add real-time data streaming for live race analysis, AI-powered coaching suggestions that identify improvement areas automatically, sector-by-sector performance breakdowns for more granular analysis, and video integration to sync telemetry with onboard footage. We also plan to expand beyond Barber Motorsports Park to support multiple tracks and racing series.
Built With
- next.js
- postgresql
- prisma


Log in or sign up for Devpost to join the conversation.