-
-
data
-
livedatanalytics
-
dataanalytics
-
mapview
Inspiration
Kigali's roads change condition faster than any city survey can track, potholes form, traffic patterns shift, and by the time a complaint reaches the right office, the problem has often grown. At the same time, thousands of moto-taxis are already driving every road in the city, all day, every day. We asked: what if that motion was the sensor network?
What it does
MotoPulse simulates a fleet of moto-taxis, each carrying a low-cost sensor pack
(accelerometer, microphone, GPS). As motos "drive" their routes, the backend aggregates
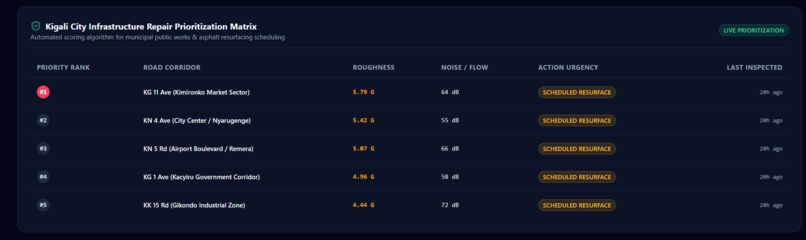
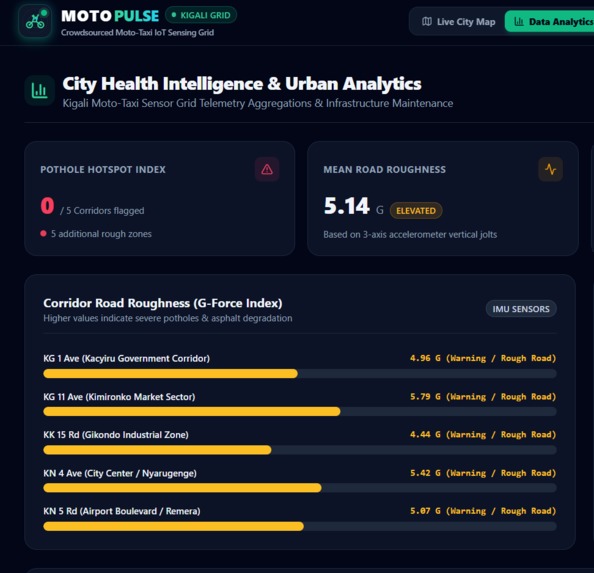
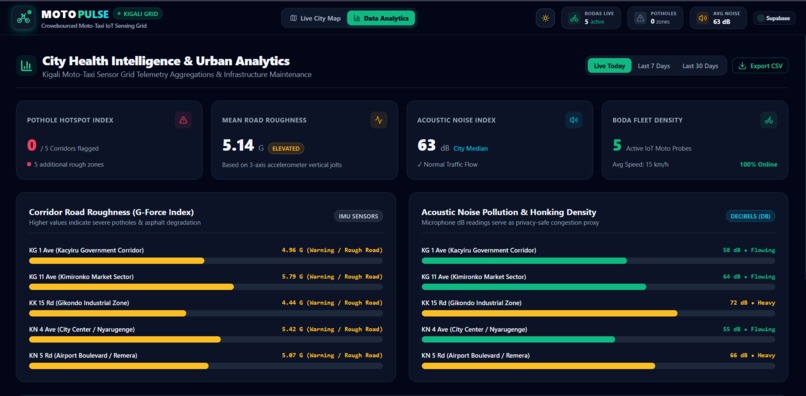
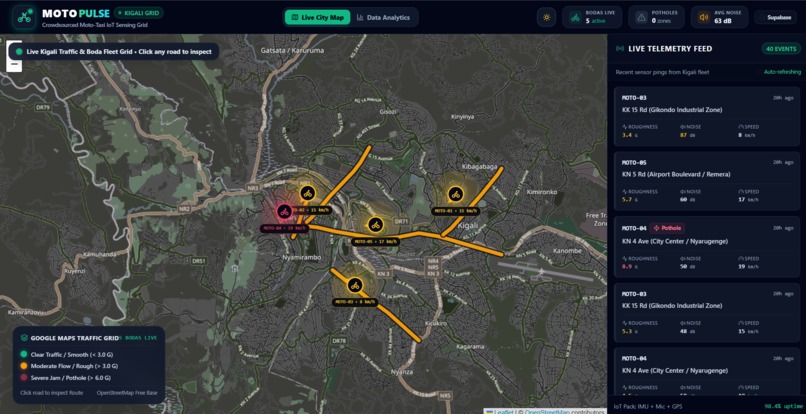
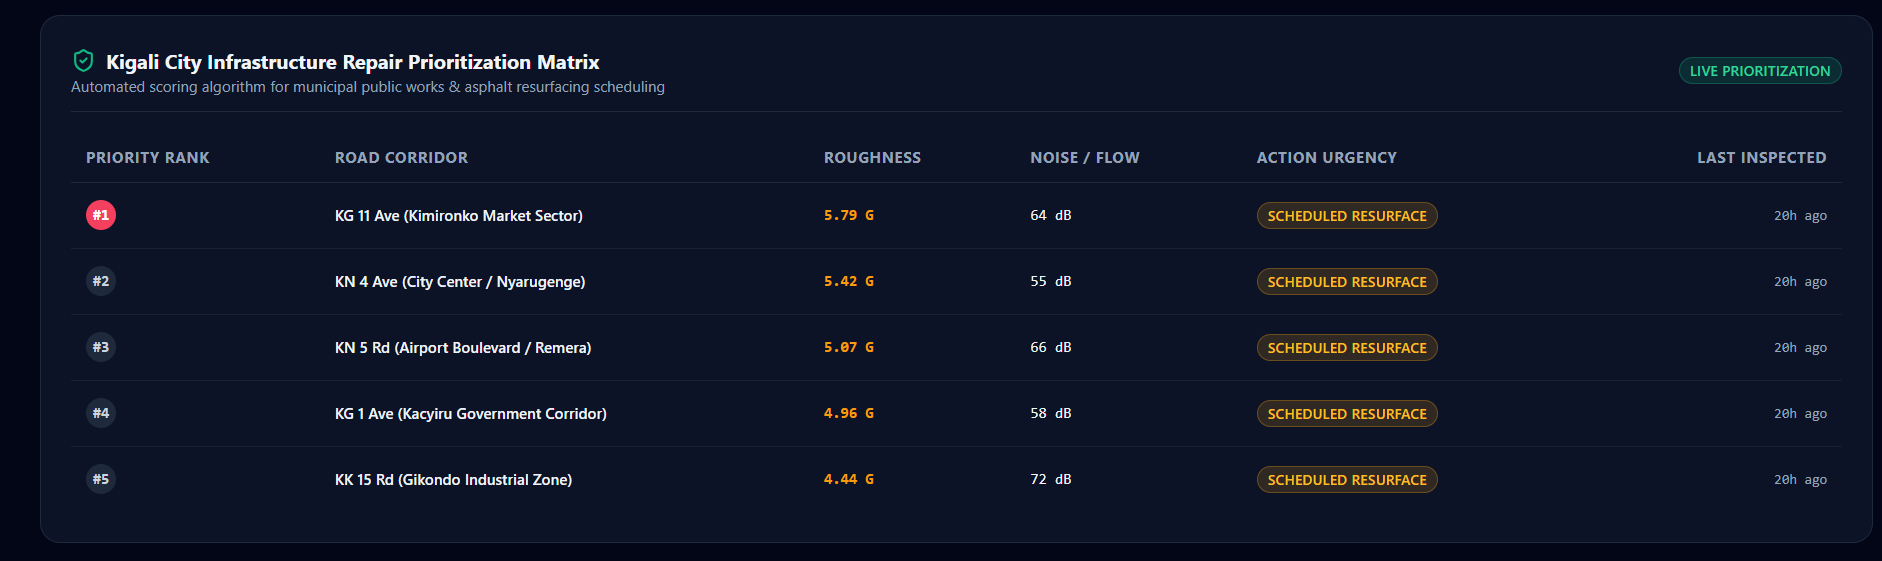
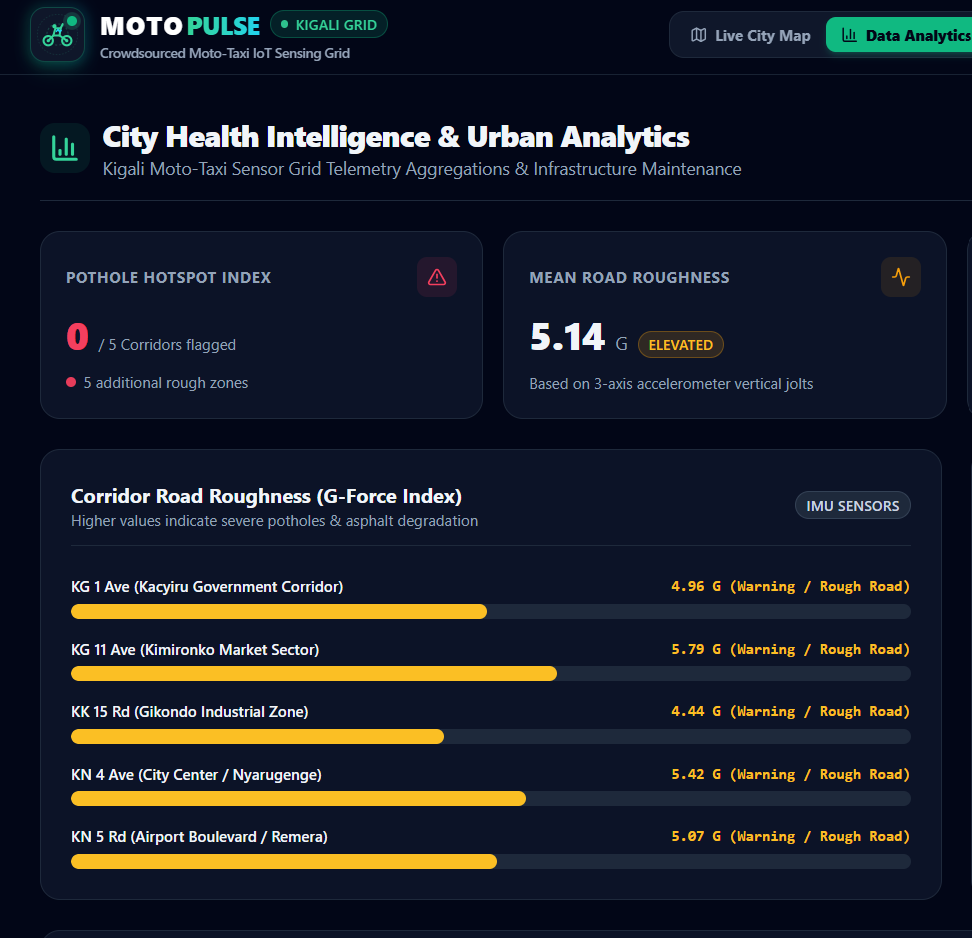
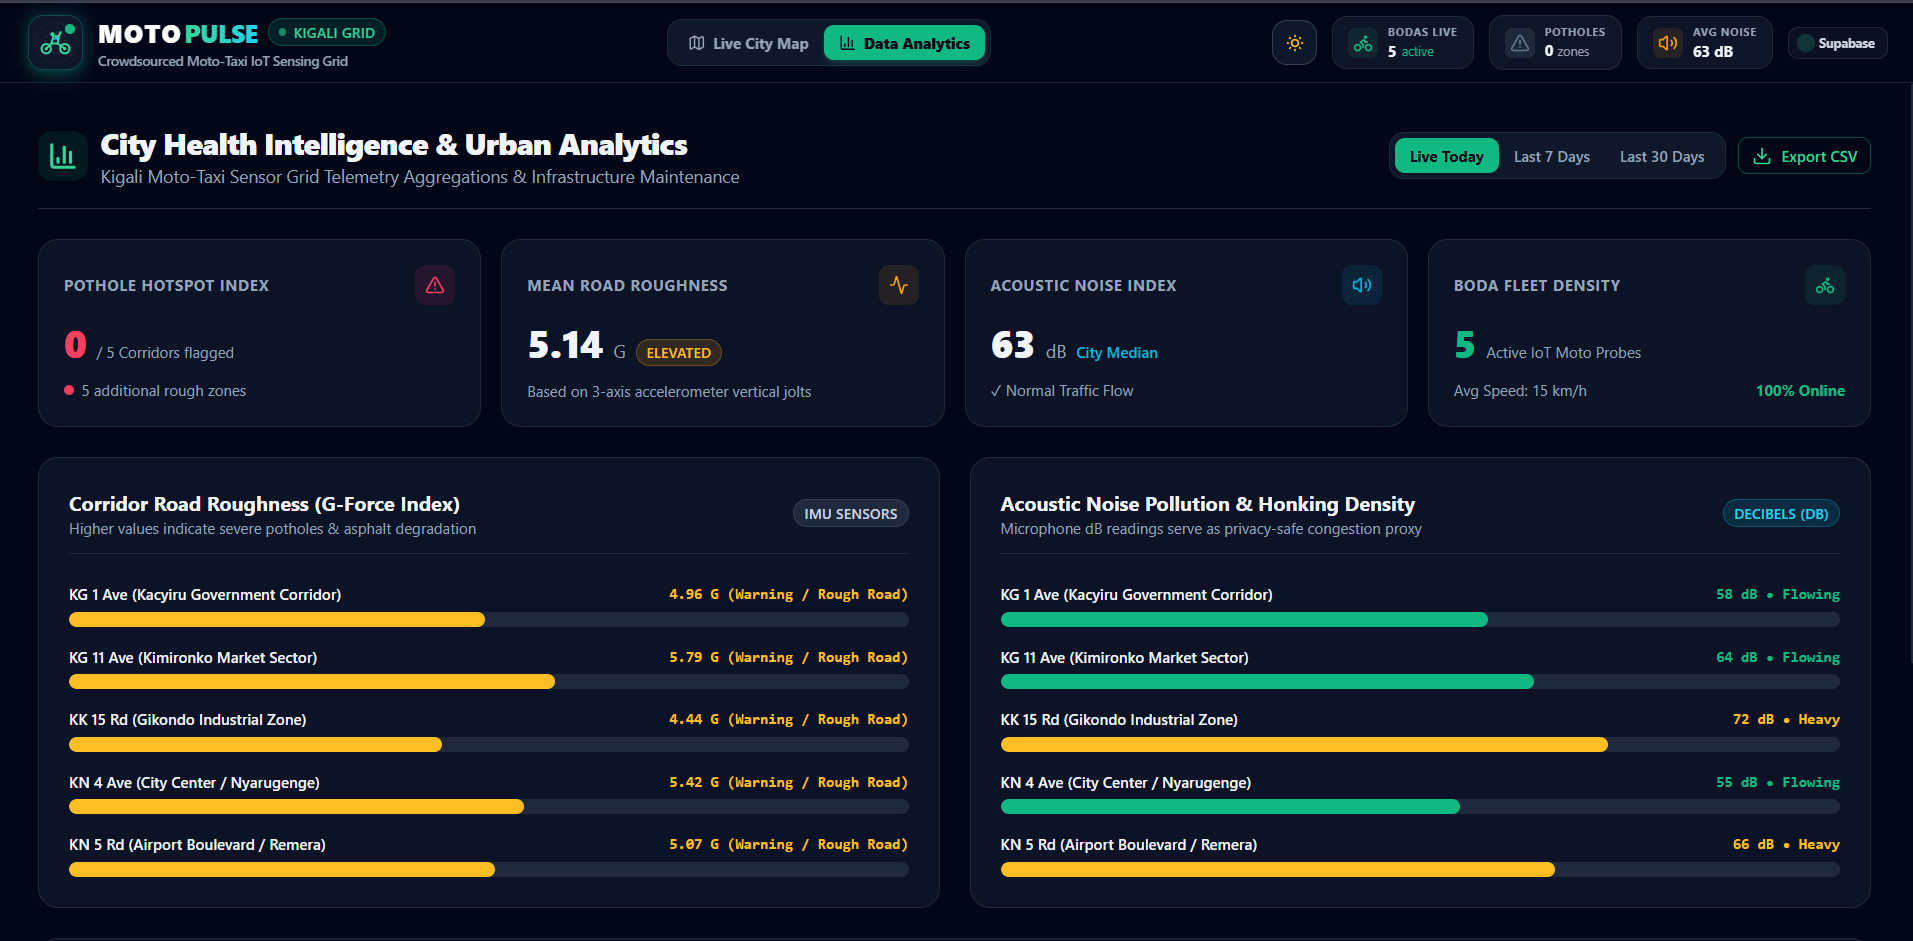
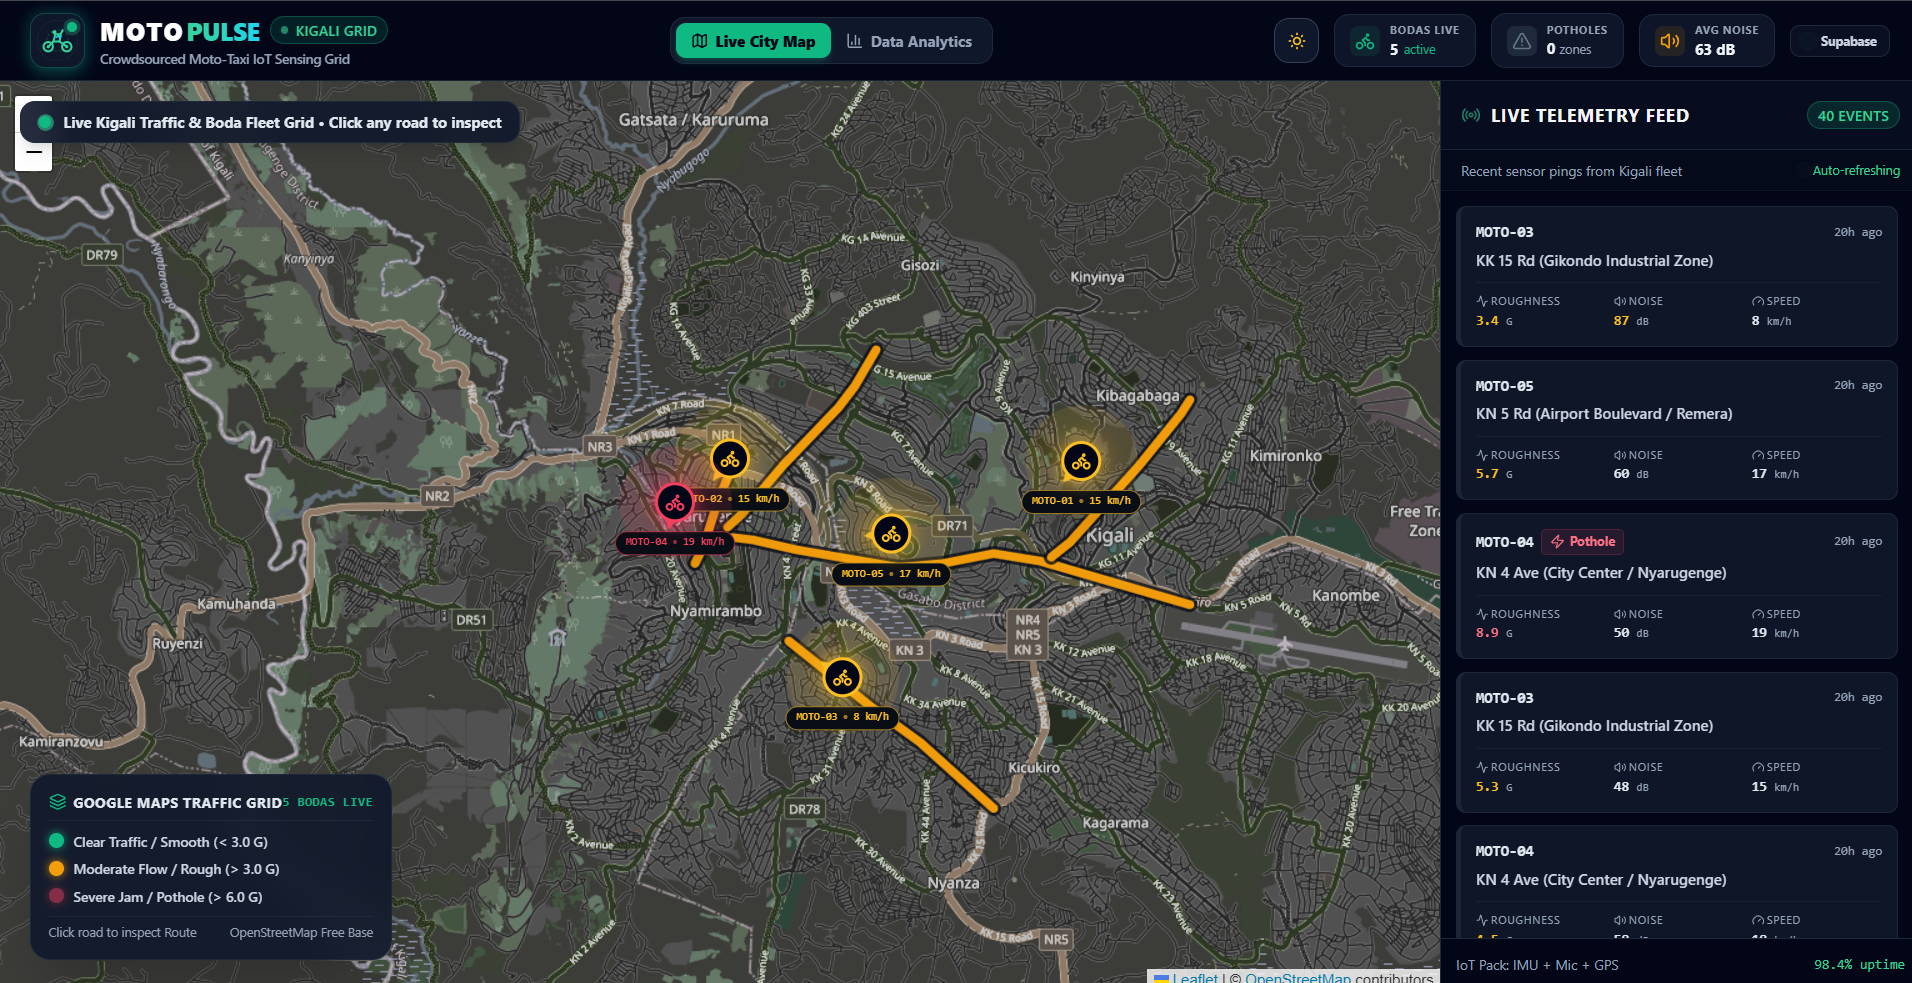
readings per road segment into two live scores, road roughness and noise/congestion, and flags each segment as clear, congested, or repair needed on a live map dashboard.
How we built it
- Backend (Python/Flask): a background thread simulates motos moving along fixed road-segment coordinates, generating sensor readings each tick. Readings are kept in a rolling window per segment and averaged, so a single spike doesn't falsely flag a road.
- REST API:
/api/segmentsand/api/motosserve live aggregated data. - Frontend (Leaflet.js): a dark, map-first dashboard polls the API every 2 seconds, color-coding road segments live and animating moto positions.
Challenges we faced
Getting the aggregation logic right was the core challenge, a naive "flag on any spike" approach produced constant false alarms, so we moved to rolling averages with thresholds tuned against simulated pothole events, which is much closer to how a real deployment would need to behave.
Accomplishments we're proud of
A genuinely working, live end-to-end prototype in a very short build window, not a slide-only concept, but a running simulator, API, and dashboard that update in real time.
What we learned
How much signal you can get from just three sensor types (motion, sound, GPS) if you aggregate carefully, and how important it is to design for privacy from the start rather than bolt it on later.
What's next
- Replace the simulator with real ESP32 sensor packs on a small pilot fleet
- Add anomaly detection (z-score) so each road's baseline adapts individually
- Historical trend view per segment for city planners
Built With
- css3
- data-aggregation
- flask
- html5
- iot
- javascript
- leaflet.js
- python
- rest-api


Log in or sign up for Devpost to join the conversation.