-
-
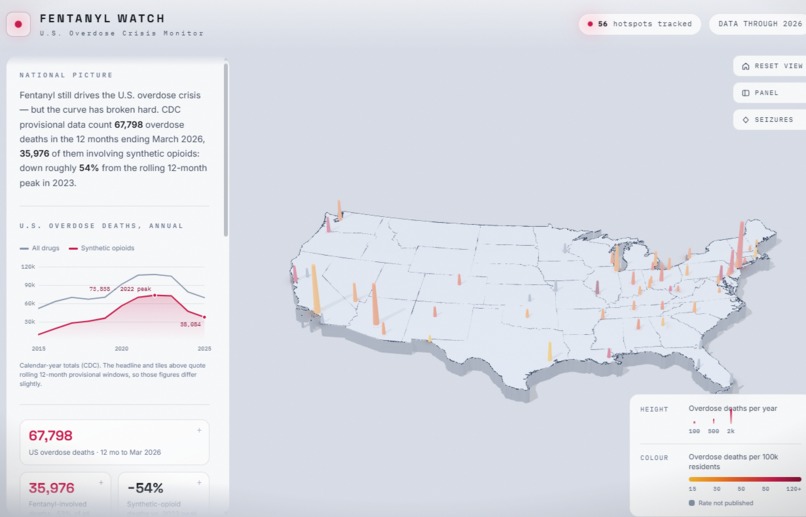
dashboard
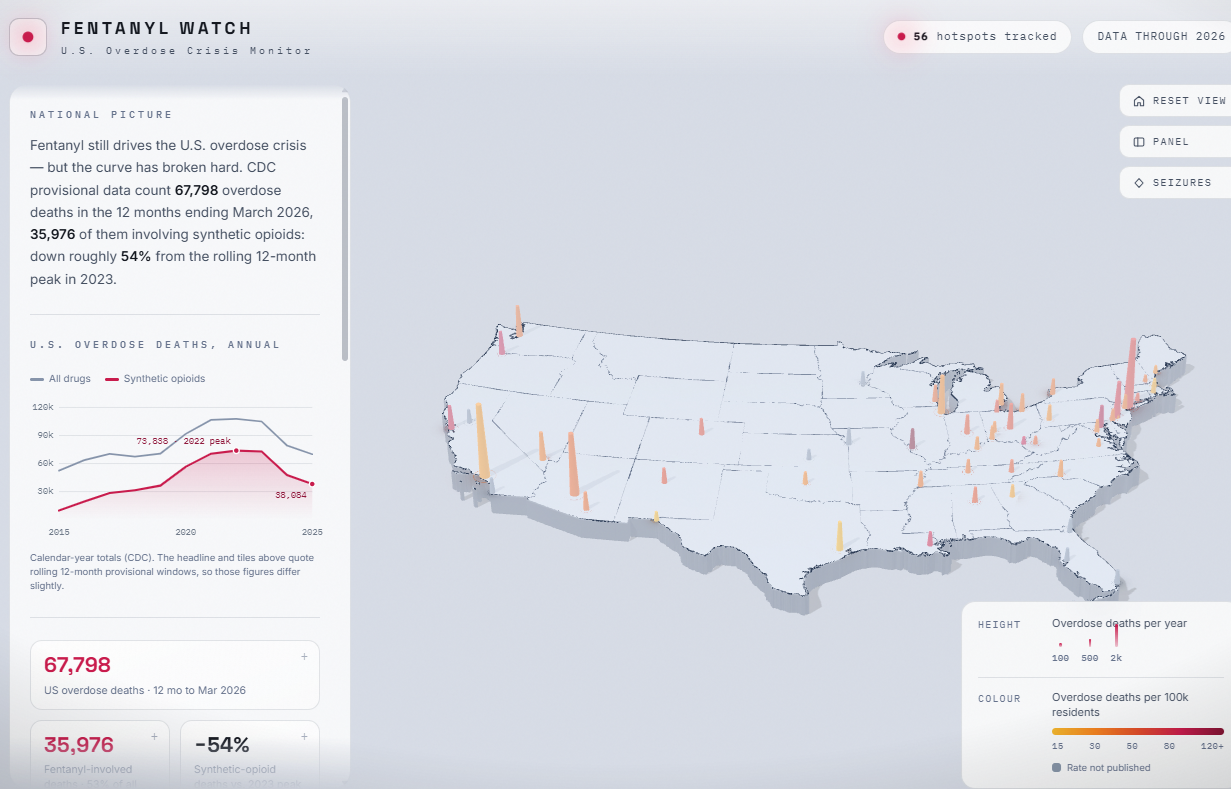
Inspiration
The fentanyl overdose crisis killed more Americans last year than car crashes, yet the public data behind it is scattered across CDC provisional files, DEA press releases, and hundreds of local news stories. We built Fentanyl Watch to pull that picture into one place — a 3D map of 56 metro hotspots, each with a sourced profile. Click on a city for the full disclosed information. But a visualization can only answer the questions its designer anticipated. WebMCP changes that: if the page exposes its data and its camera as tools, an AI agent can answer any question — and then show you the answer on the map. That felt like the right test of what human-agent collaboration on the web should look like.
What it does
Fentanyl Watch renders 56 overdose hotspots on an extruded, Albers-projected 3D map of the lower 48. Column height encodes annual overdose deaths; column color encodes deaths per 100,000 residents. A toggleable second layer plots 32 major fentanyl seizures from 2025–26 and the 7 southwest border corridors with their share of national seizures. Every hotspot carries a sourced profile: statistics with their exact geographic and year basis, trend, seizure activity, and dated news events with source URLs.
The page registers 10 WebMCP tools via document.modelContext.registerTool. Seven are read tools — list, fetch, and compare hotspot profiles, national summary and CDC timeline, seizures, border corridors, and a get_data_caveats tool that hands the agent the dataset's honest limitations before it quotes a number. Three are control tools that move what the human sees: focus_hotspot flies the 3D camera to a city and opens its profile drawer, set_seizure_layer toggles the seizure layer, and reset_view returns to the full-country frame. Ask an agent "which metro has the worst per-capita overdose rate?" and it doesn't just answer — it flies you there.
How we built it
The visualization is Three.js + Vite, with d3-geo and topojson-client projecting a Census TopoJSON into an extruded landmass — no framework, no runtime dependencies beyond those. The dataset was compiled from CDC WONDER and provisional VSRR data, DEA press releases and the National Drug Threat Assessment, state and county health departments, and news reporting, then normalized through a build pipeline into one JSON file.
The WebMCP layer is a single module that builds tool descriptors with JSON Schemas and async execute handlers, then registers them against document.modelContext (with a fallback to the older navigator.modelContext draft, and a graceful no-op that stages the tools on window.__webmcpTools for console testing in browsers without the API). Read tools carry readOnlyHint annotations. Control tools call the exact same functions the UI buttons call — we refactored the seizure toggle so the agent and the human drive one shared code path, and the button state can never drift from what the agent did.
Challenges we ran into
A moving spec. WebMCP documentation still shows several API shapes — navigator.modelContext vs. document.modelContext, provideContext vs. registerTool, string returns vs. MCP-style content arrays. We read the current W3C explainer and Chrome's implementation docs side by side and wrote a small adapter that registers correctly against whichever surface the browser exposes.
Overdose figures vary in geographic basis (city vs. county) and time basis (calendar year vs. rolling 12-month provisional windows), and provisional counts get revised. Rather than flattening this into a fake-uniform dataset, every profile labels its own basis, hotspots without a published rate say so instead of getting an invented number — and we exposed all of it to agents as a first-class get_data_caveats tool.
Agent-driving a WebGL scene. Most WebMCP demos manipulate DOM. Our control tools have to fly a camera through a Three.js scene, compute framing around HUD panels, and open drawers — so tool handlers had to hook into the animation system, not just flip state.
Accomplishments that we're proud of
A tool surface with real depth: 10 tools spanning data query, comparison, and visual control — not a single bolted-on demo tool.
The human-agent loop actually closes: the agent's answer and the human's screen stay in sync, because focus_hotspot shows you what the agent is talking about. A dataset that tells agents the truth about itself. get_data_caveats means an agent quoting our numbers can also quote their limitations. Every figure in all 56 profiles traces to a named source with a URL.
What we learned
Designing tools for agents is a different discipline from designing UI for humans. Descriptions are prompts: the difference between an agent using compare_hotspots well or ignoring it lives entirely in one sentence of description text. Read/write separation matters — readOnlyHint annotations let an agent explore freely while being deliberate about tools that move the user's view. And the most valuable tool wasn't a data query at all: it was giving the agent the dataset's caveats, because an agent that can explain a number's basis is more trustworthy than one that just recites it.
What's next for Fentanyl Watch
Live data refresh — automate the CDC VSRR and DEA ingestion pipeline so the map tracks each provisional release.
Richer agent tools — timeline queries per hotspot, region-level aggregation, and a find_sources tool that returns citations for any claim on screen.
Declarative WebMCP — annotate the search and filter UI with the declarative API as it stabilizes.
Beyond fentanyl — the architecture (sourced hotspot profiles + agent tool surface over a 3D map) generalizes to any geographic crisis dataset: xylazine spread, HIV outbreaks, disaster response.

Log in or sign up for Devpost to join the conversation.