-
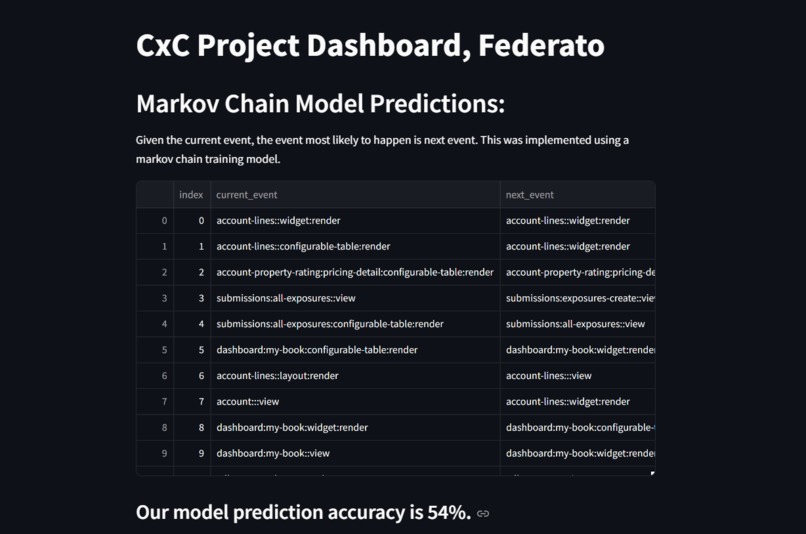
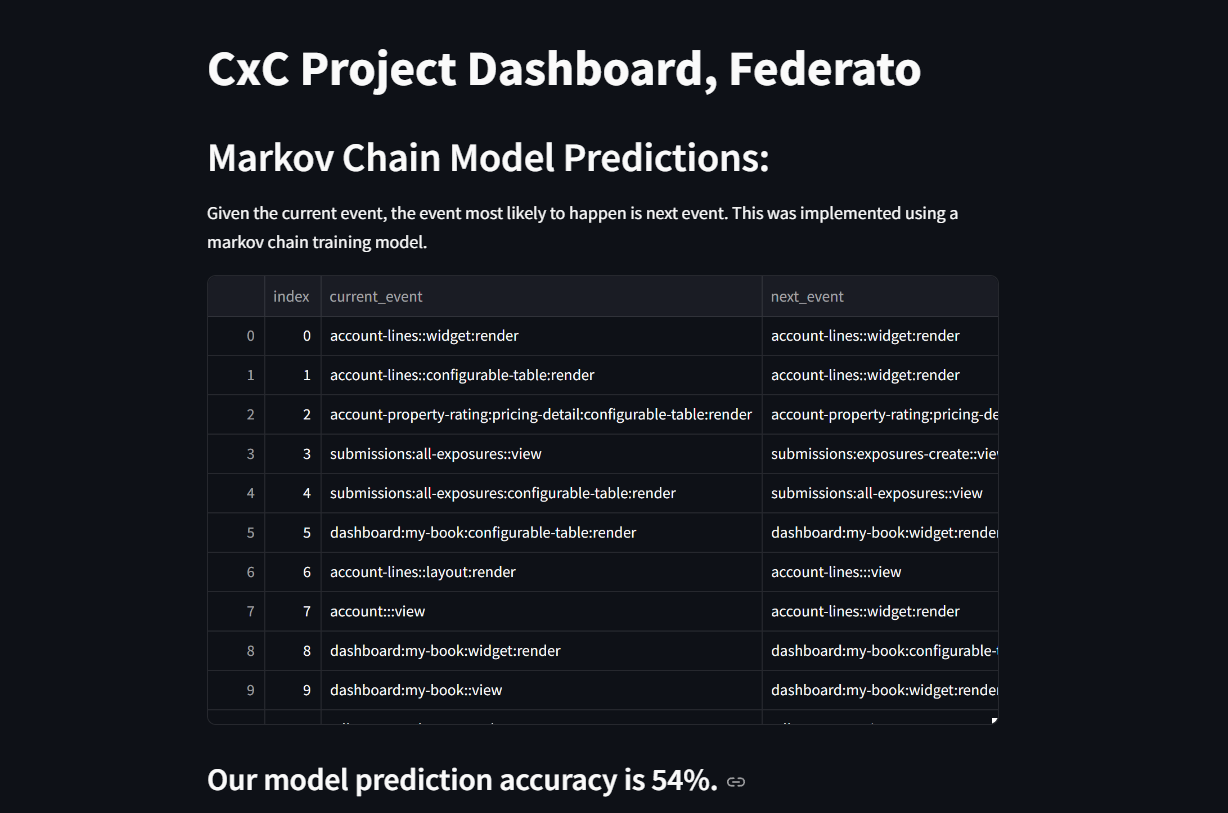
Our Markov Chain model predicts the next user action with 54% accuracy, helping identify common navigation paths.
-
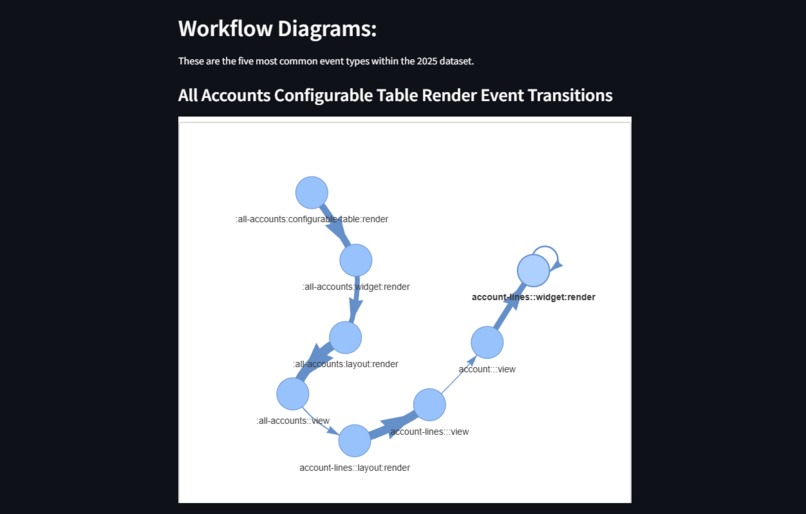
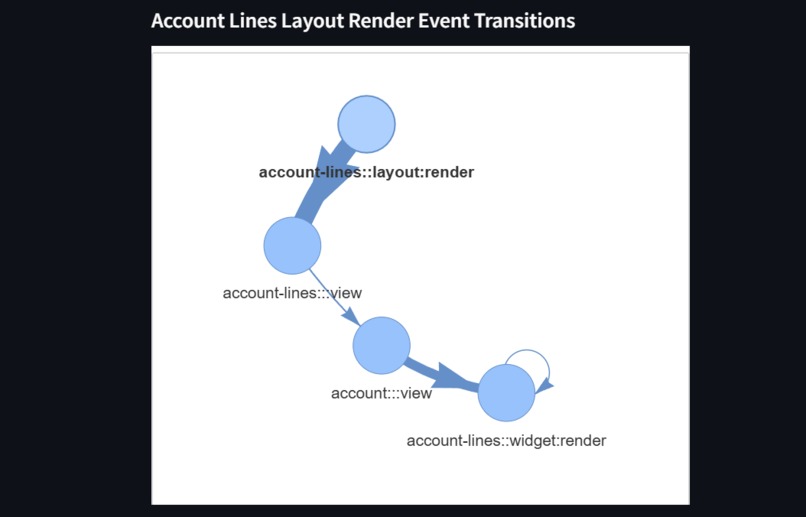
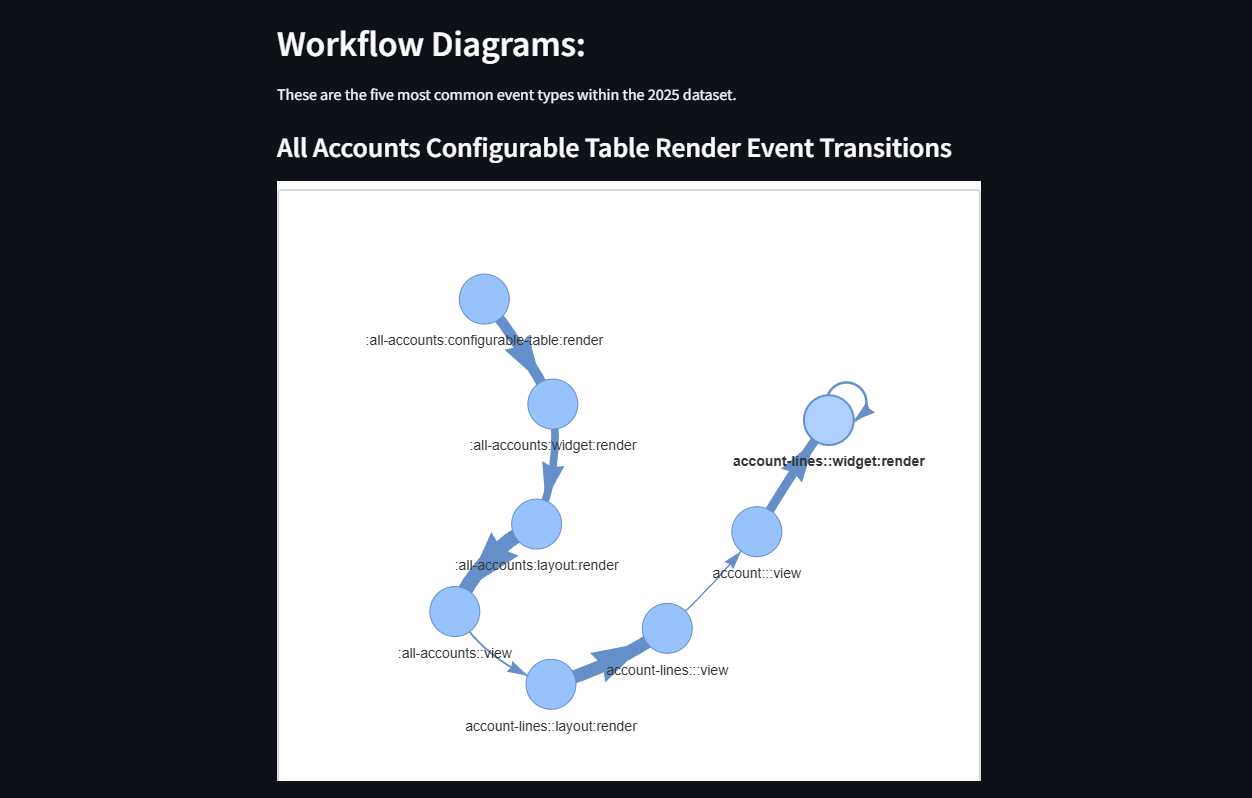
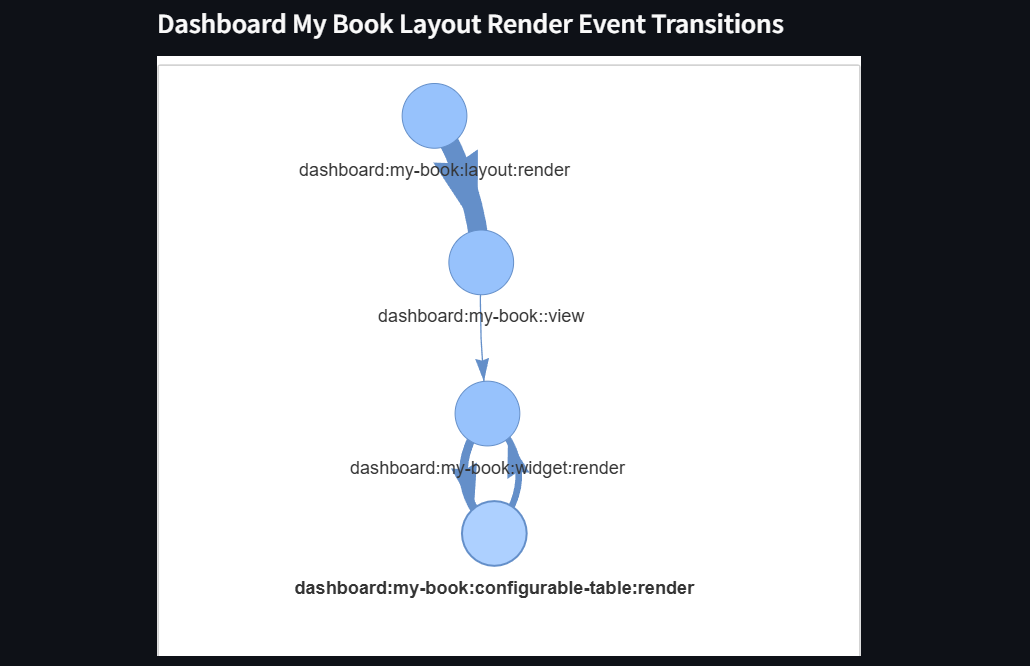
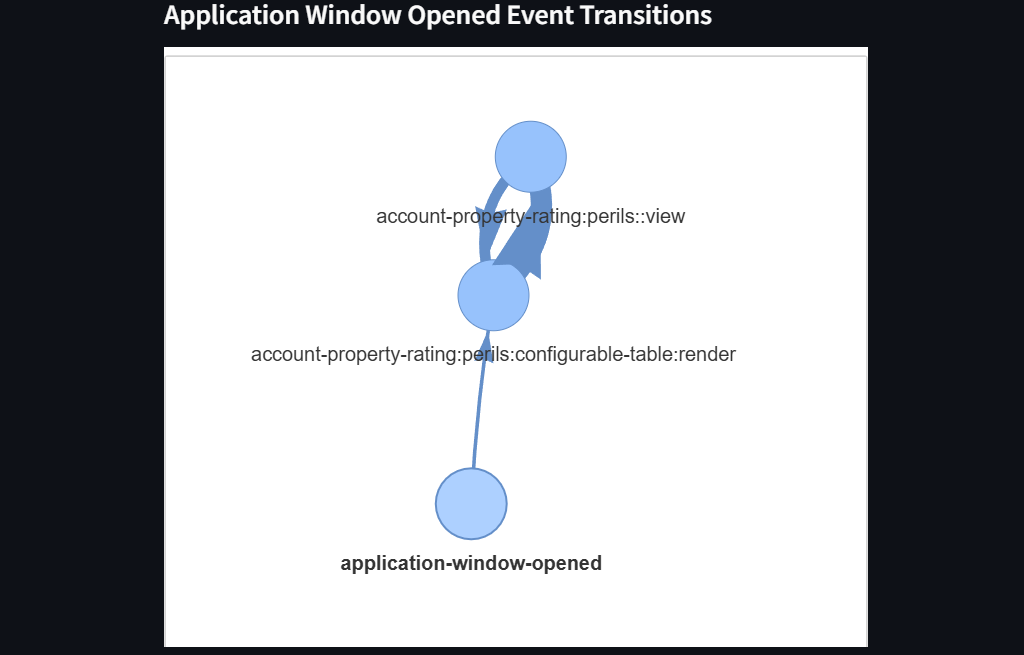
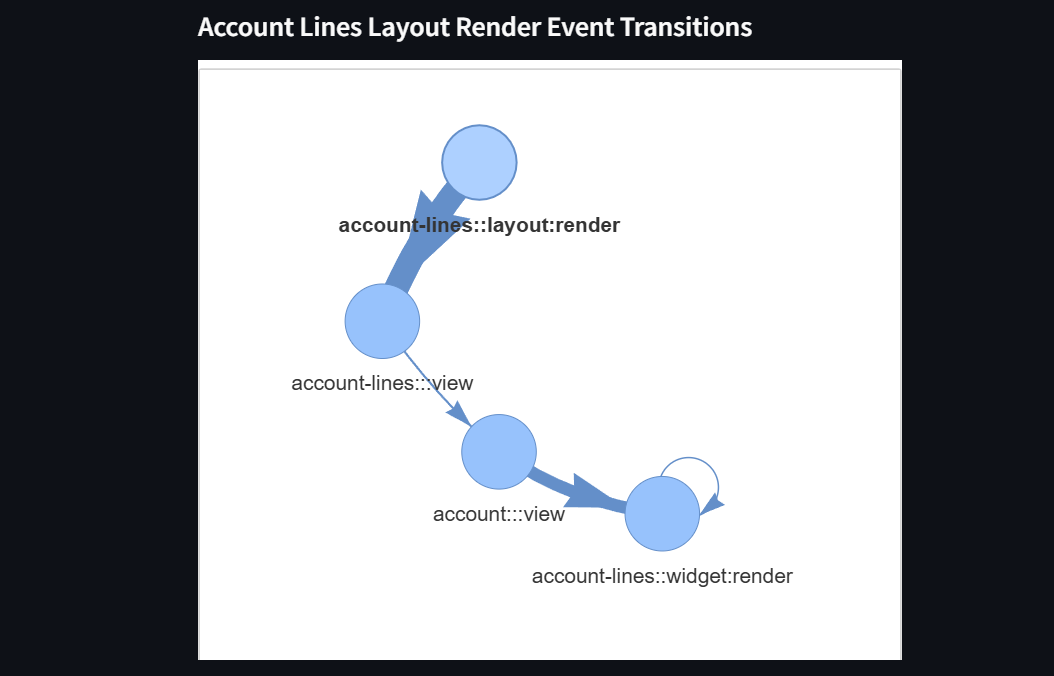
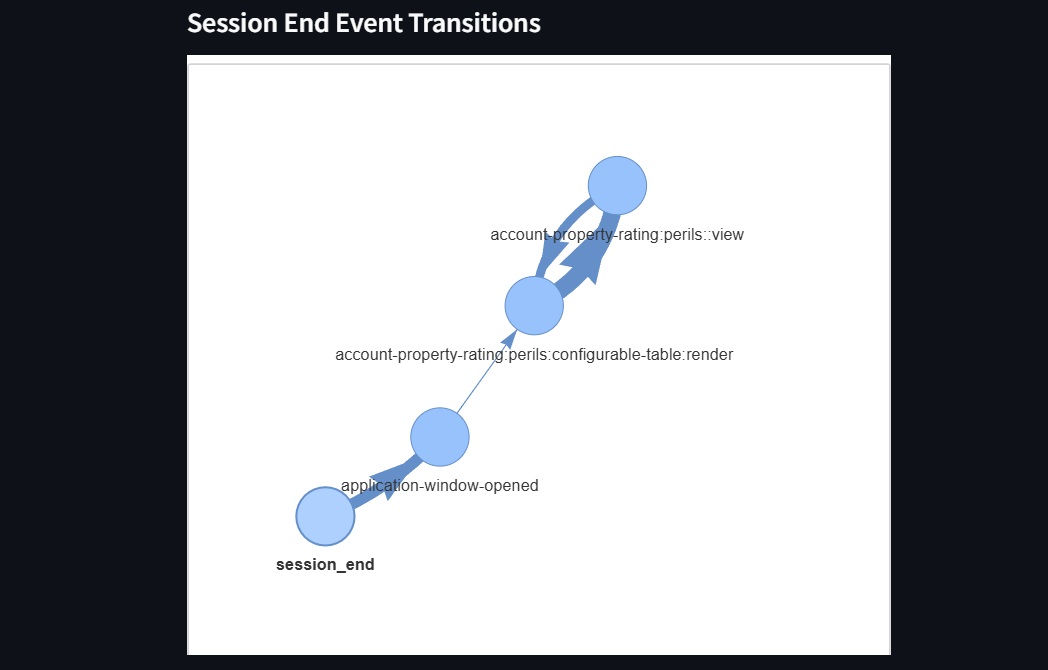
This workflow diagram visualizes how users transition between events, revealing key interaction patterns.
-
Tracking how users navigate account-related features to uncover engagement trends and optimize workflows.
-
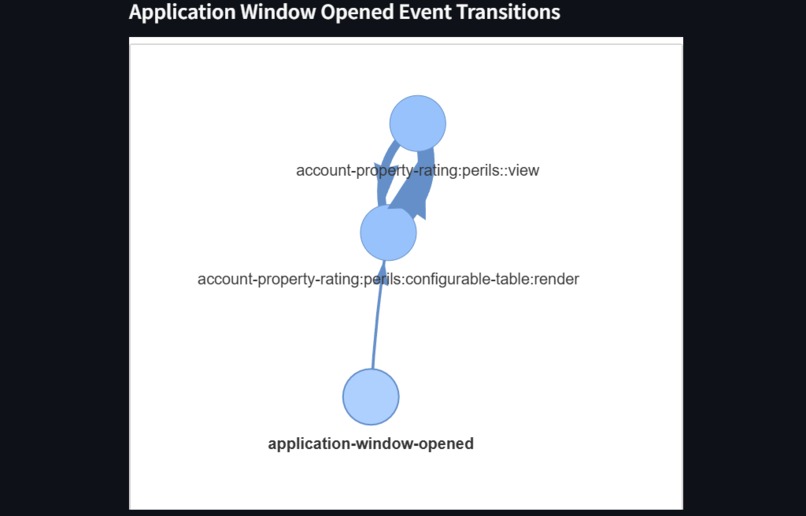
Understanding interactions with application windows to highlight how users access and engage with platform tools.
-
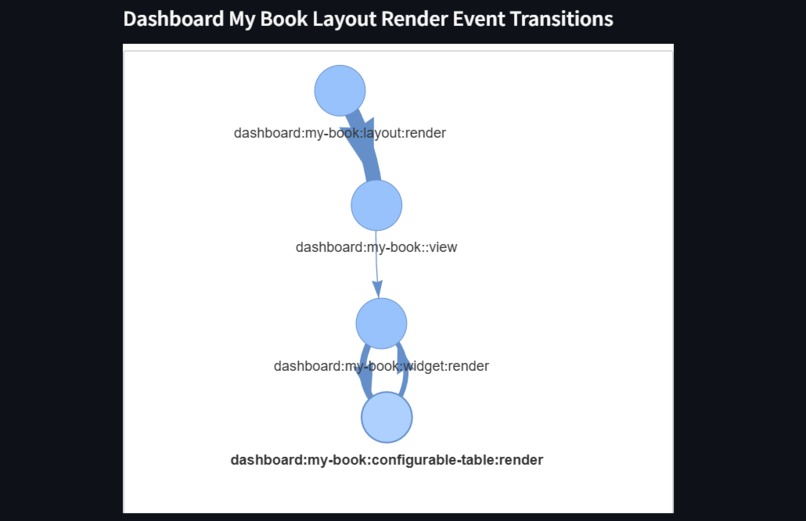
Analyzing dashboard navigation to pinpoint frequently accessed areas and improve usability.
-
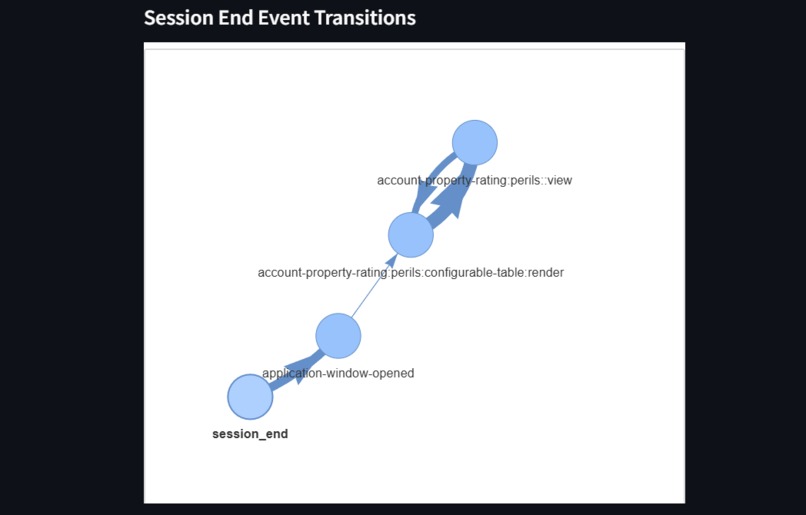
Identifying key drop-off points before a session ends to develop strategies for better user retention.
Inspiration 📊
Every user action tells a story. On platforms like Federato RiskOps, underwriters rely on digital tools to assess risks and make decisions. But what if we could predict what they’ll do next? By understanding user behavior, we can optimize workflows, reduce drop-offs, and improve engagement.
That’s where FlowCast comes in. We built a Markov Chain model to analyze user interactions and uncover patterns in engagement. Our interactive dashboard helps visualize these insights, giving Federato the tools to enhance user retention and navigation.
What It Does 🔍
FlowCast analyzes user behavior and predicts the next most likely action based on historical interactions. Our model achieves 54% accuracy, demonstrating that user actions follow predictable patterns. By mapping these behaviors, we can:
✅ Identify common user journeys
✅ Predict next actions in real time
✅ Highlight areas where users drop off
With these insights, Federato can improve platform usability and keep users engaged for longer.
How We Built It 🚀
We processed user event data from Amplitude (2024-2025), built a Markov Chain transition model, and developed an interactive Streamlit dashboard to explore trends.
🛠 Tech Stack:
- Python for data analysis & modeling
- Pandas, ijson for handling large event logs
- Matplotlib, Seaborn for visualization
- Google Drive API for data retrieval
- Streamlit for dashboard development
Challenges We Faced 🚩
Handling large event logs required chunked processing to prevent memory overload. Cleaning inconsistent data was another hurdle, ensuring our predictions were reliable. Our model performed well for common user actions but struggled with rare event transitions. We explored advanced modeling techniques to improve accuracy further.
Despite these challenges, we uncovered key engagement patterns, such as frequent event sequences (session_start → login) and drop-off points, helping optimize platform navigation.
Accomplishments We're Proud Of 💡
We successfully transformed raw event data into a clear, interactive dashboard that provides real-time insights. Seeing our model accurately predict user actions was a major win, proving that data-driven engagement strategies can enhance platform usability.
What We Learned 🧠
We gained hands-on experience with data processing at scale, probability modeling, and dashboard development. More importantly, we learned that clean data and clear visualizations make all the difference when turning insights into action.
What’s Next? ⏩
We want to take FlowCast further by enhancing our predictive model, adding real-time analytics, and fine-tuning recommendations through A/B testing. With more development, this could evolve into a real-time guidance system to improve user retention and engagement.
GitHub Repo 📂
Our code, including data processing, model implementation, and dashboard development, is available on GitHub. Check it out to explore our Markov Chain model, data visualization scripts, and workflow diagrams.
Built With
- google-colab
- google-drive-api
- jupyter-notebook
- matplotlib
- pandas
- python
- seaborn
- streamlit


Log in or sign up for Devpost to join the conversation.