-
-
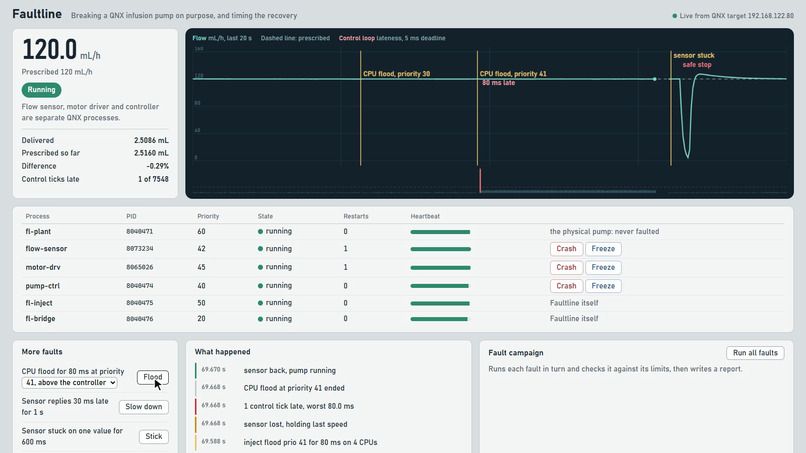
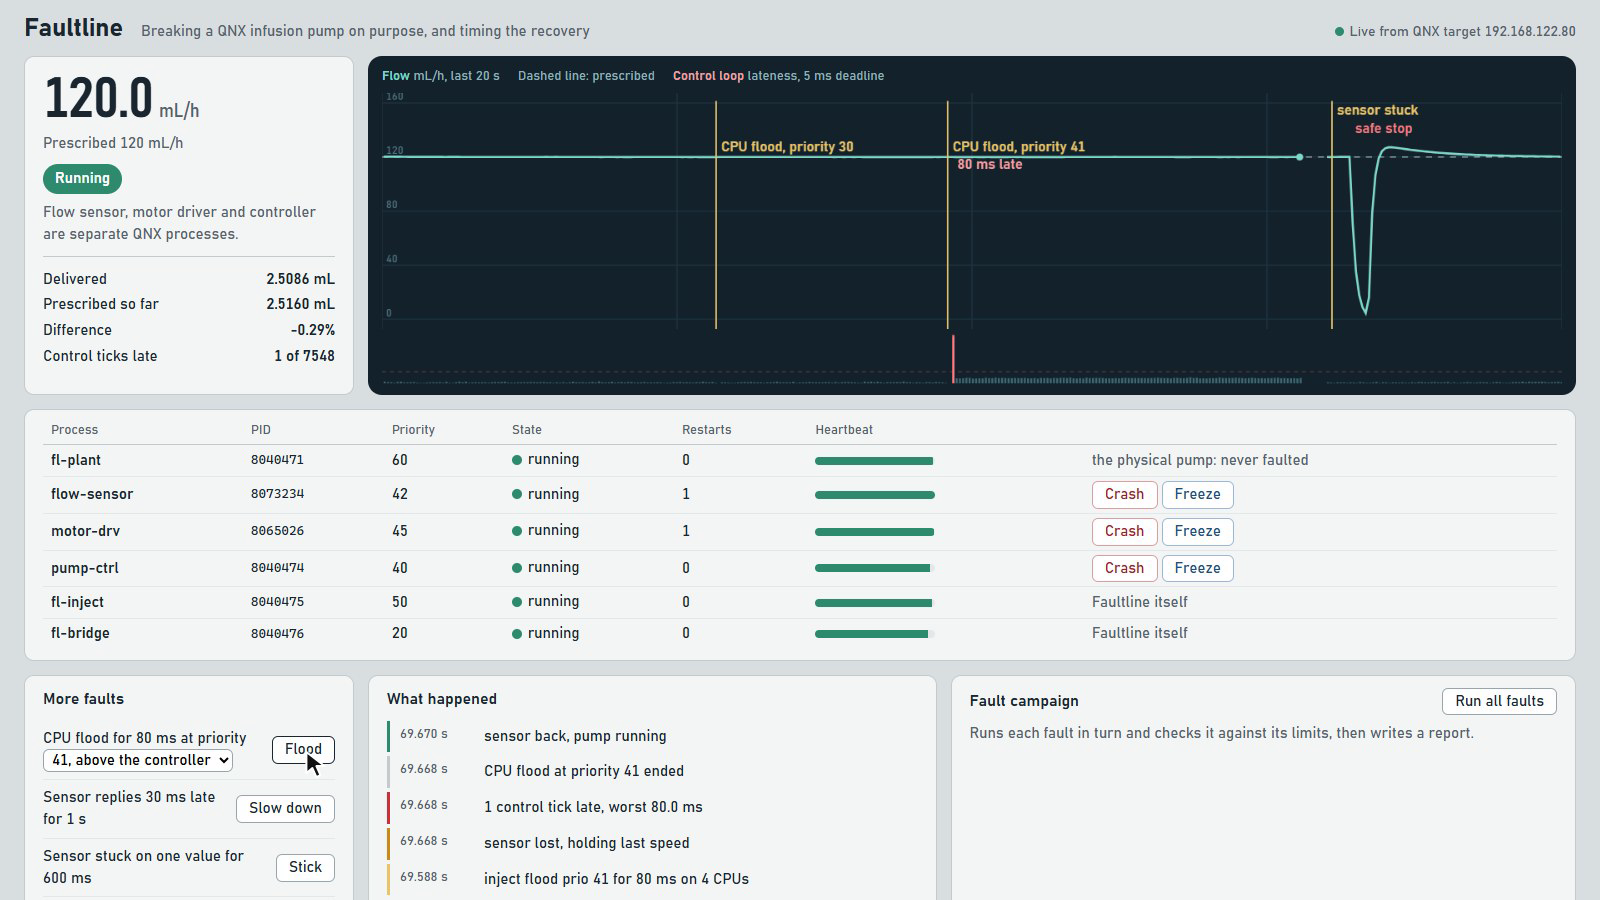
Live dashboard: flow trace with each fault and its recovery marked, process table with crash and freeze buttons, event log.
-
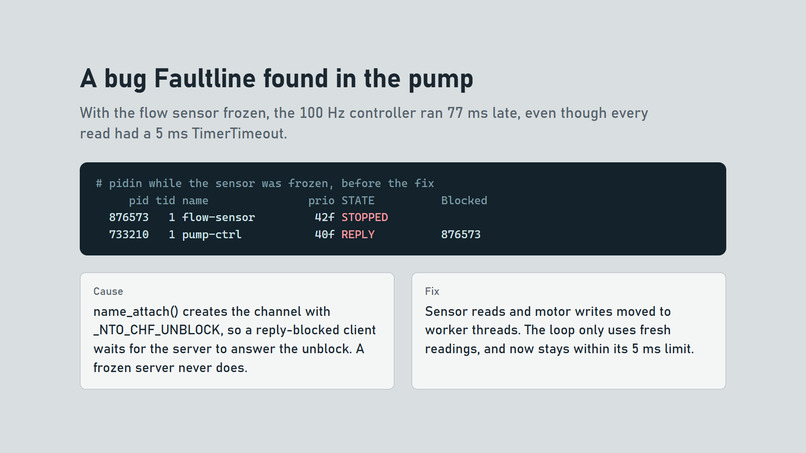
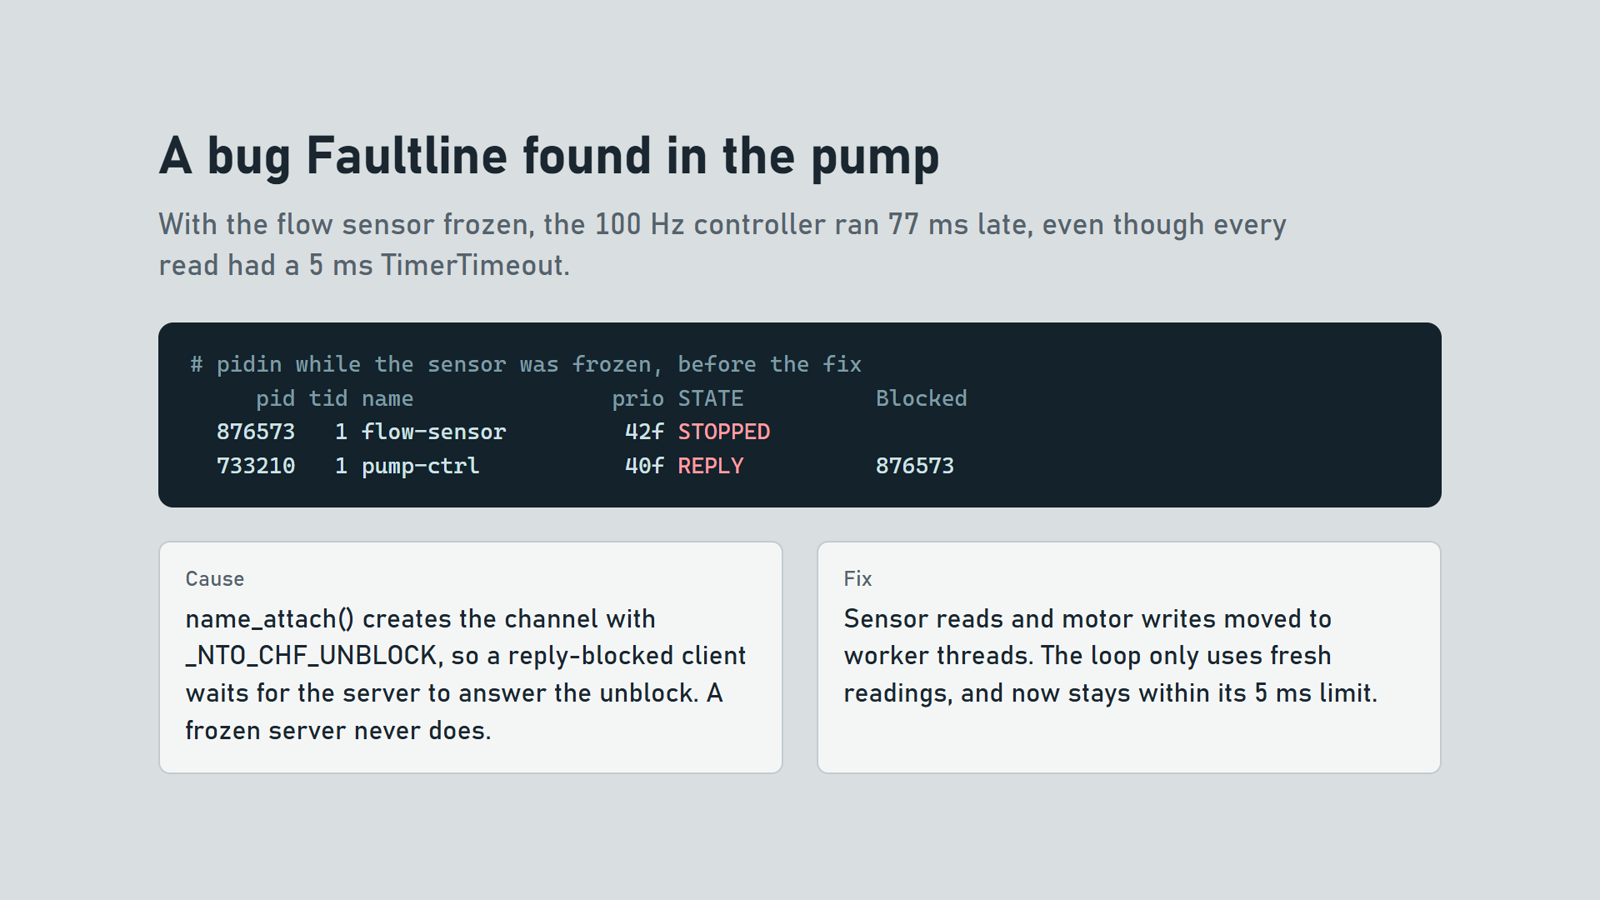
The bug Faultline found: a frozen sensor kept the controller REPLY-blocked for 77 ms despite a 5 ms TimerTimeout (_NTO_CHF_UNBLOCK).
-
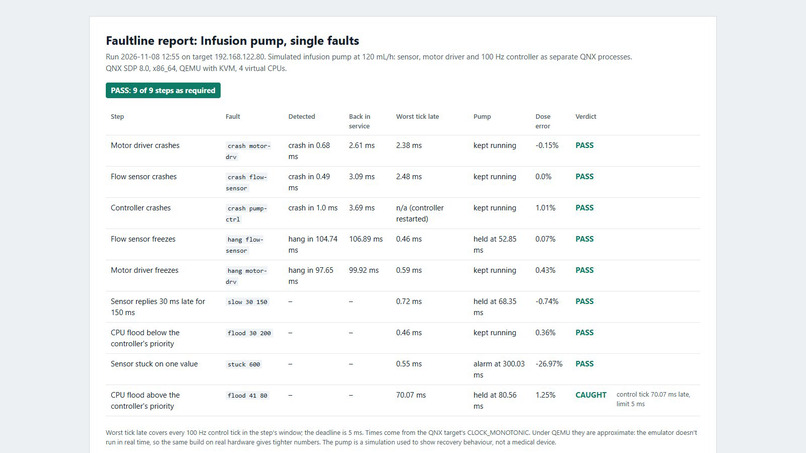
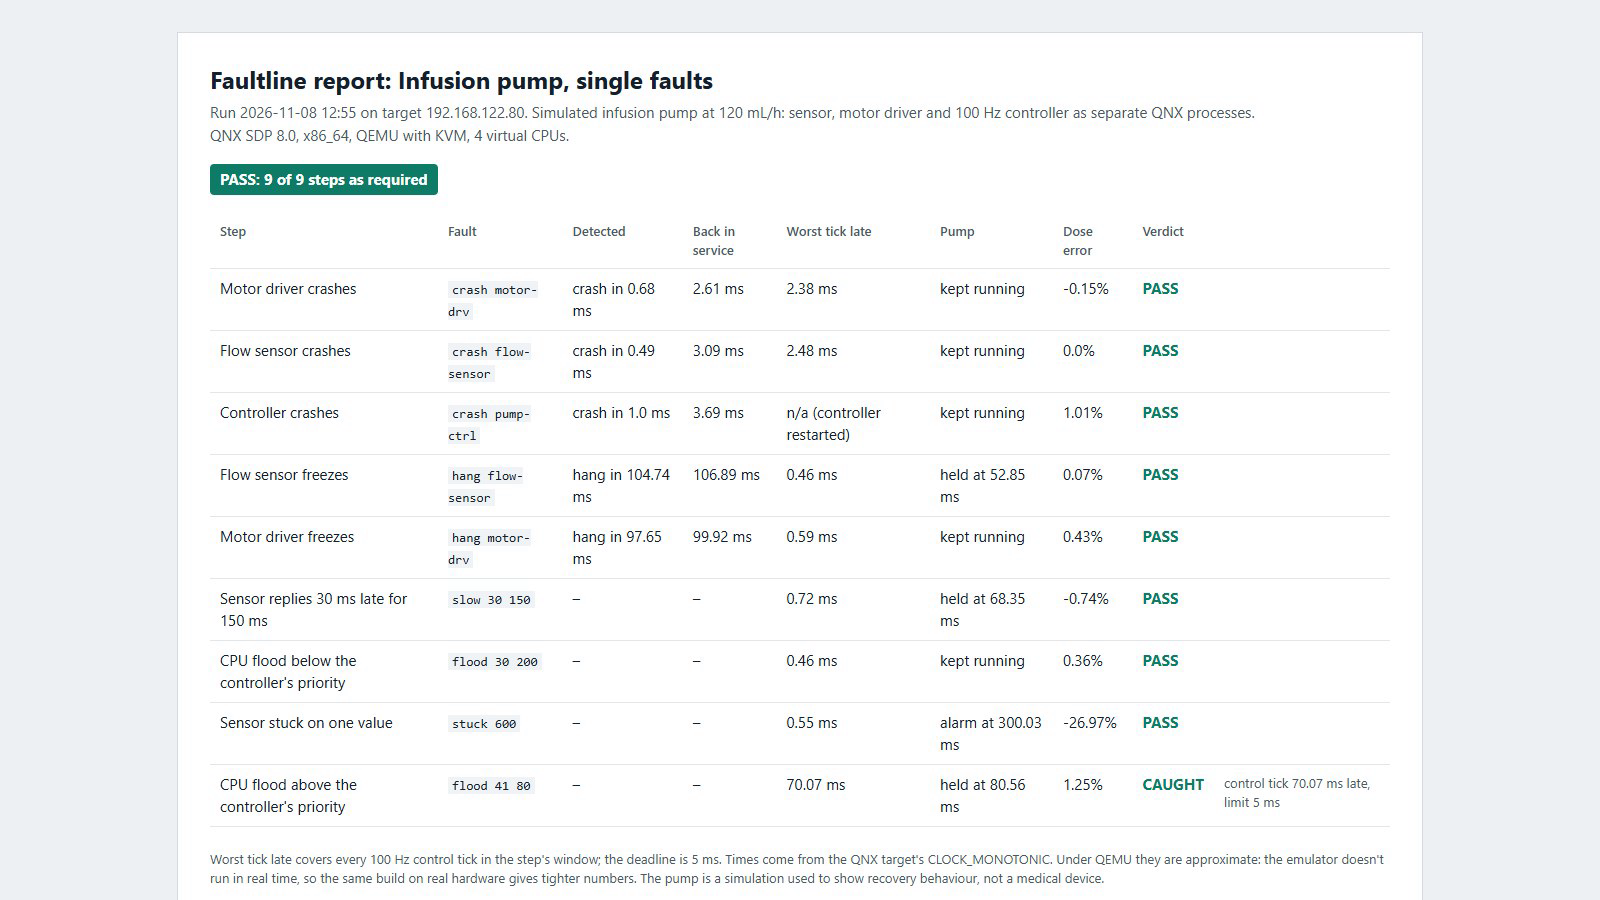
The campaign report: 9 of 9 steps as required, with detection, recovery, worst tick lateness, pump state and dose error per fault.
Inspiration
Software in an infusion pump, a car or a robot will fail at some point. What decides whether anyone gets hurt is what happens next: how fast the failure is noticed, how fast the system recovers, and whether it stays safe in between. Safety standards such as ISO 26262 list fault injection as a way to show that a system handles its own failures. In practice, people do it by hand, once, and the evidence is a screenshot. I wanted a tool that does it on a real QNX system, repeatably, and turns each fault into numbers you can keep.
What it does
Faultline injects faults into a live QNX 8.0 system while it runs, and measures four things for each one:
- how fast the failure was noticed
- how fast the process was serving again
- whether the real-time loop kept its deadline
- whether the outcome that matters stayed within limits (here, the dose a pump delivers)
The faults:
- Crash:
SIGSEGVto a process. - Freeze:
SIGSTOP, so the process is alive but silent. - CPU flood: one busy
SCHED_FIFOthread per CPU, above or below the controller's priority. - Slow replies: the sensor answers each request late.
- Stuck sensor: it keeps answering with the same value.
Faults are injected through a resource manager, so one is just echo "crash motor-drv" > /dev/faultline/inject.
A campaign is a JSON file listing faults and the limits each must meet: recovery time, worst control-tick lateness, whether the pump must keep running or reach its safe state, and dose error. The campaign runner injects each fault, judges it, and writes a Markdown and HTML report. A step can be marked expect_fail, which checks the checker. For example, a flood above the controller's priority must be caught as a deadline miss, or the step fails.
It ships with a system to break: a simulated infusion pump built from separate QNX processes. They are a 1 kHz plant model, a flow sensor, a motor driver, a 100 Hz PI controller with a stuck-sensor check and a safe-stop path, and a supervisor that restarts whatever fails. A browser dashboard draws the flow like a bedside monitor, with each fault and its recovery time marked on the trace.
The campaign run recorded in the demo video (QEMU, from docs/sample-report.md):
| Fault | Noticed | Back in service | Worst tick late | Pump | Verdict |
|---|---|---|---|---|---|
| Motor driver crashes | 0.68 ms | 2.61 ms | 2.38 ms | kept running | Pass |
| Flow sensor crashes | 0.49 ms | 3.09 ms | 2.48 ms | kept running | Pass |
| Controller crashes | 1.0 ms | 3.69 ms | n/a (it was restarted) | kept running | Pass |
| Flow sensor freezes | 104.7 ms | 106.9 ms | 0.46 ms | held its speed | Pass |
| Motor driver freezes | 97.7 ms | 99.9 ms | 0.59 ms | kept running | Pass |
| Sensor replies 30 ms late for 150 ms | 0.72 ms | held, then resumed | Pass | ||
| CPU flood below the controller | 0.46 ms | kept running | Pass | ||
| Sensor stuck on one value | 0.55 ms | stopped itself at 300 ms | Pass | ||
| CPU flood above the controller | 70.1 ms | held its speed | Caught |
The control loop's deadline is 5 ms. Worst tick late is the worst of every 100 Hz tick in the step. Numbers vary a little from run to run; each report records its own run and environment.
What it found
Faultline found two real problems in the pump's own design. Both are now fixed.
- A frozen server held its client, despite a timeout.
- The controller read the sensor with
MsgSend()and a 5 msTimerTimeout(). Yet with the sensor frozen, the 100 Hz loop ran 77 ms late. pidinshowed the controller inREPLYon the sensor's PID.- The cause:
name_attach()creates the channel with_NTO_CHF_UNBLOCK. A reply-blocked client is then only released once the server handles the unblock pulse, and a stopped server never does. - The fix: sensor reads and motor writes moved to worker threads, so the control loop never waits on another process and only uses readings fresh enough to trust. With the sensor frozen, the worst tick is now 0.46 ms late.
- The sensor also now answers
_PULSE_CODE_UNBLOCKwithMsgError(ETIMEDOUT)and does slow replies as timer-driven deferred replies, so a sensor that is alive but slow releases the controller at its 5 ms timeout.
- The controller read the sensor with
- Crash detection waited for core dumps.
- A process killed by
SIGSEGVgoes todumperfor a core file before its parent can reap it, so detection took about 20 ms. - The supervisor now sets
RLIMIT_COREto 0 for its children, and detection takes 0.5 to 1 ms.
- A process killed by
How I built it: where QNX is used
Everything on the target is C, cross-compiled with qcc -Vgcc_ntox86_64 from QNX SDP 8.0.5, and runs on a QNX 8.0 x86_64 image built with mkqnximage and booted in QEMU with KVM.
- Native message passing:
- The sensor is a
name_attach()server answeringMsgReceive()/MsgReply(). It handles_PULSE_CODE_UNBLOCKand holds slow replies as deferred replies driven by a one-shot timer pulse (target/flow-sensor.c). - The controller reads it with
name_open(),MsgSend()andTimerTimeout()(target/pump-ctrl.c:58-65).
- The sensor is a
- Pulses and timers:
- Periodic
timer_create()withSIGEV_PULSE_INITdrives the 1 kHz plant and the 100 Hz loop (target/fl.c:125-126,target/pump-ctrl.c:178). - Heartbeats are
MsgSendPulse()to the supervisor, carrying the sender's pid (target/fl.c:106).
- Periodic
- Resource managers:
/dev/fl/motor(target/motor-drv.c:115) and/dev/faultline/inject(target/fl-inject.c:239) are built withresmgr_attach(),iofunc_*andpulse_attach().- A rejected fault fails the
write()withENOENT,EPERMorEBUSY.
- Process supervision:
posix_spawn()withSCHED_FIFOattributes (target/fl-supervisor.c:61-67).- A
waitpid()reaper thread that pulses the main loop (:87,:105). - Heartbeat deadlines on a
name_attach()channel (:262,:291). RLIMIT_COREset per child (:259).
- Priority scheduling: every process has a fixed
SCHED_FIFOpriority fromtarget/system.conf, and the flood fault spawns busySCHED_FIFOthreads above or below the controller. - Shared memory: the plant state and event ring live in a
shm_open()object (target/fl.c:26).
On the host, the dashboard and campaign runner (dashboard/) use only the Python standard library. They talk to the target over a TCP bridge (target/fl-bridge.c, port 7700) that streams JSON lines.
Challenges I ran into
- The timeout that didn't time out. Working out why
TimerTimeout()didn't release the controller meant readingpidinoutput mid-fault and theChannelCreate()flagsname_attach()uses. The fix changed the controller's design, not just its timeout value. - Making a CPU flood show up on a multi-core target. One busy thread did nothing with four CPUs, so the flood now runs one thread per online CPU.
- Slow sensor replies made the controller flap between running and holding. The fix was a 50 ms grace period before it treats the sensor as lost.
- Measuring lateness correctly. After a stall, QNX delivers the timer pulses that queued up back to back. A loop that counts pulses to find its schedule then thinks it is ahead of time, and reports every later tick as on time. The controller now works out which slot is due from the clock, and the dashboard samples the worst tick every 50 ms.
- Measuring honestly in an emulator. QEMU doesn't run in real time, so every number is labelled as QEMU-measured, and each report records its environment.
Accomplishments that I'm proud of
- The two findings are real bugs found by the tool in its own reference system, explained down to the kernel flag, and fixed.
- A full campaign passes 9 of 9, including a step that proves the checker catches a real deadline miss.
- Crash recovery takes 2.6 to 3.7 ms end to end, from fault to the restarted process's first heartbeat, and the pump keeps running throughout.
What I learned
- How QNX message passing behaves when the other side stops:
SENDandREPLYblocking, unblock pulses, and why the channel flags matter. - Why a supervisor's view of a "crash" includes the time
dumpertakes. - What a safety argument needs from a test: a written limit, a repeatable fault, and a recorded result.
What's next for Faultline
- Run the same campaigns on real hardware (a Raspberry Pi 4 build is included but untested) and compare against QEMU.
- More faults: memory pressure, file-descriptor exhaustion, and dropped or corrupted messages.
- Kernel event traces (
tracelogger) captured around each fault and attached to the report. - A campaign runner that runs on the target alone, for CI on a board farm.
Build and run
- QNX version: QNX SDP 8.0 (8.0.5 patch set), QNX Everywhere licence.
- Target: QNX 8.0 x86_64 image built with
mkqnximage --type=qemu, run in QEMU with KVM (4 vCPUs, 2 GB). Host: Ubuntu 24.04 (WSL2 on Windows 11 also works). - Toolchain:
qcc -Vgcc_ntox86_64(GCC from SDP 8.0), GNU make.
tools/build-target.sh          # builds the target programs with qcc
tools/make-vm.sh               # builds the QNX 8.0 QEMU image in ~/fl-vm
tools/vm.sh start              # boots it and waits for SSH
tools/vm.sh deploy             # copies programs and system.conf to /data/fl
tools/vm.sh run                # starts fl-supervisor, which starts everything else
tools/dash.sh start            # dashboard on http://localhost:8800
tools/dash.sh campaign pump    # or click "Run all faults"
Full details, including the apt packages and network setup, are in the README.
Built With
- c
- html5
- javascript
- posix
- python
- qcc
- qemu
- qnx
