What inspired me
I've always been interested in distributed systems and microservice architectures. One challenge that stood out to me was understanding cascading failures. A single database issue can affect multiple downstream services, but visualizing that impact is often difficult.
The more I learned about incident response, the more I noticed the same pattern. Teams can usually tell that something is broken, but understanding how far the failure has spread and where to start fixing it is much harder.
When the H0 Hackathon was announced, the requirement to use one of three AWS Databases with Vercel felt like the right opportunity to build something around that problem. I chose the Monetizable B2B track because I genuinely think SRE and platform engineering teams would benefit from a tool like this.
How I built it
The stack is Next.js 16 on Vercel with Amazon Aurora PostgreSQL Serverless v2 on the backend. The application connects to Aurora through RDS Proxy for connection multiplexing, and uses Drizzle ORM for type-safe queries and schema management.
The high-level architecture looks like this:
┌──────────────────────────────────┐
│            Vercel                │
│  ┌────────────────────────────┐  │
│  │    Next.js App Router      │  │
│  │    (API Routes + Frontend) │  │
│  └──────────┬─────────────────┘  │
│             │                    │
│  ┌──────────▼─────────────────┐  │
│  │    Drizzle ORM             │  │
│  └──────────┬─────────────────┘  │
└─────────────┼────────────────────┘
              │
┌─────────────▼────────────────────┐
│            AWS                   │
│  ┌────────────────────────────┐  │
│  │  RDS Proxy                 │  │
│  │  (connection multiplexing) │  │
│  └──────────┬─────────────────┘  │
│             │                    │
│  ┌──────────▼─────────────────┐  │
│  │  Aurora PostgreSQL         │  │
│  │  Serverless v2             │  │
│  │  (7 tables, graph schema)  │  │
│  └────────────────────────────┘  │
│                                  │
│  ┌────────────────────────────┐  │
│  │  AWS Bedrock               │  │
│  │  (AI Root Cause Analysis)  │  │
│  └────────────────────────────┘  │
└──────────────────────────────────┘
The database uses 7 tables that model the full incident lifecycle. The services table is the core registry. The dependencies table stores directed edges between services with dependency type, confidence score, and observed latency. The health_signals table tracks time-series metrics per service. The current_traffic_snapshots table holds per-service revenue data. The failure_events, incidents, and blast_radius_results tables handle the full incident lifecycle from detection to resolution.
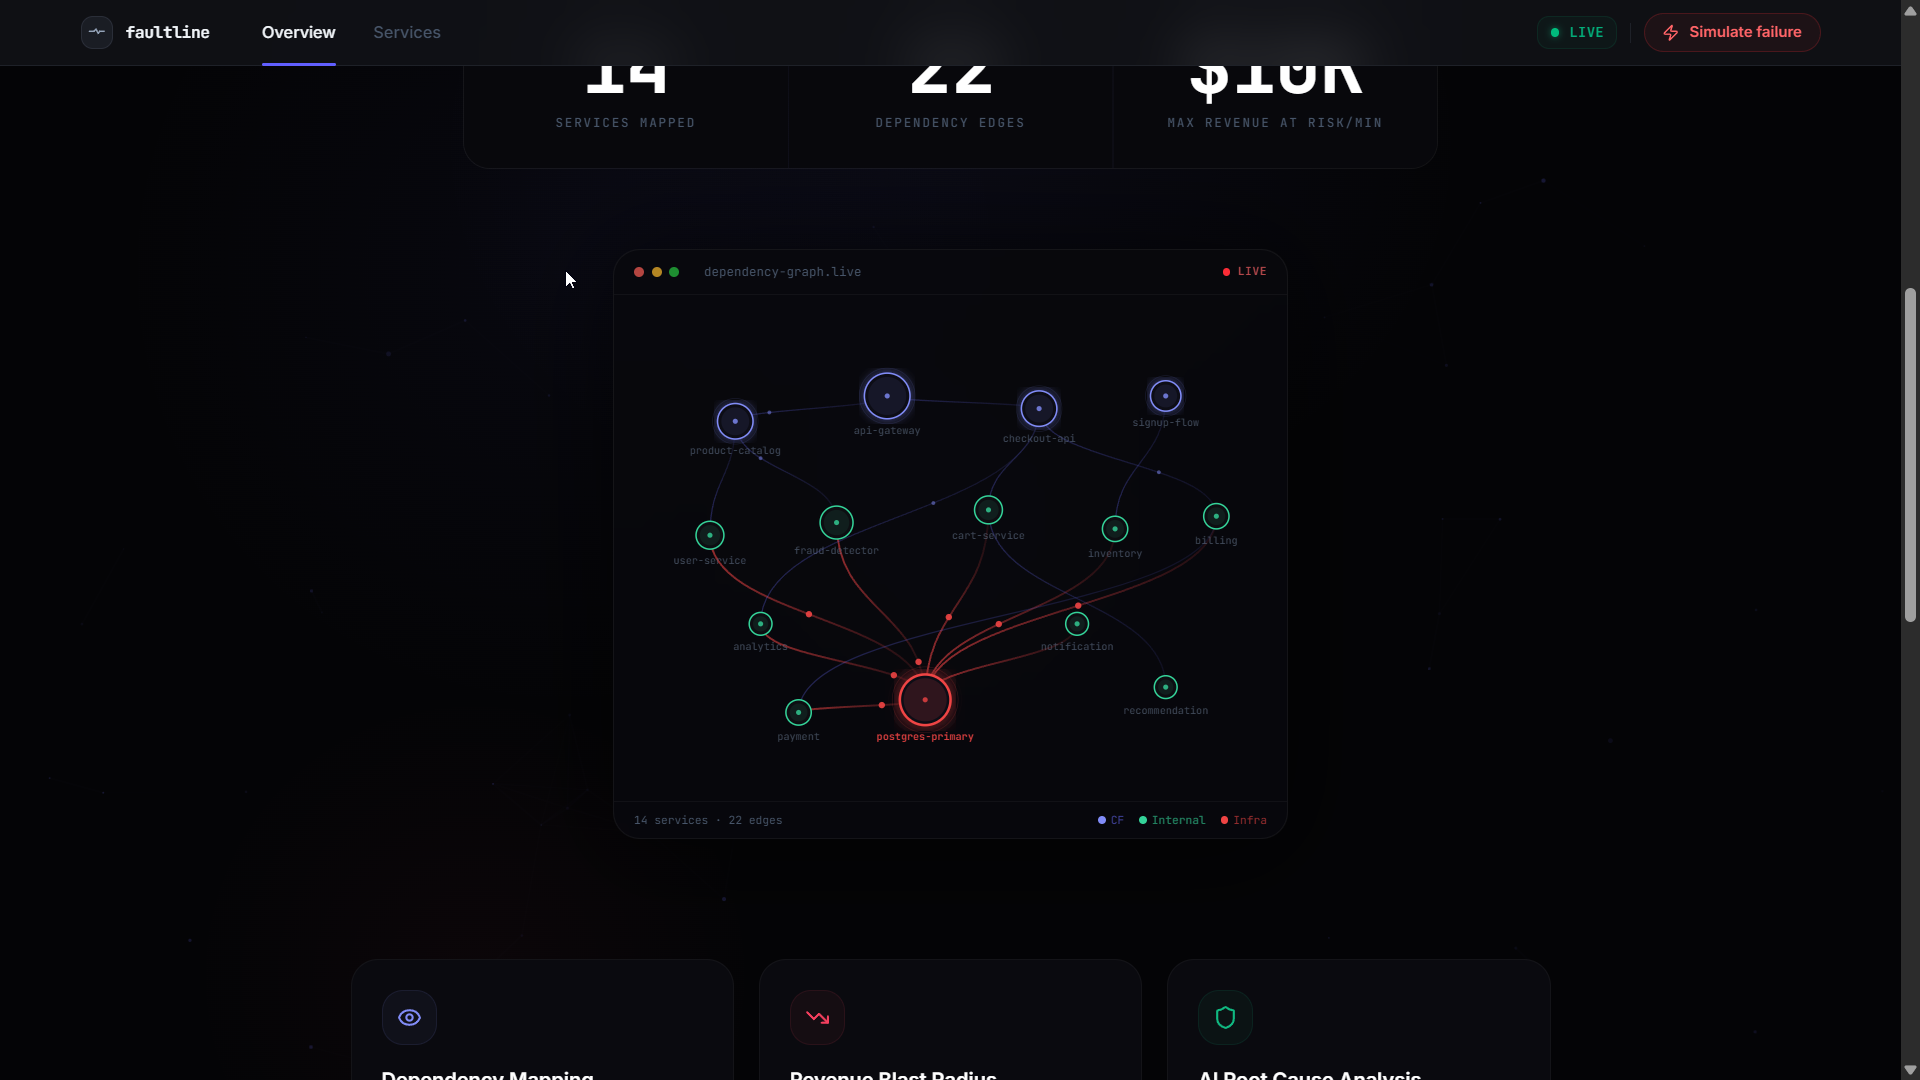
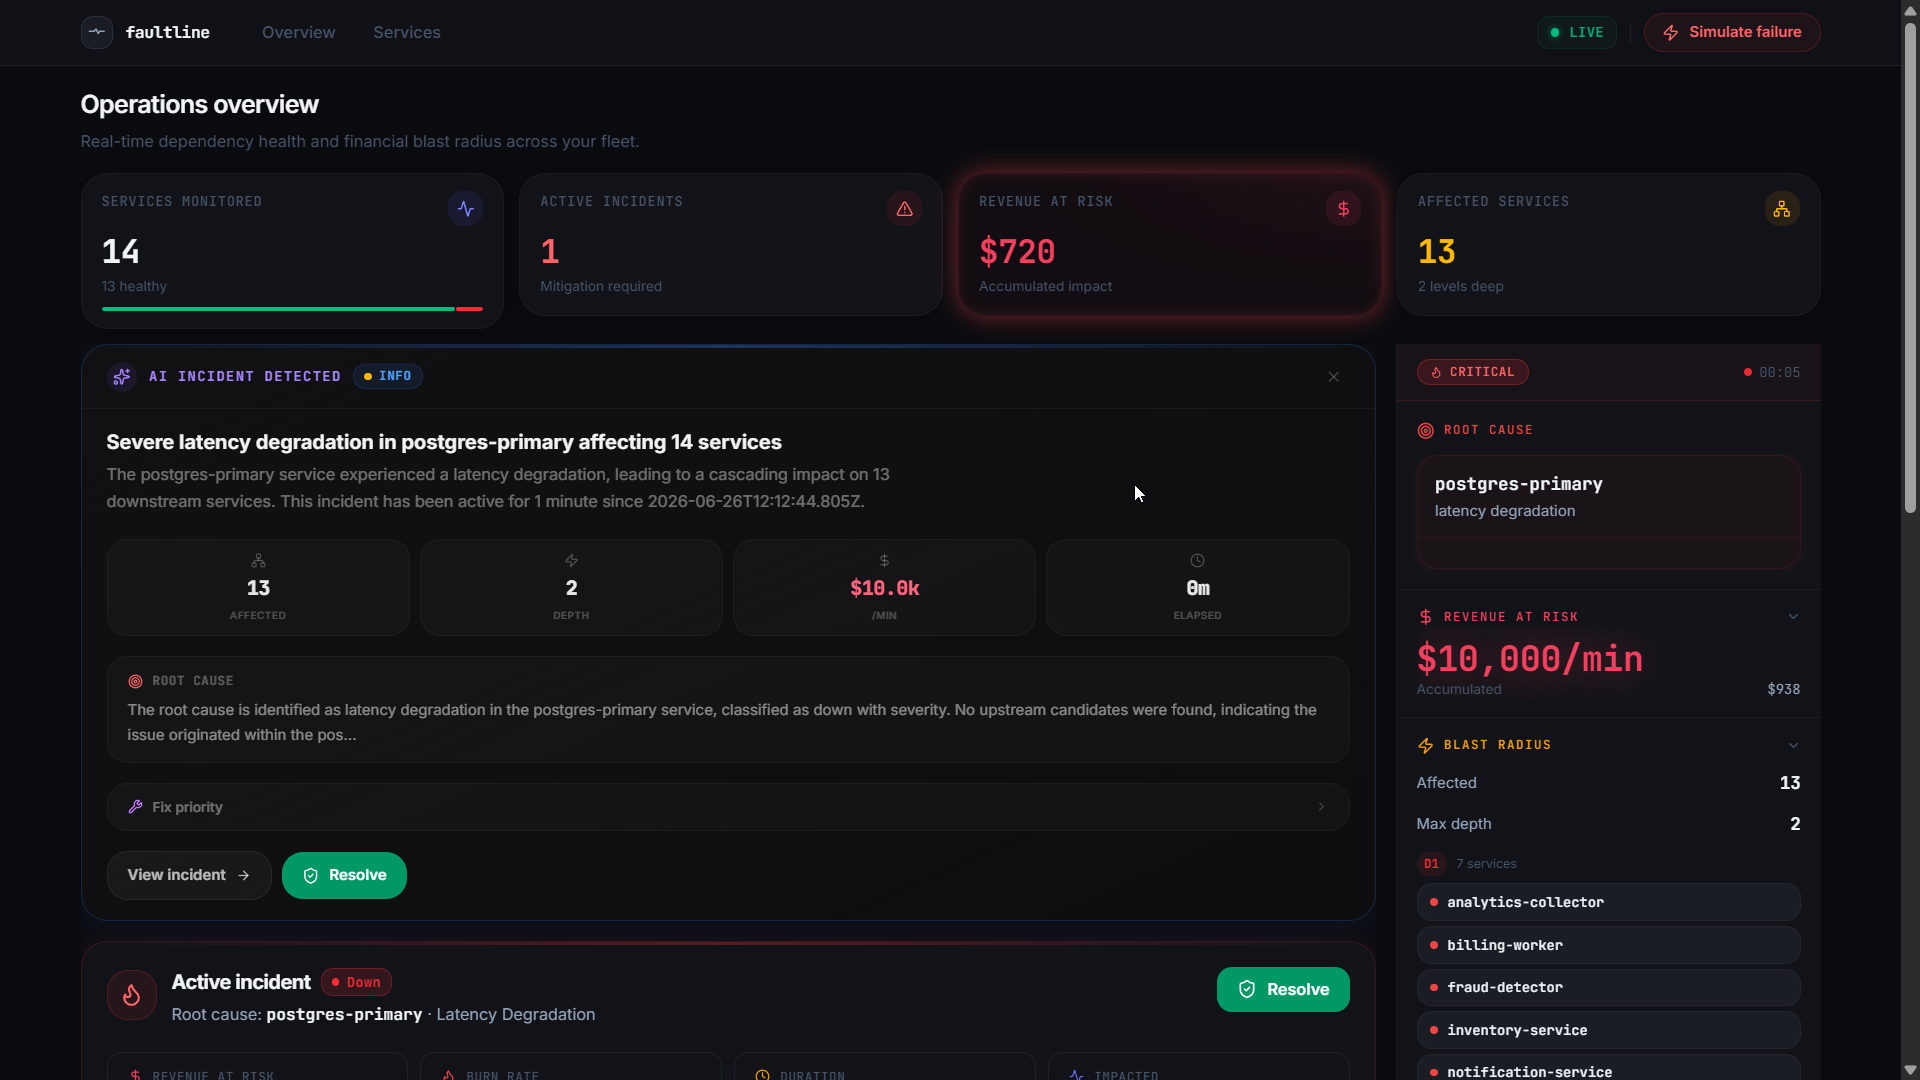
The most important feature is the blast radius computation. When a failure is detected on a service, the API traverses the dependencies table using recursive CTEs and multi-hop JOINs to walk the graph from the root cause outward. Each affected service gets written to blast_radius_results with its depth, dependency path, and whether it is customer-facing.
The revenue impact calculation then joins blast_radius_results with current_traffic_snapshots to sum total revenue at risk across all affected customer-facing services. This is a filtered multi-table aggregation, which is why a relational database was essential.
For the AI piece, I connected AWS Bedrock to generate incident summaries. The /api/summary endpoint queries the database for the full incident context, the root failure event, affected services, upstream candidates, and revenue numbers, and sends all of that as a structured prompt to Bedrock. It returns a headline, root cause analysis, blast radius breakdown, and a ranked fix priority.
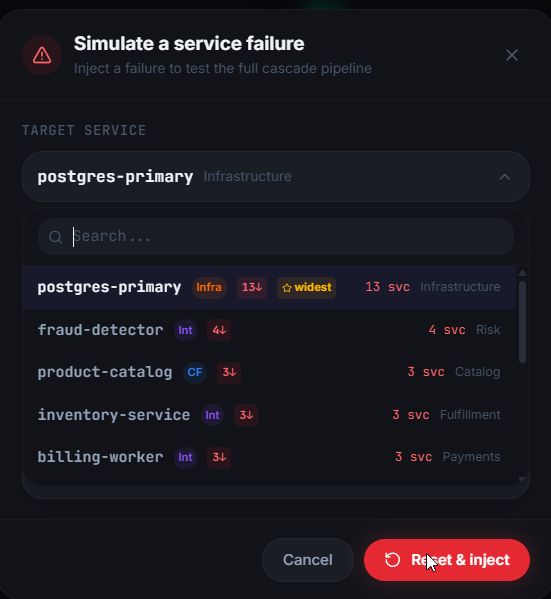
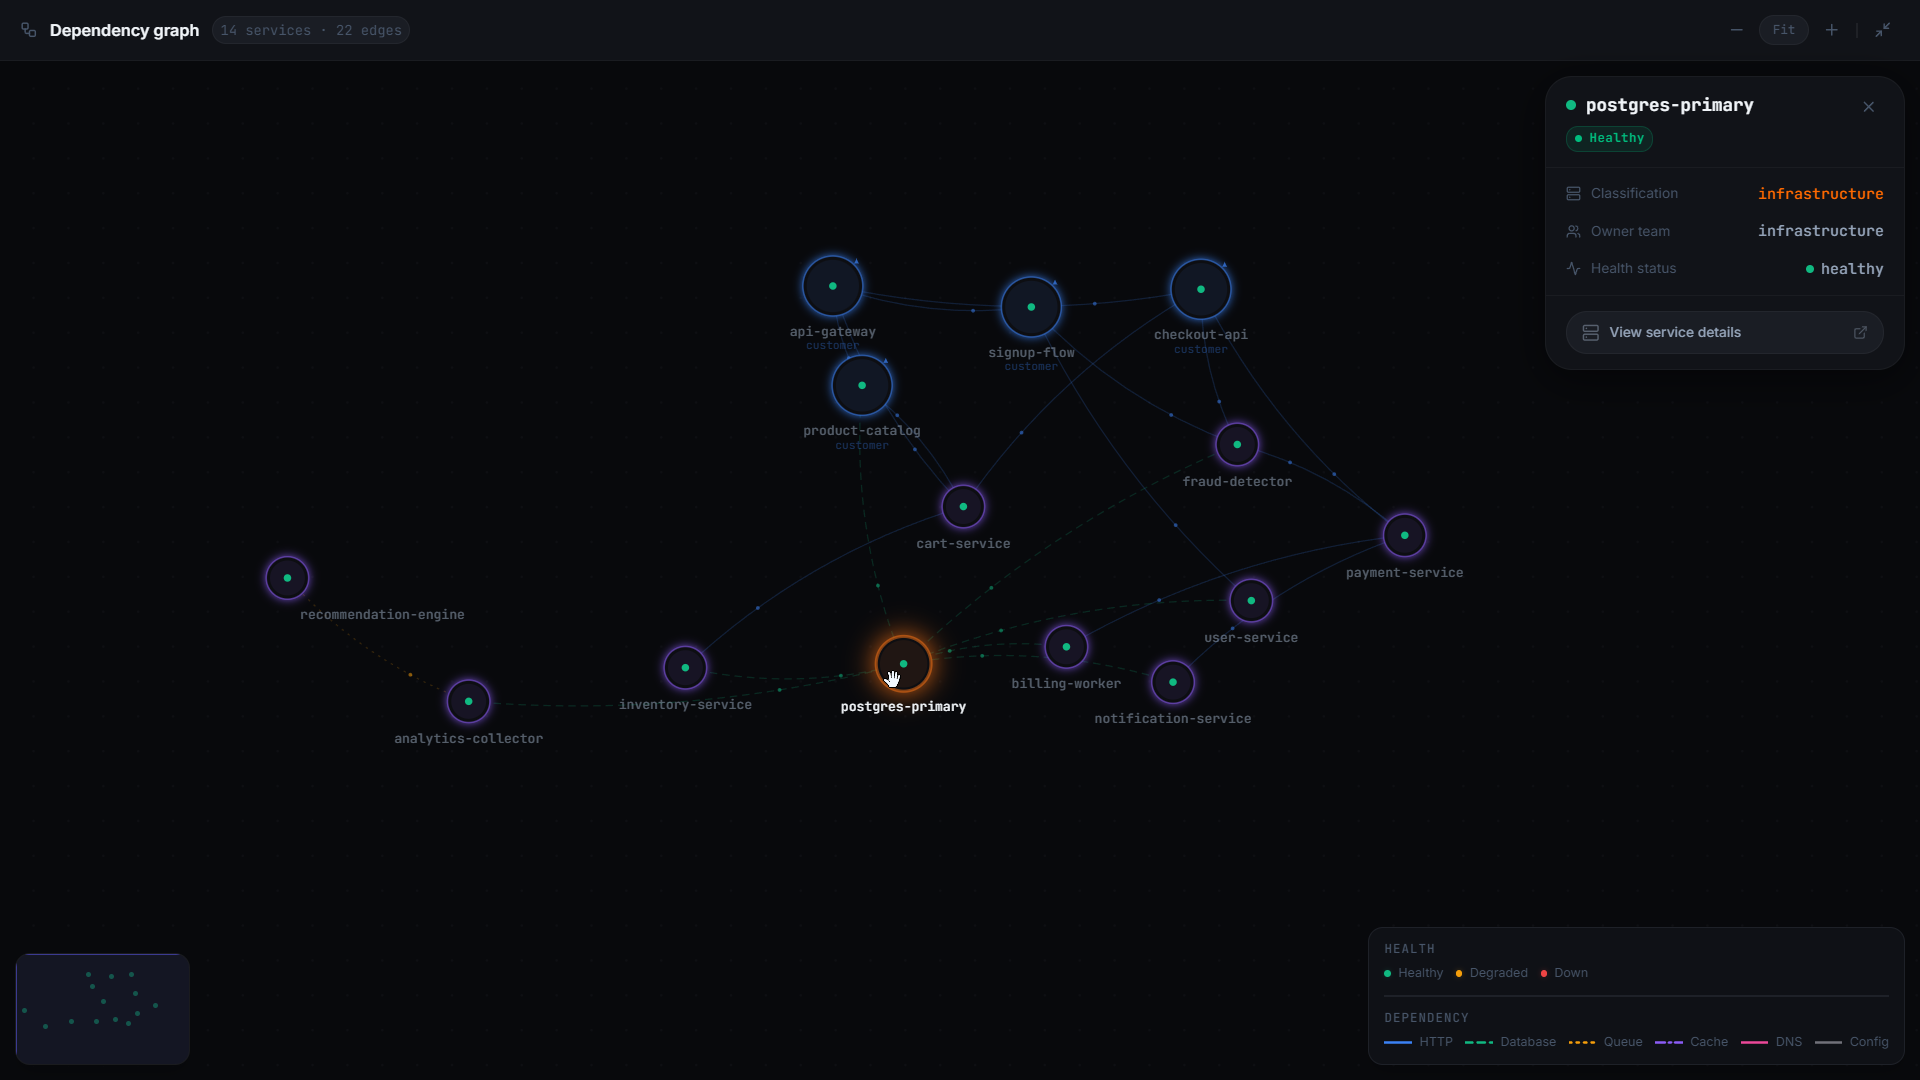
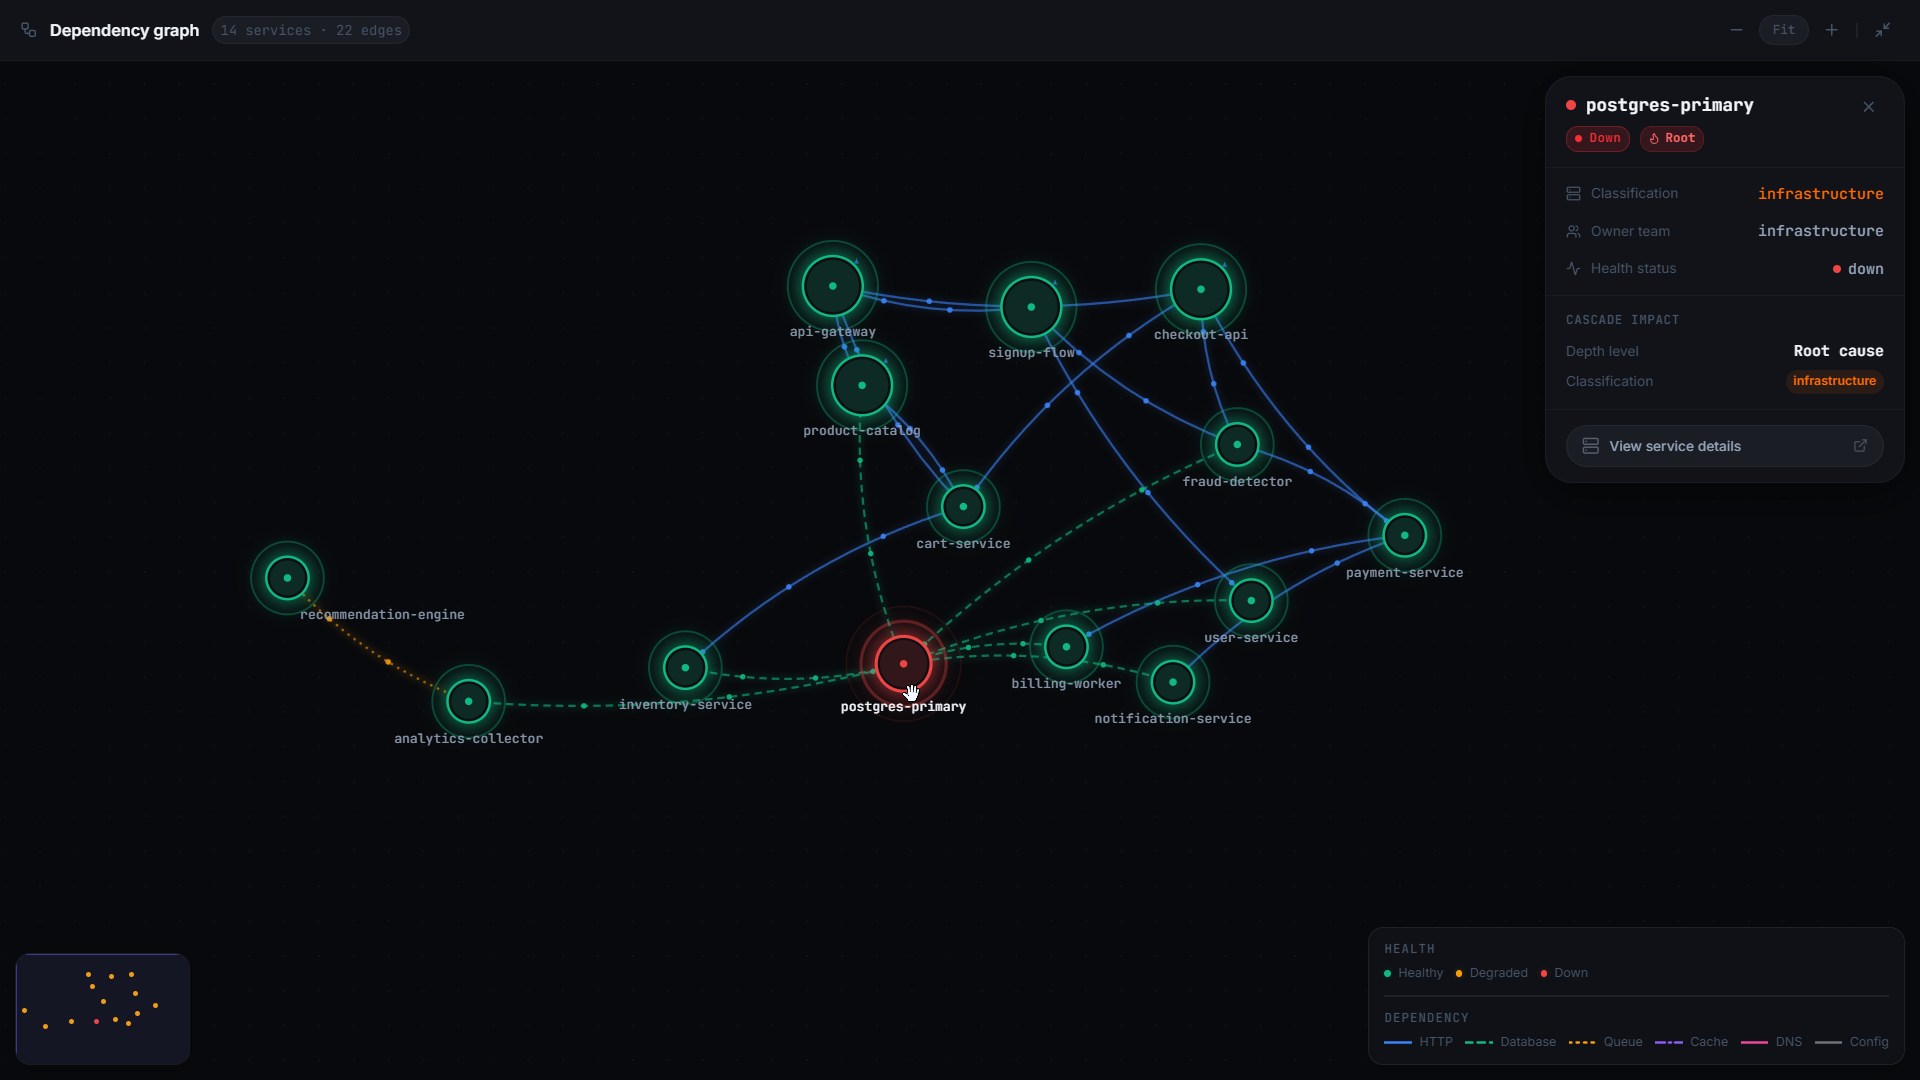
On the frontend, the dependency graph renders on HTML5 Canvas with a force-directed layout. There is a simulate failure feature where you pick any of the 14 services and watch the cascade happen in real time. Nodes change color by depth, edges light up with animated particle flow, and the revenue counter ticks upward as the blast radius expands.
What I learned
Aurora PostgreSQL was the right choice, not just a requirement. The blast radius algorithm depends on recursive CTEs, foreign key relationships, composite indexes, and CHECK constraints that prevent graph corruption. A document store would have made this significantly harder to implement and less reliable in practice.
RDS Proxy is essential when connecting serverless functions to a relational database. Without it, every function invocation tries to open a new connection and you hit Aurora's connection limit almost immediately. RDS Proxy multiplexes thousands of invocations into a small pool of database connections.
Graph layout is harder than it looks. A basic force simulation works for 14 nodes but anything production-grade would need a proper hierarchical layout with infrastructure services at the bottom and customer-facing services at the top.
Pre-computed traffic snapshots are the only way to get real-time revenue impact. Trying to calculate revenue on the fly during an incident is too slow and gives unreliable answers. Having per-service revenue data pre-computed and ready to join with blast radius results makes the query fast and the numbers accurate.
Challenges
The biggest challenge was the connection architecture. My first approach connected directly from Vercel serverless functions to Aurora and it broke immediately under load. Setting up RDS Proxy with Secrets Manager authentication and getting the connection pool configuration right took a full day of debugging.
The second challenge was the indexing strategy for graph traversal. With 14 services and 22 edges the queries are fast, but I had to think carefully about which composite indexes to create. Indexes on source and target filtered for confidence above 0.3 make a real difference when traversing the graph at multiple depth levels.
The third challenge was making the Canvas graph feel alive. Getting particle flow on edges, cascade animations during failures, node color transitions by depth, and smooth 60fps rendering all at once was more involved than I expected. Everything runs through requestAnimationFrame with batched draw calls to keep performance in check.
Built With
- amazon
- amazon-web-services
- css
- drizzle
- next.js
- rds
- react
- tailwind
- typescript
- vercel

Log in or sign up for Devpost to join the conversation.