-
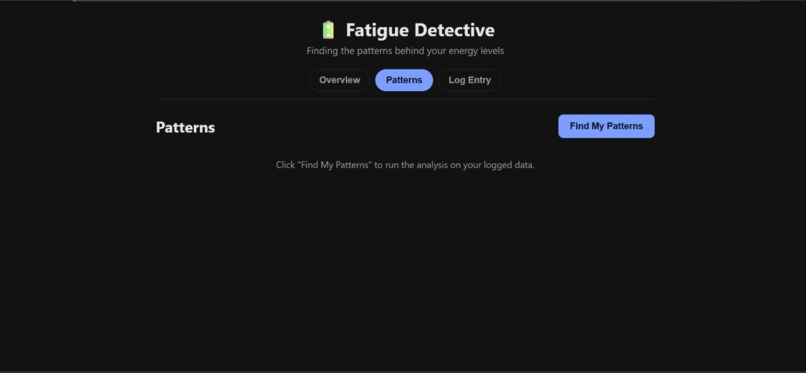
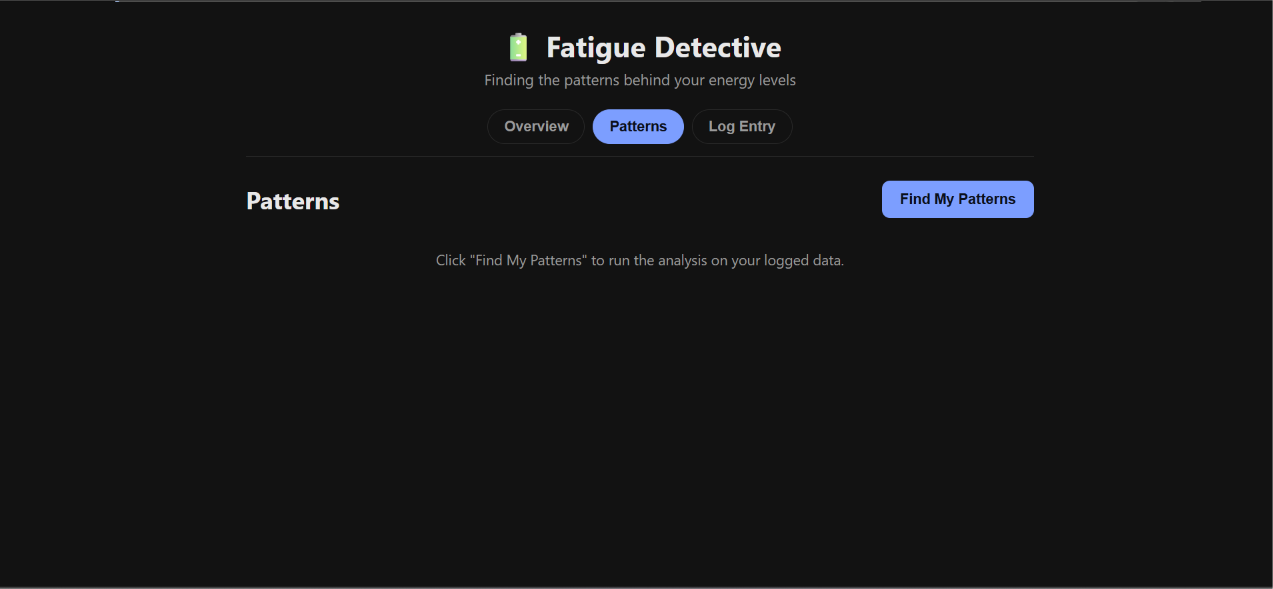
The Patterns tab before analysis — one click runs the full stats-then-LLM pipeline.
-
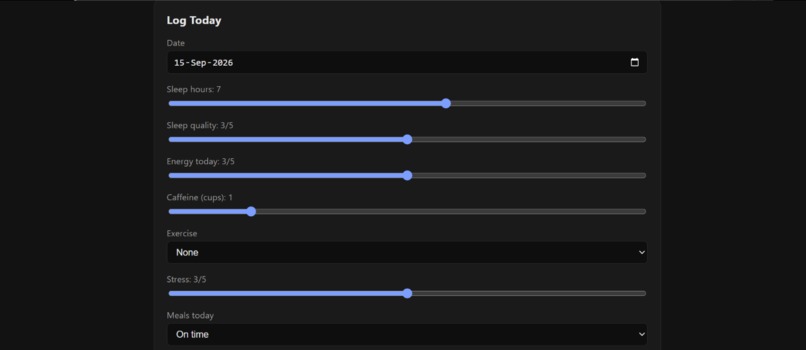
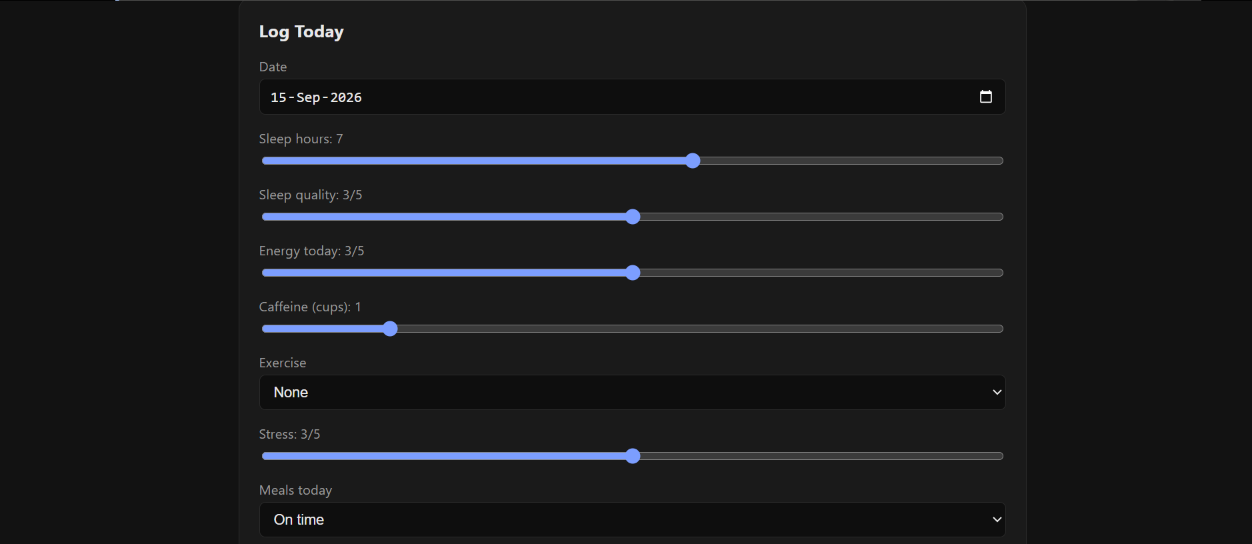
Quick daily logging — under 30 seconds.
-
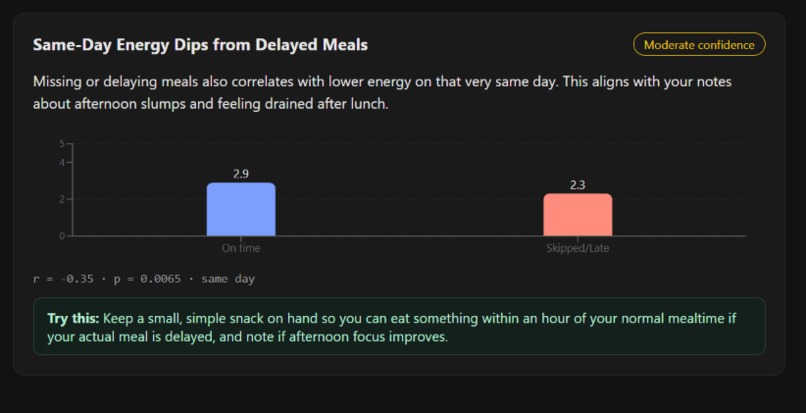
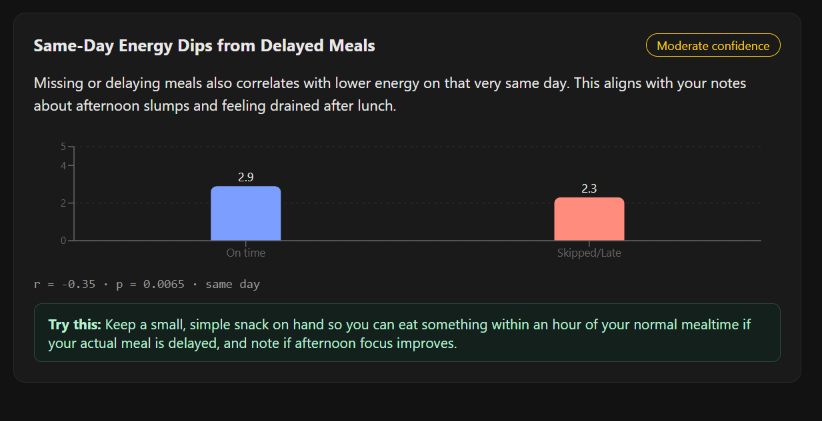
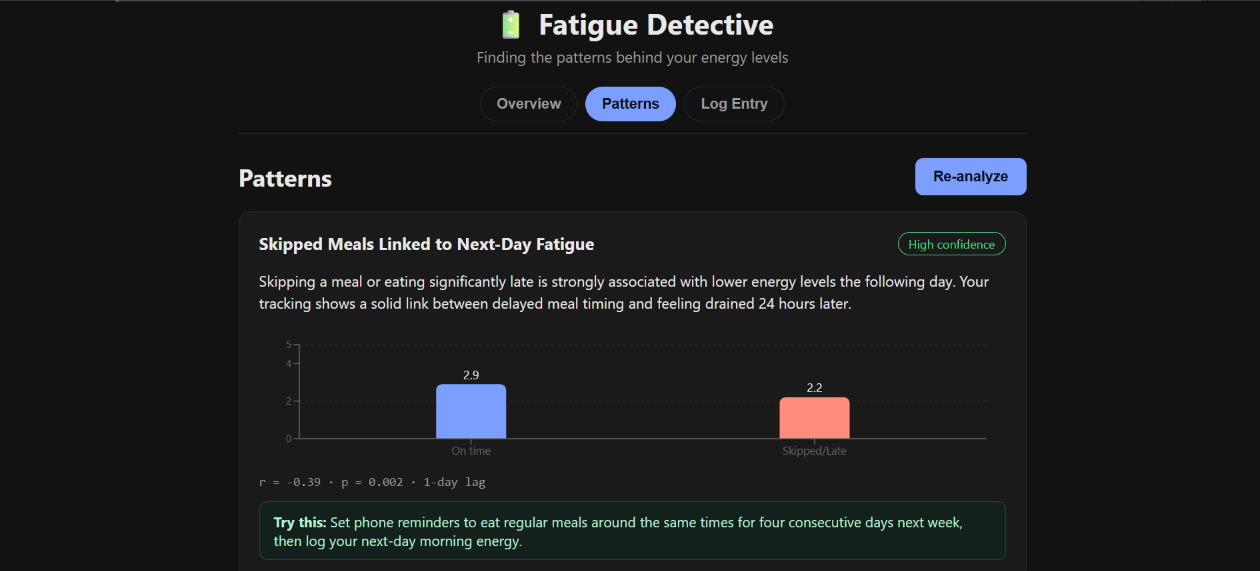
A validated pattern, explained in plain language with real stats shown.
-
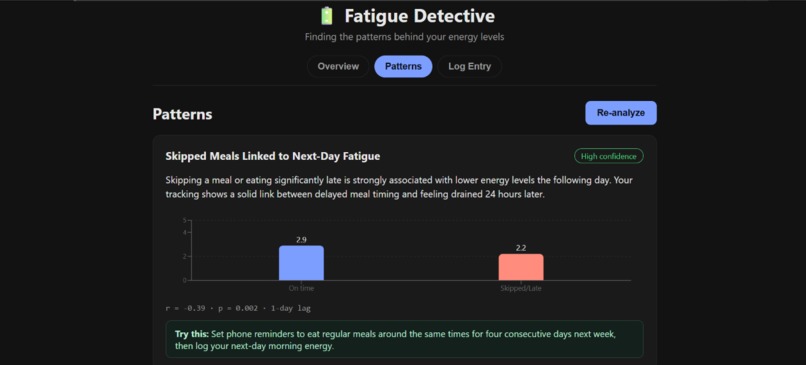
A validated pattern, explained in plain language with real stats shown.
-
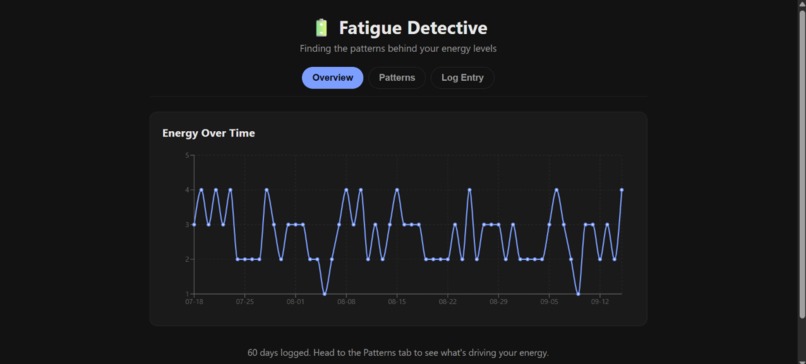
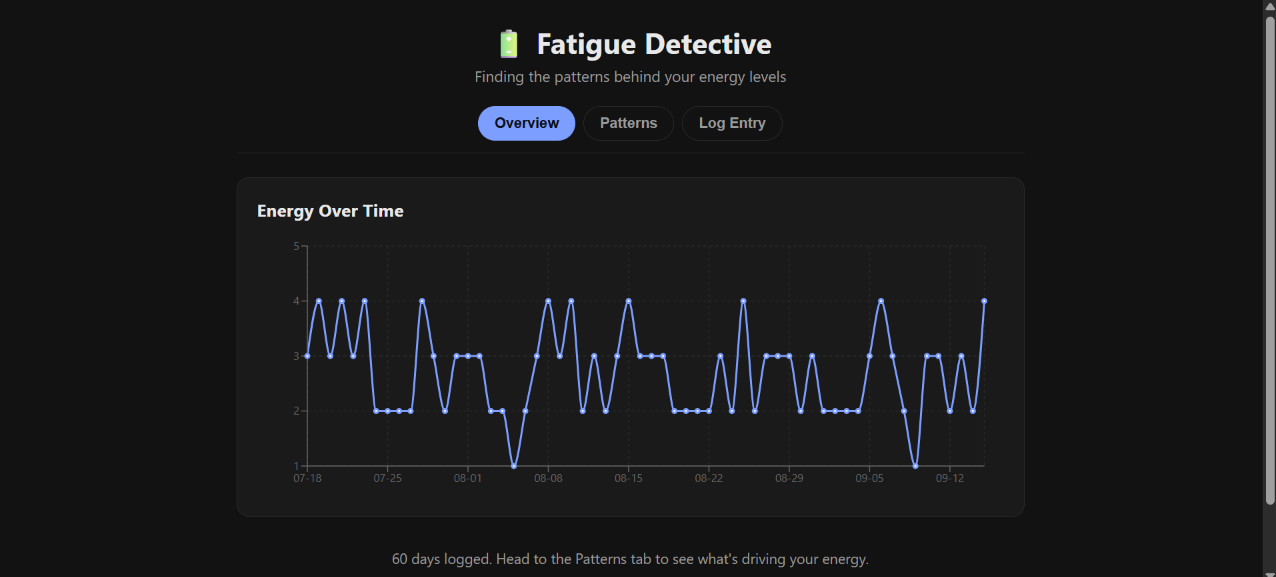
60 days of logged energy levels — the raw data before any analysis.
Inspiration
Chronic fatigue is genuinely hard to self-diagnose. The causes — sleep, diet, stress, screen time — interact in ways that are hard to track mentally, and their effects are often delayed by a day or more. Someone might not connect "skipped lunch on Tuesday" with "exhausted Wednesday morning." Most tracking apps just log data and show it back as a chart — they don't analyze it. And a lot of AI health tools fall into two traps: either they ask an LLM to "eyeball" raw data and guess at patterns (unreliable), or they edge into medical diagnosis territory. We wanted something narrower and more honest: a tool that finds real, statistically defensible behavioral patterns — not diagnoses — and explains them in a way a person can actually act on.
What it does
Fatigue Detective lets you log daily lifestyle data (sleep, energy, stress, caffeine, exercise, meal timing, screen time, optional notes) in under 30 seconds. Behind the scenes, a statistics engine runs lag-correlation analysis across every variable — testing not just same-day relationships, but whether something from yesterday or two days ago predicts today's energy. Only patterns that clear a strict, Bonferroni-corrected significance threshold get passed to an LLM (Google Gemini), which explains what was found in plain language, assigns an honest confidence level, and suggests one small behavioral experiment to test it. It never diagnoses or gives medical advice.
How we built it
Backend: Python, FastAPI, SQLAlchemy, and SQLite for the API and data storage. The statistics engine uses pandas and scipy to run Pearson correlation tests across every variable at multiple time lags (same-day, 1-day, 2-day), then applies a Bonferroni correction to control for the multiple-comparisons problem introduced by testing 21 variable/lag combinations at once. Only statistically validated patterns are passed to Google's Gemini API, which turns them into plain-language explanations with confidence levels and suggested experiments. The frontend is built with React (Vite) and Recharts, with a dedicated chart type for binary variables (a grouped bar comparing group averages) versus continuous ones (scatter plots), so each pattern is visualized in the way that's actually clearest for that data type. Since this is a brand-new tool nobody has used yet, the demo runs on a synthetic 60-day dataset — deliberately built with genuine planted relationships plus realistic noise, and one variable (caffeine) intentionally given zero true effect, so we could verify the system finds real signal and correctly ignores noise.
Challenges we ran into
The biggest challenge was actually a statistics bug we caught ourselves: our deliberately no-effect control variable (caffeine) got flagged as a "moderate" pattern in one test run, purely by chance — a textbook multiple-comparisons false positive, expected when testing 21 variable/lag combinations at an uncorrected significance threshold. We fixed this with a Bonferroni correction and re-verified that genuine patterns still surfaced correctly while the false positive disappeared.
We also hit a string of real-world API issues while integrating Gemini:
Google's newer API keys require a different authentication method
(x-goog-api-key header instead of a URL parameter) than most existing
documentation assumes, the specific model name we started with was retired
mid-development, and a university-managed Google account turned out to be
blocked from the API entirely by school admin policy — resolved by using a
personal account instead. Each of these took real debugging to isolate,
since the error messages didn't always point directly at the root cause.
Accomplishments that we're proud of
Catching and properly fixing the multiple-comparisons statistical error before it could mislead a user is the accomplishment we're most proud of — it would have been easy to ship the uncorrected version and never notice. We're also glad the core architectural decision held up end-to-end: keeping the LLM strictly downstream of validated statistics, rather than asking it to find patterns itself, meant every insight the app produces is backed by a real, checkable number, not just a plausible-sounding AI response.
What we learned
Building a genuinely trustworthy AI feature often means giving the AI less responsibility, not more — letting real statistics do the pattern-finding and reserving the LLM for explanation and communication produced a more defensible, more honest tool than asking an LLM to do everything. We also learned a lot about how quickly production APIs shift underneath you (auth methods, model names) and the importance of designing error handling that surfaces the real problem instead of a generic failure.
What's next for Fatigue Detective
Validating the statistical approach against a real public longitudinal dataset (e.g. PMData), adding user accounts for multi-user support, adding logging reminders, and extending the same pattern-detection approach beyond fatigue to other self-trackable areas like mood or focus.
Built With
- fastapi
- gemini-api
- javascript
- pandas
- python
- react
- recharts
- scipy
- sqlalchemy
- sqlite
- vite

Log in or sign up for Devpost to join the conversation.