-
-
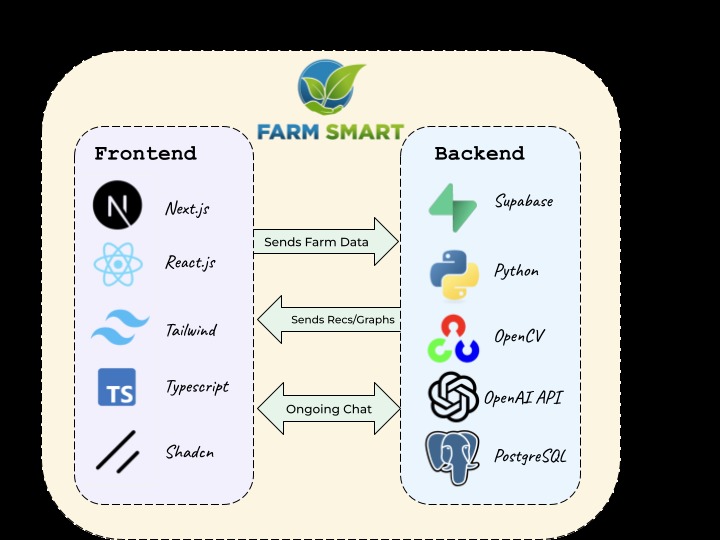
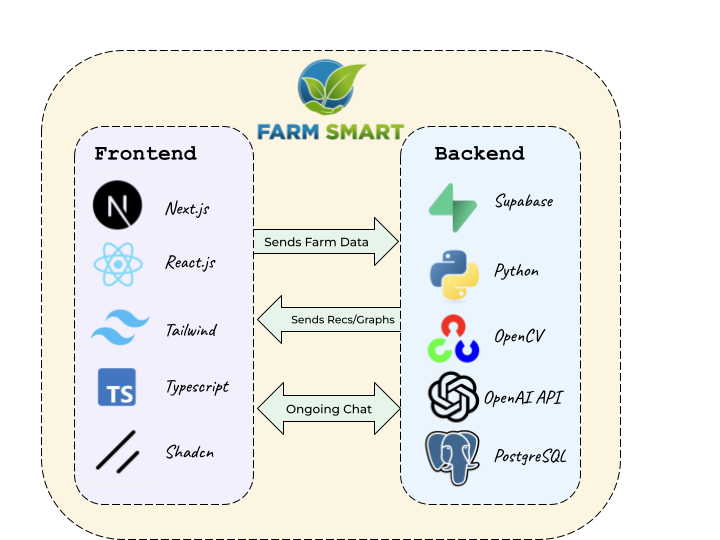
Our tech stack
Inspiration
Inspired by AGCO's prompt, we decided to create a chatbot that provides data-driven insights to all things farm related. Specifically, our project provides a full cost-analysis for farmers who are looking to till their fields and need advice on the process.
What it does
FarmSmart will initially ask for the name of the farm that you are working on to have a better understanding of the surrounding environment. The options are between The North Dakota Row Crop Farm, The Illinois Row Crop Farm, or anywhere else. Depending on the location, FarmSmart will find the best possible tools to use at this area by factoring in your budget, operational costs, total area, and the environmental factors around you. We will then output a full cost analysis in the form of graphs and charts. Additionally, we have implemented pesticide detection features where farmers can upload images of their wilting crops to our model and we identify potential causes and solutions.
How we built it
First, we utilized a web-soil API in which we were able to extract information on farmlands across the nation. Using data from sources like USDA’s Web Soil Survey and satellite imagery, we analyzed the important soil properties such as moisture levels, compaction, erosion risk, and nutrient content. This data was fed into our backend (Python, PostgreSQL, and OpenCV), where we processed it alongside weather data and equipment availability. The OpenAI API then used this data to generate custom tillage recommendations that optimize cost, efficiency, and soil health. We then displayed our results in the frontend through (React, Next.js, Typescript, Tailwind, and Shadcn) in the form of text and bar/graph charts.
Challenges we ran into
Our most significant challenge was tailoring FarmSmart towards specific farms that the user inputted. Finding soil data initially posed as an issue for us as not all APIs provided wide regions of soil data. To fix this, we parsed through government records until we found an API service that gave us the necessary data.
Accomplishments that we're proud of
The accomplishment that we're most proud of is the rendering of our charts on our website. We are able to provide visual data to our users which is extremely important to do. If someone is looking to simplify their numbers into a visual that they can seamlessly understand, our chart is the perfect tool for them.
What we learned
We learned a lot more about the Tillage Process from this project. During the duration of this hackathon, we had the opportunity to explore different farming techniques and understand more about when each tool is applicable.
What's next for FarmSmart
We plan on making FarmSmart more accessible to the rest of the world. This will be done by training or models on globally related data so that it will be able to identify more diseases and function in more languages.
Built With
- next.js
- openai
- opencv
- postgresql
- python
- react.js
- shadcn
- supabase
- tailwind
- typescript


Log in or sign up for Devpost to join the conversation.