-
-
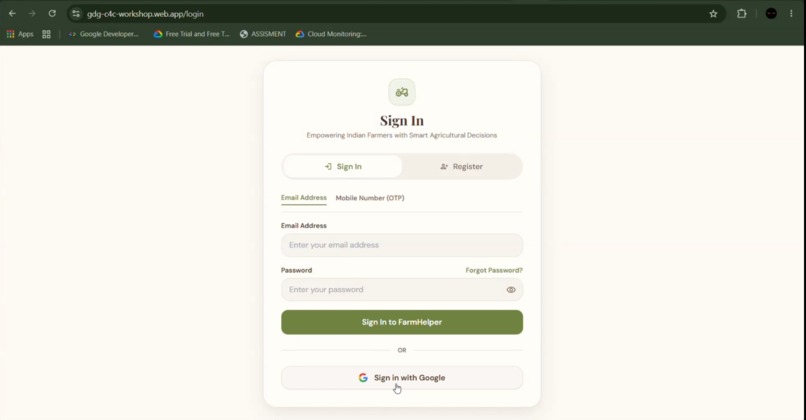
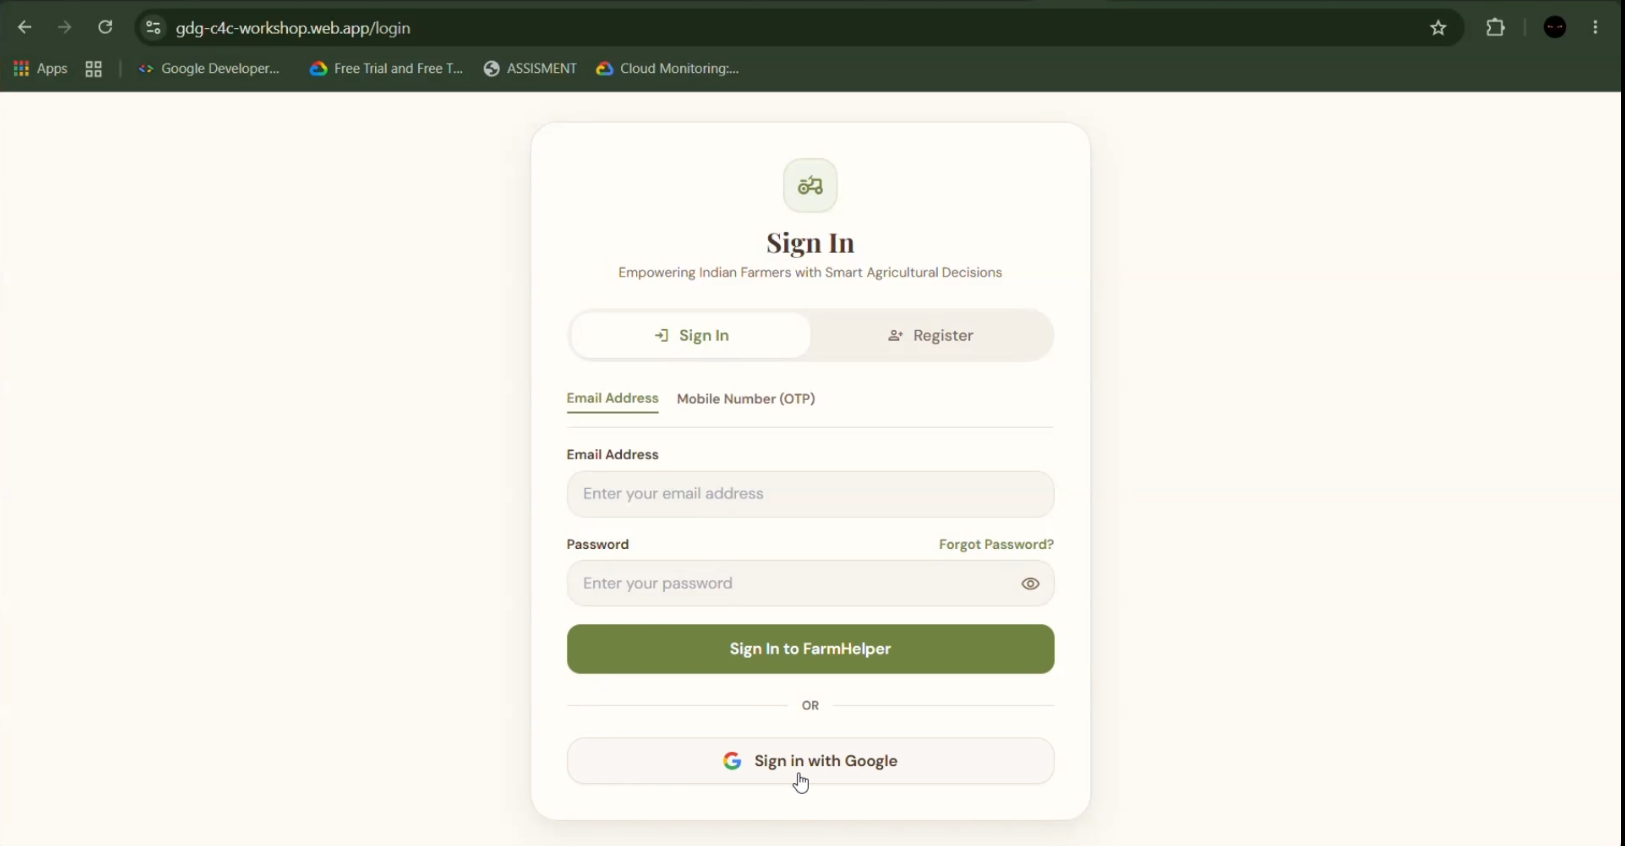
Sign-In Portal: Authentication screen supporting Email, Mobile OTP, and Google Sign-In options.
-
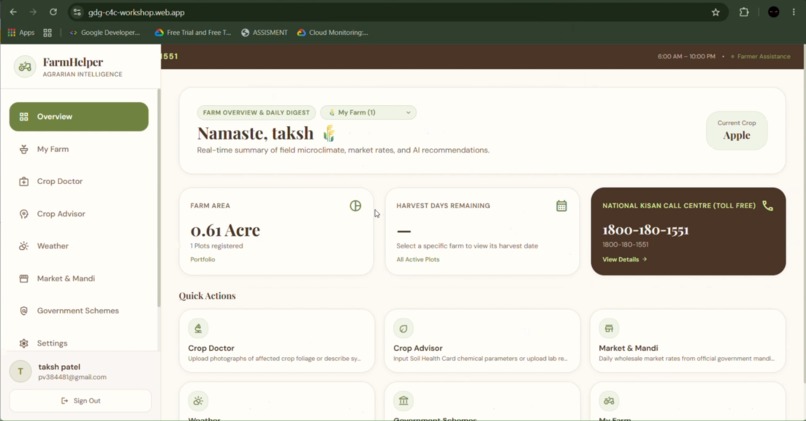
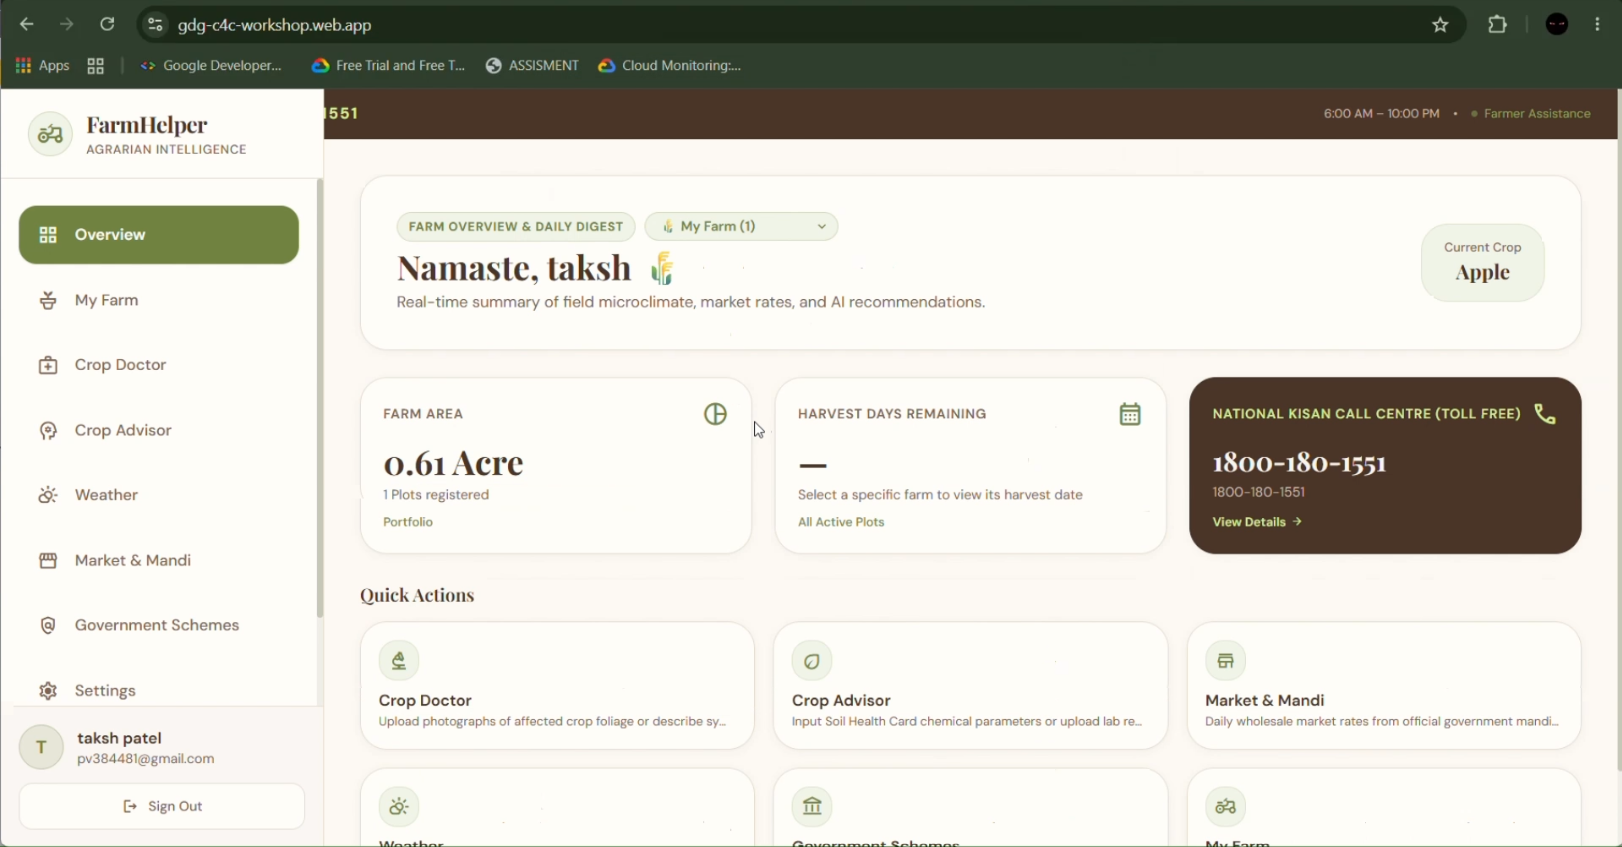
Main Dashboard: Overview displaying total acreage, harvest countdown, support contacts, and quick action cards.
-
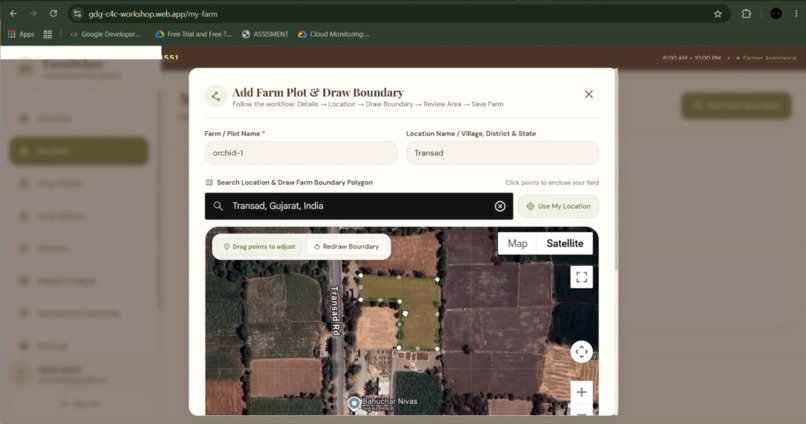
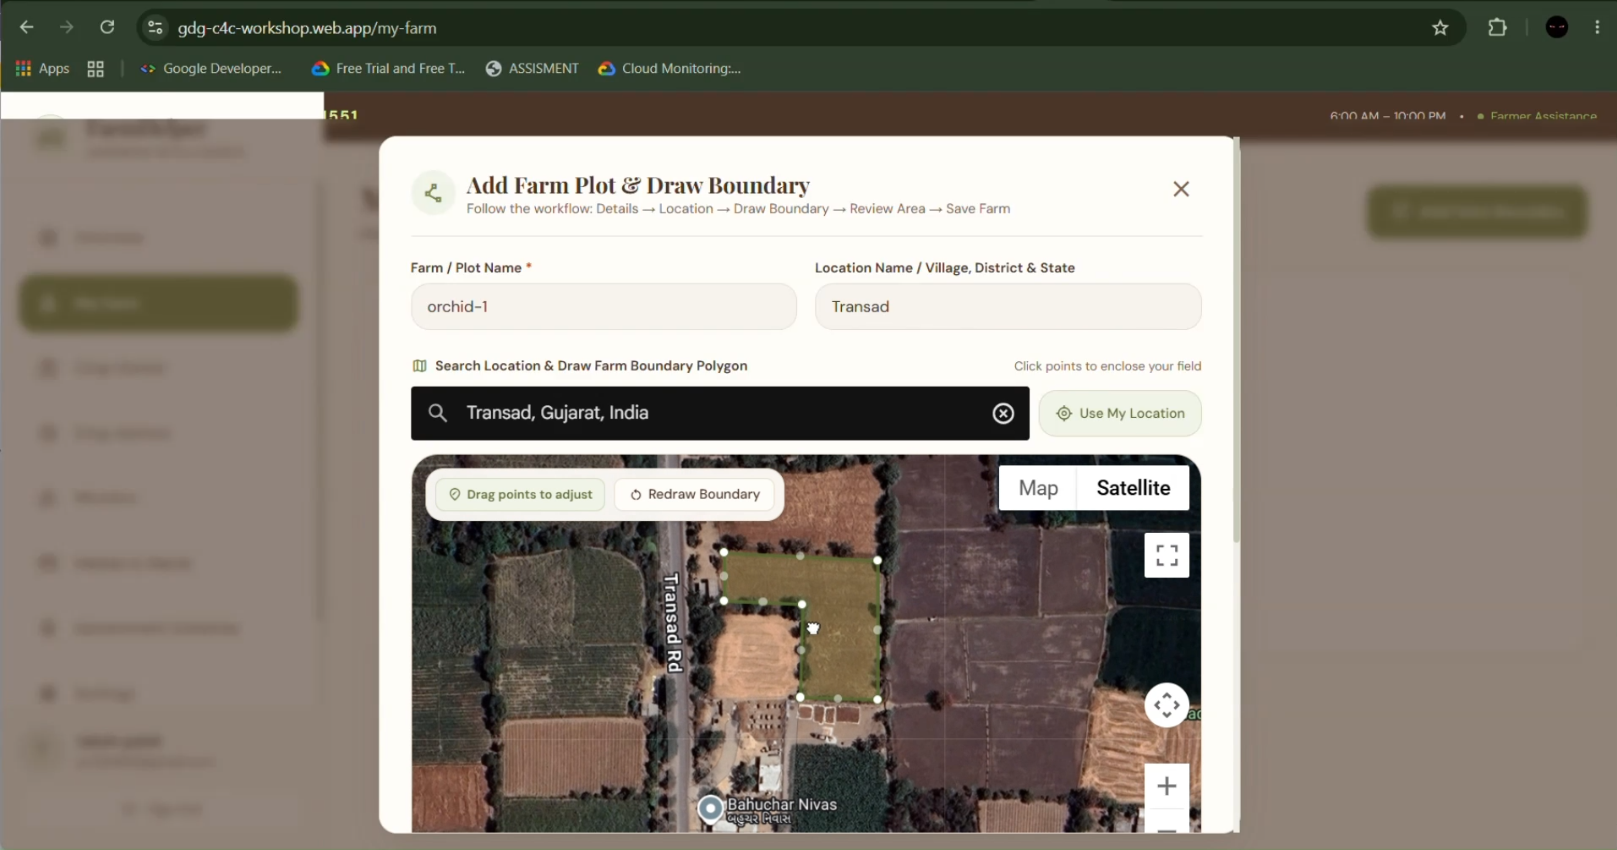
Geofencing & Mapping: Interactive Google Maps interface to locate fields and draw precise polygon boundaries.
-
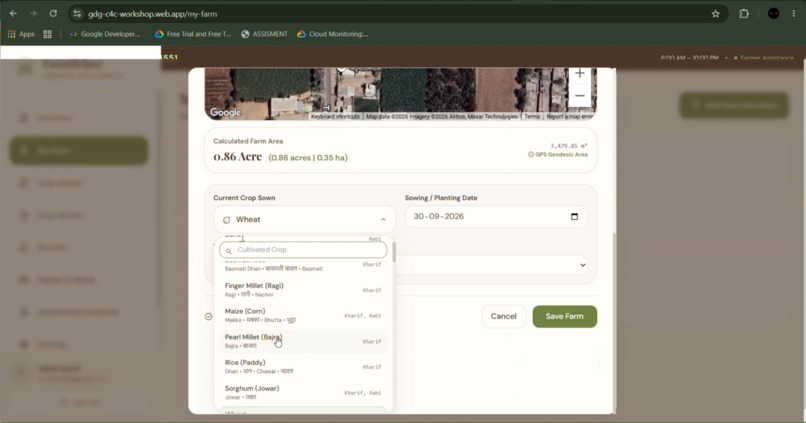
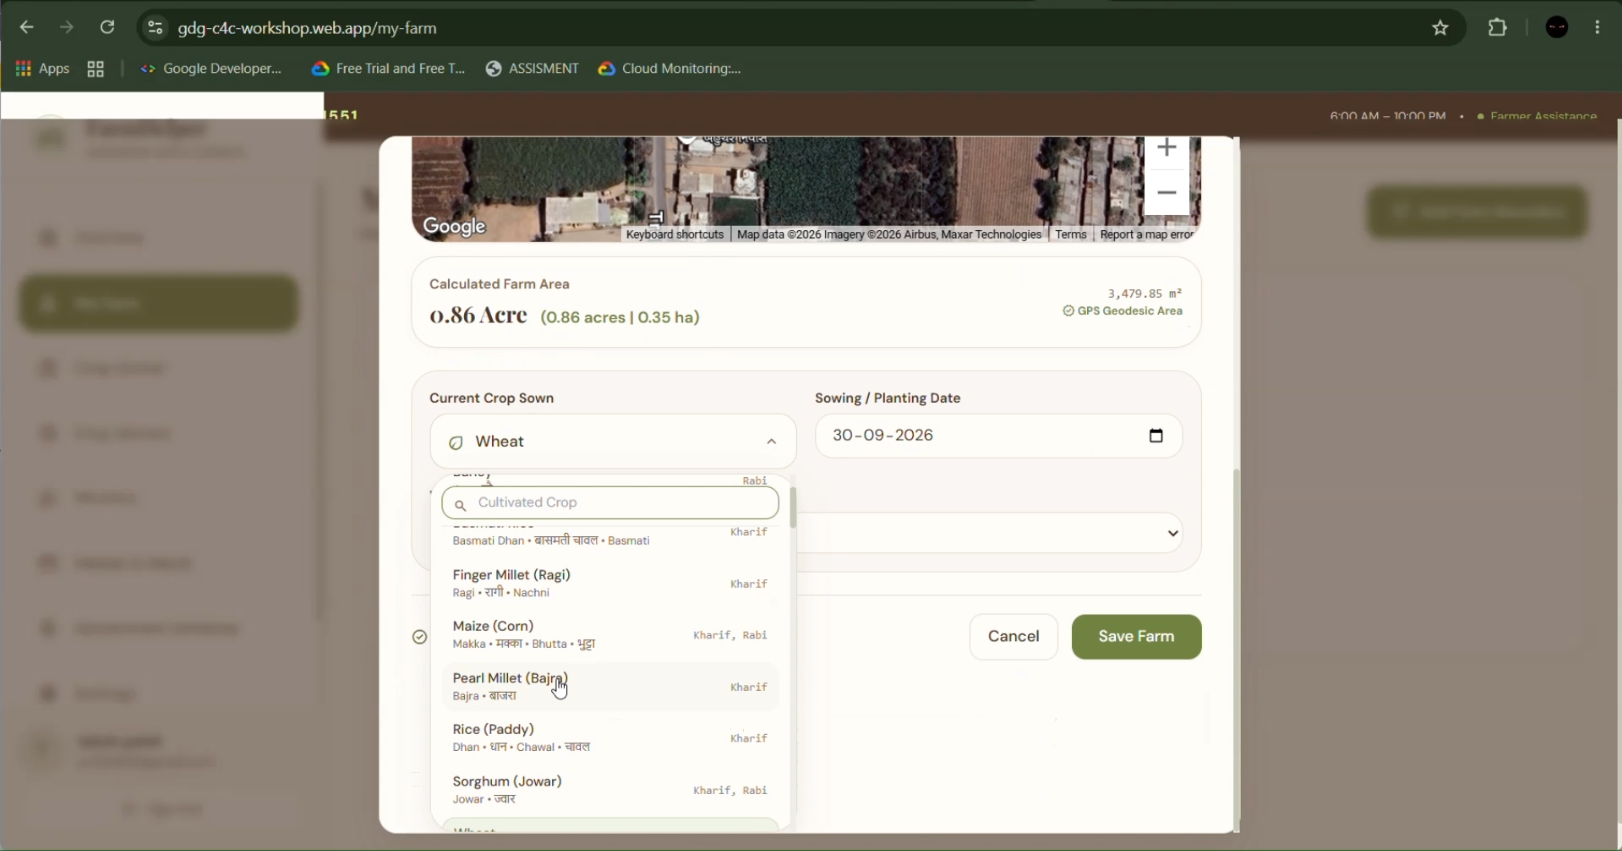
Plot Details Form: Configuration view calculating plot area and tracking crop selection and sowing dates.
-
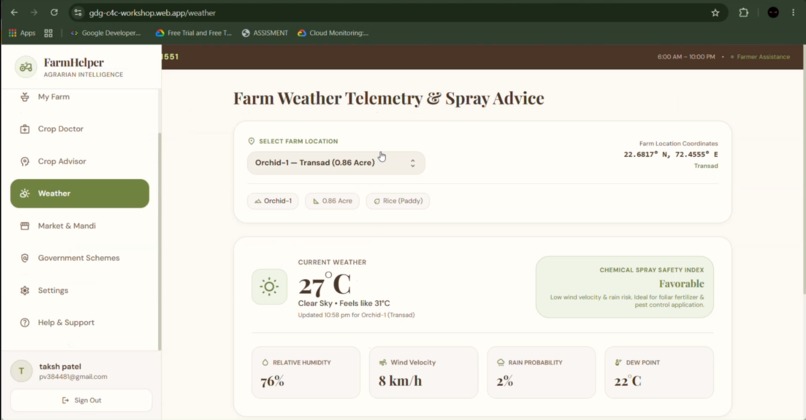
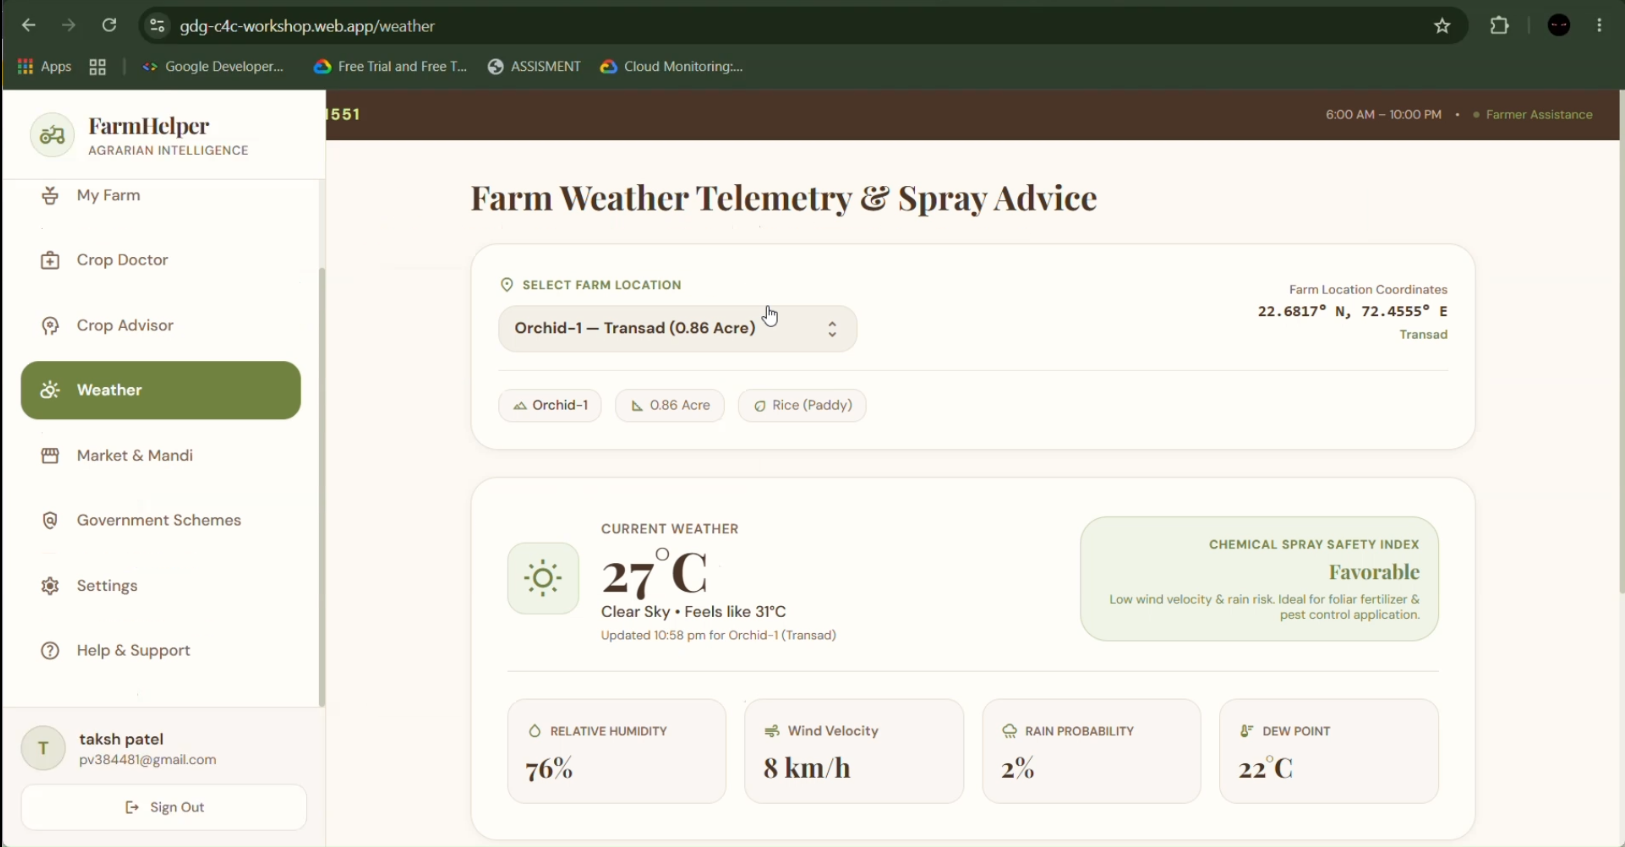
Weather & Spray Advisory: Real-time microclimate metrics featuring a Chemical Spray Safety Index for farm planning.
-
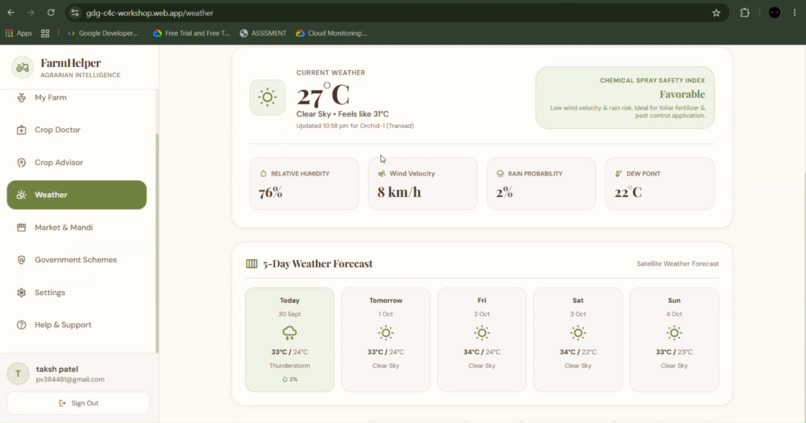
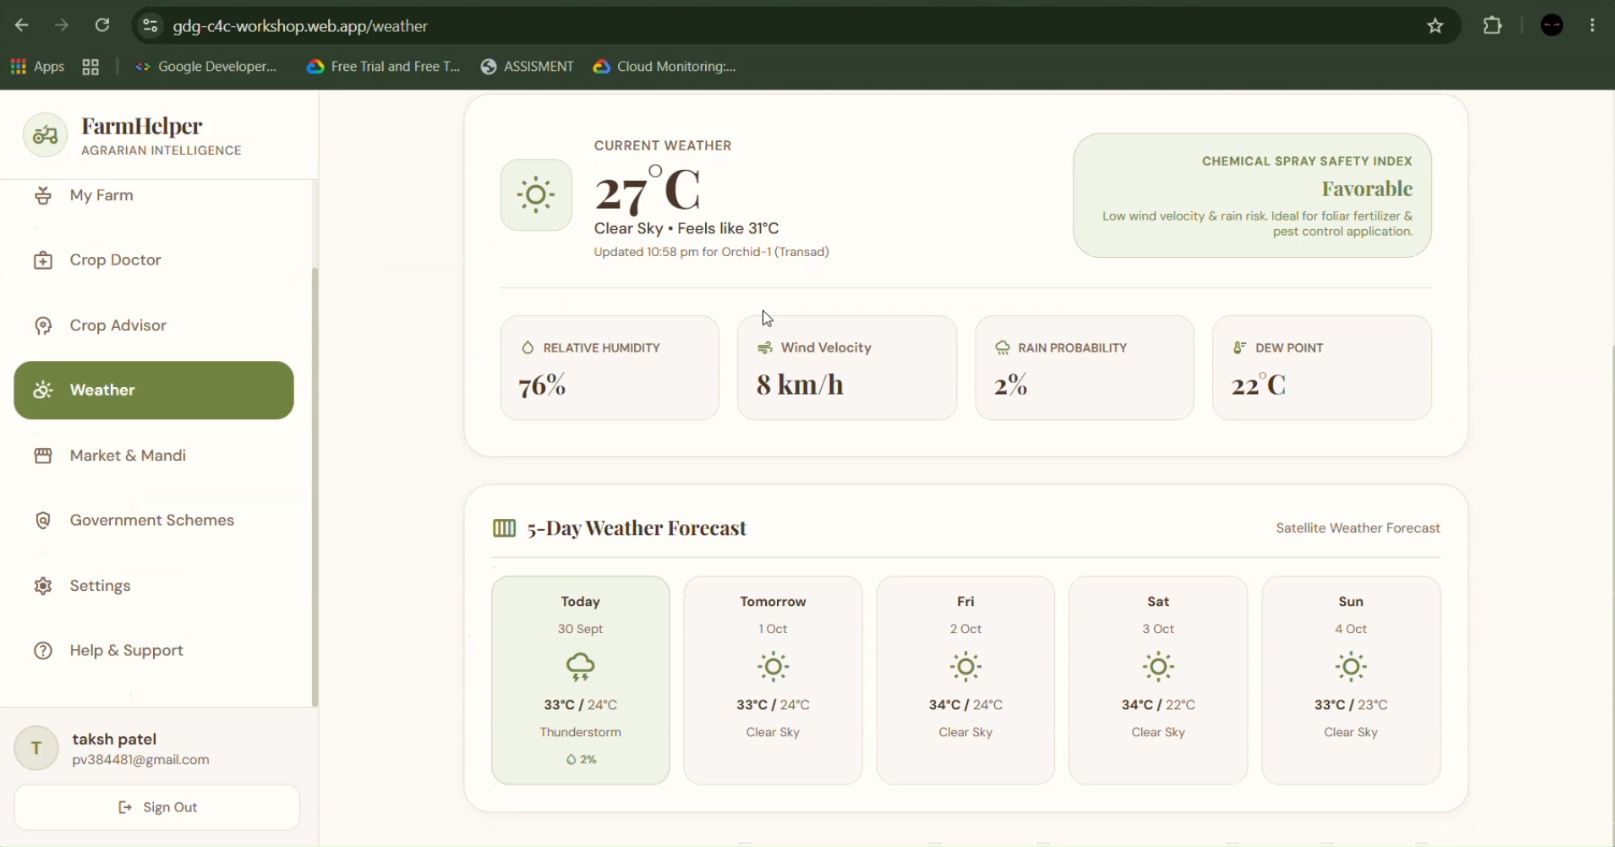
5-Day Weather Forecast: Detailed daily temperature forecasts and atmospheric predictions tailored to the farm.
-
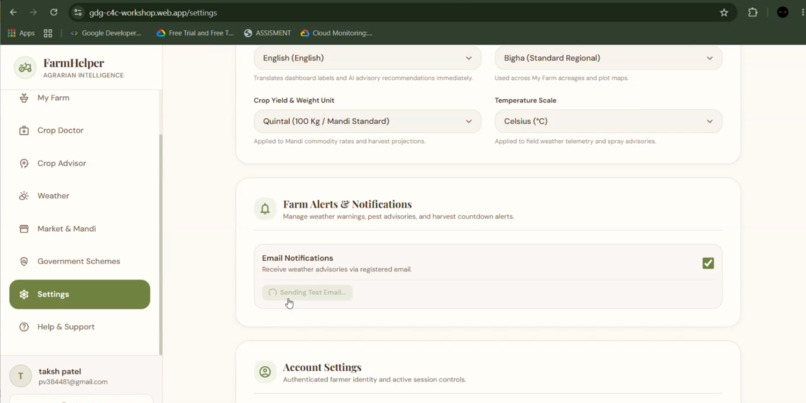
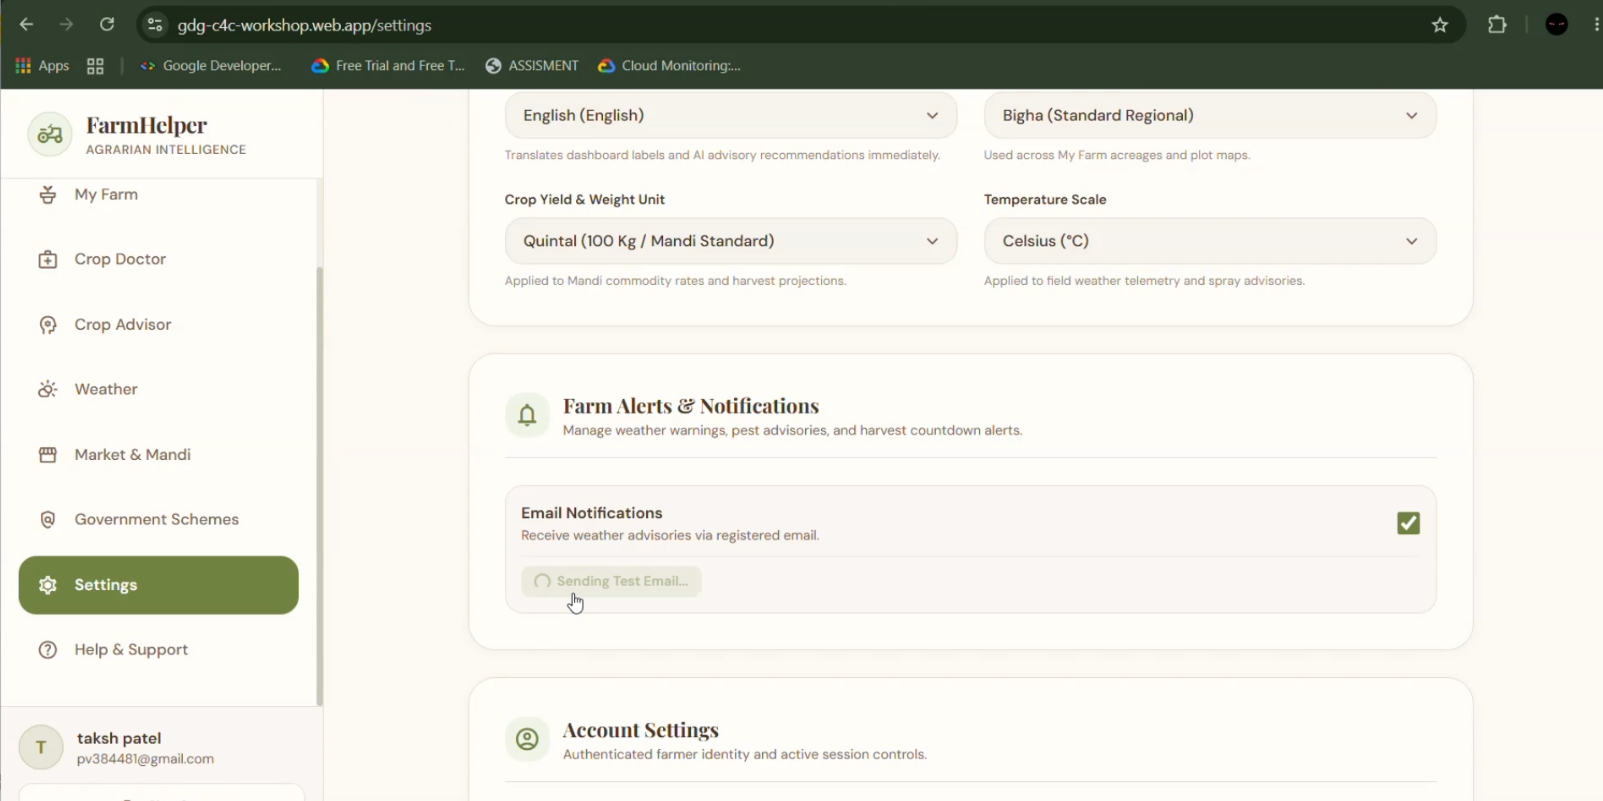
Alerts & Notification Settings: Configuration panel for automated email advisories, weather warnings, and crop alerts.
-
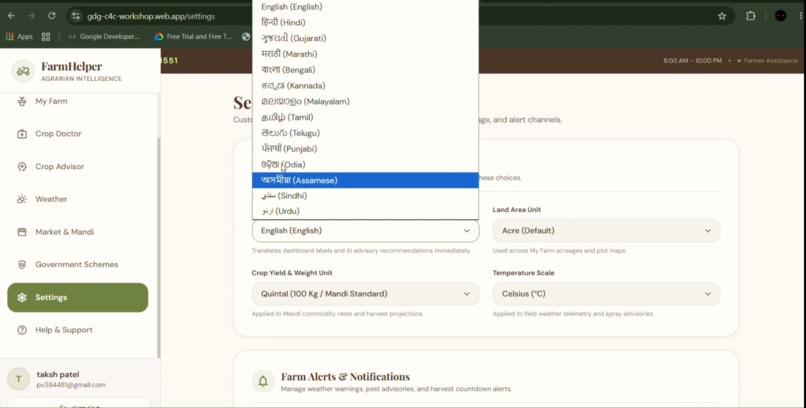
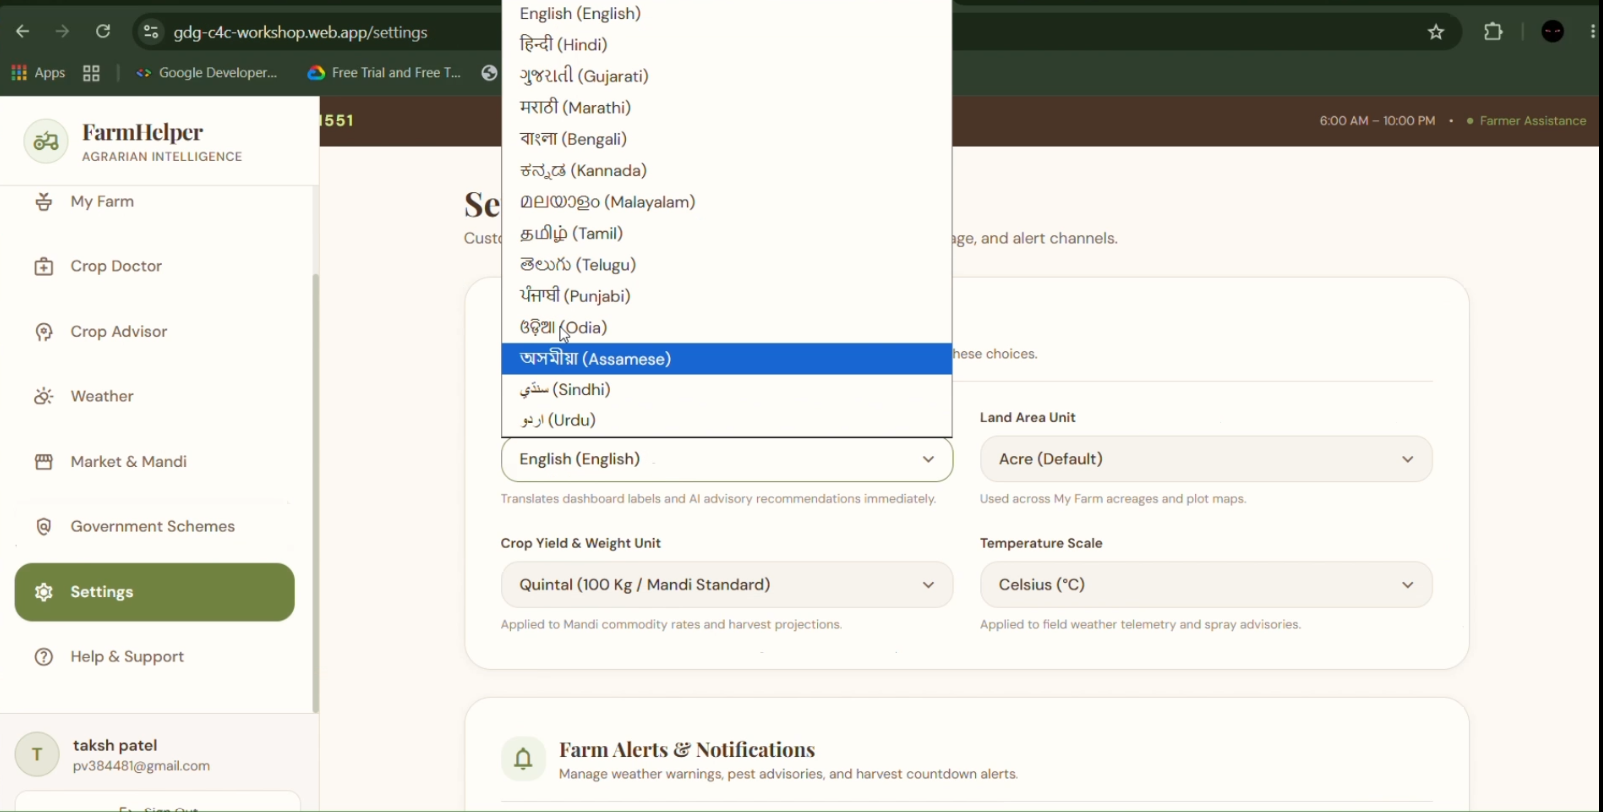
Language Localization: Regional language selection menu supporting major Indian languages for accessible navigation.
-
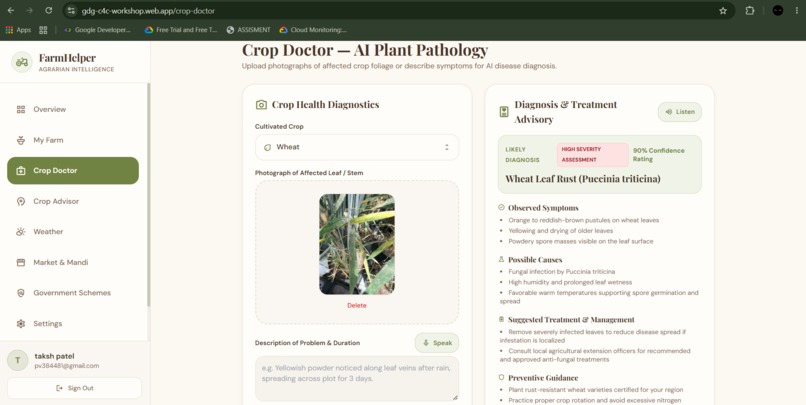
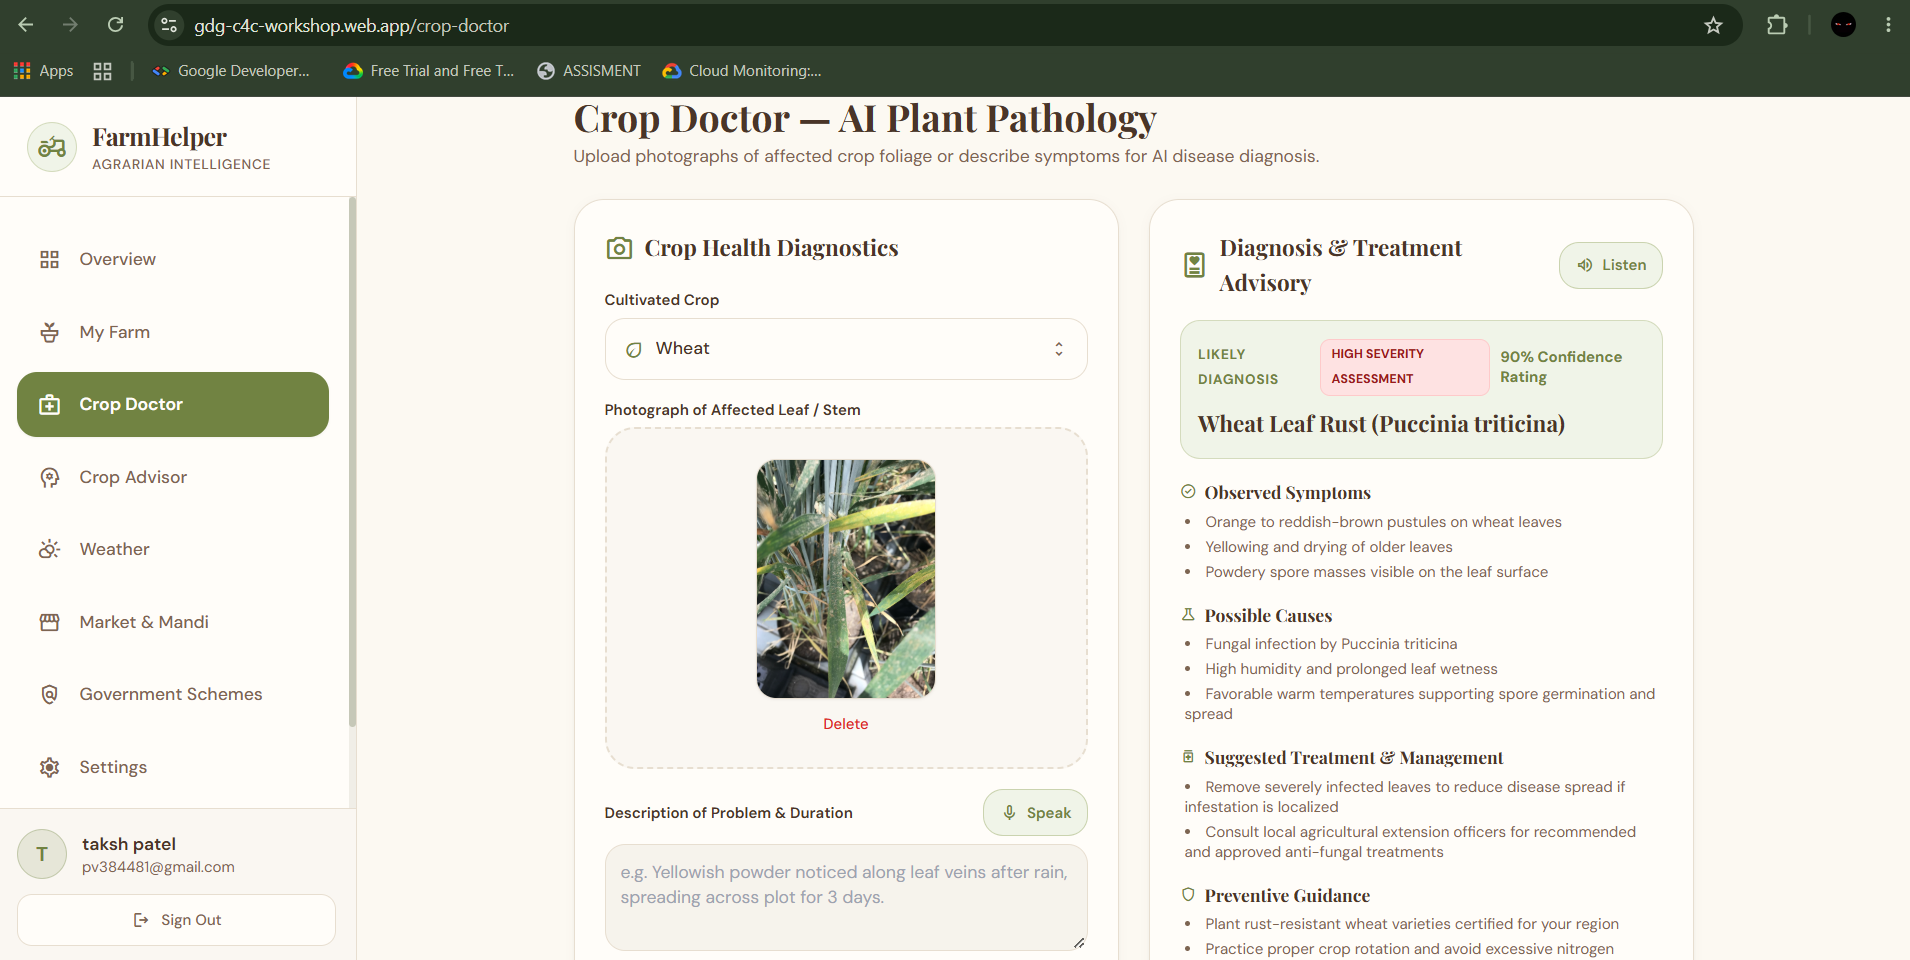
AI Crop Doctor: Interface presenting automated plant disease diagnosis, severity assessment, and treatment advisory.
-
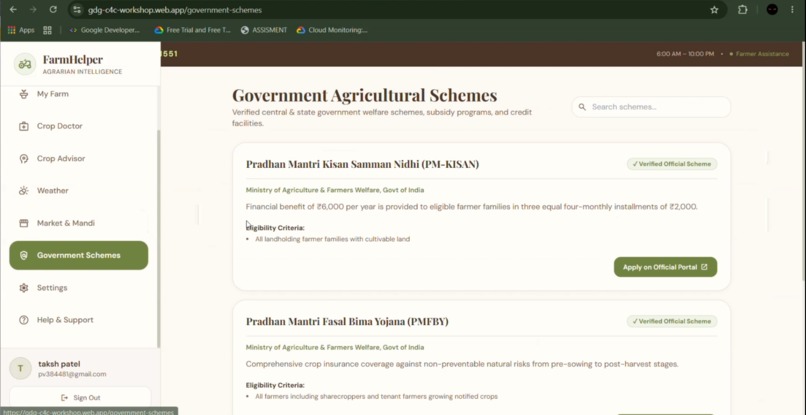
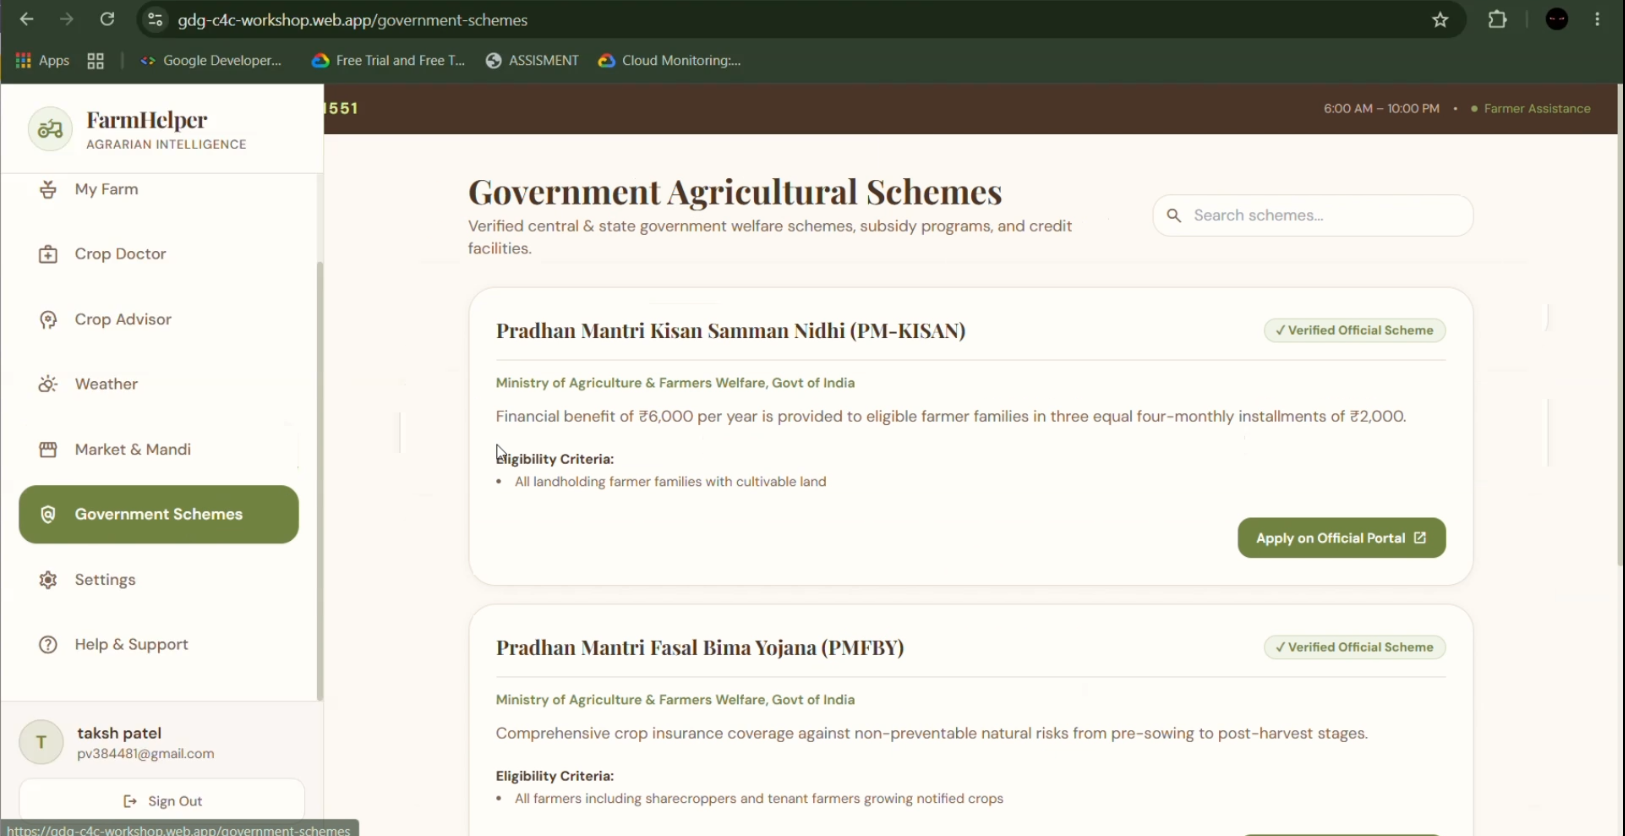
Government Schemes Hub: Curated catalog of official agricultural welfare schemes, eligibility rules, and portal links.
-
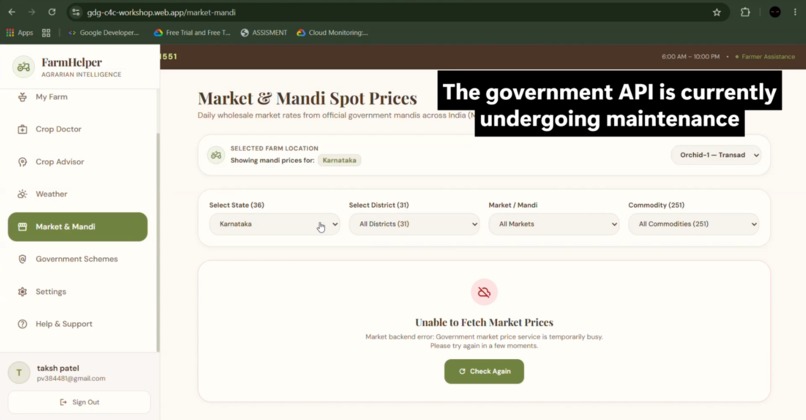
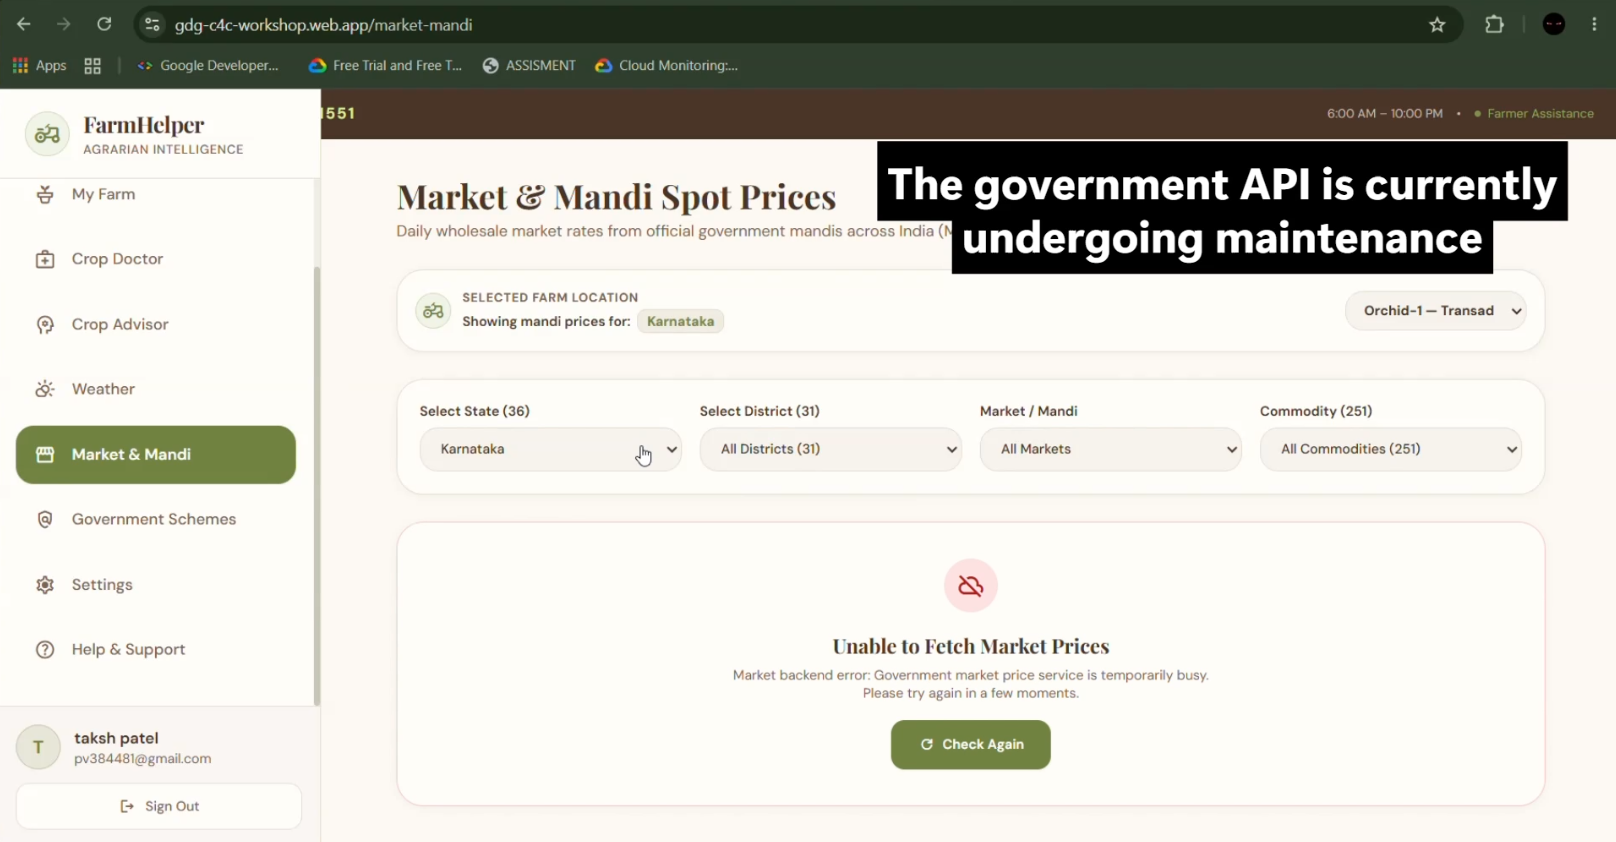
Market & Mandi Prices: Price portal with state/district filters and built-in error handling for API maintenance.
-
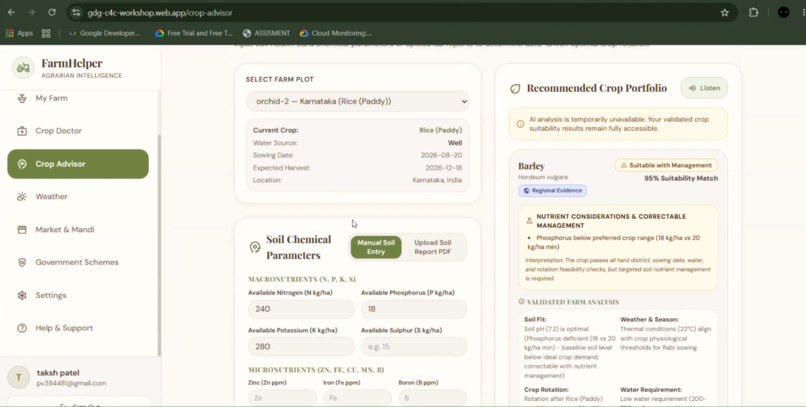
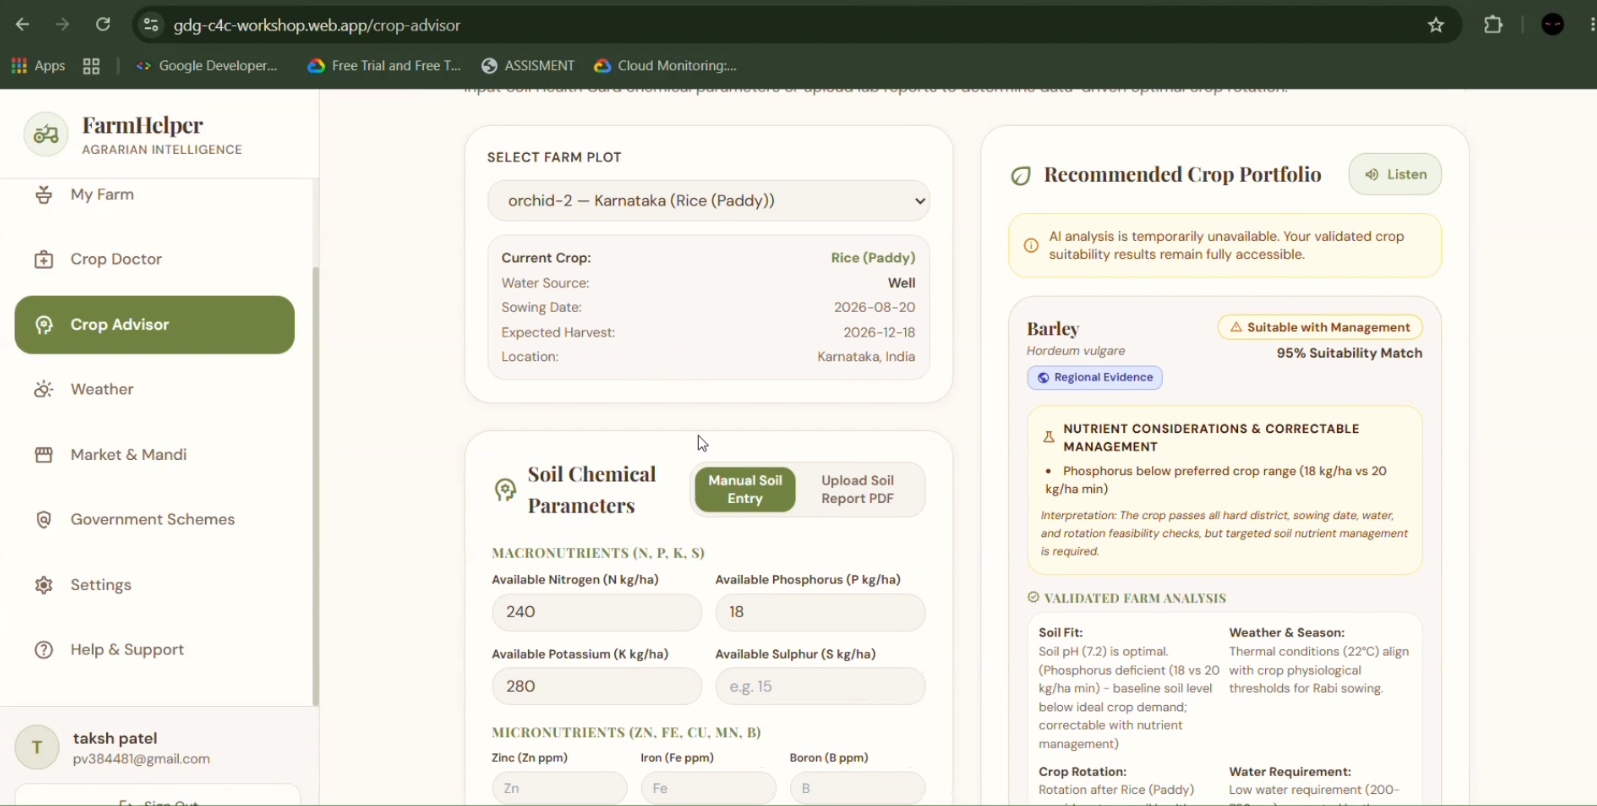
AI Crop Advisor: Soil NPK parameter analysis pairing land conditions with AI-recommended crops and match percentages.
Inspiration
Most of the 140 million farmers in India still lack quick access to agronomists, transparent market rates, or reliable local weather forecasts. We wanted to build something practical that puts real-time guidance directly onto a farmer’s phone—without confusing menus, heavy jargon, or steep learning curves.
FarmHelper was built to centralize AI-assisted agronomy, satellite mapping, and government data into a single, straightforward dashboard designed specifically for low digital familiarity.
What it does
FarmHelper acts as a personal digital assistant for daily farm operations:
🩺 Crop Doctor: Farmers can upload a photo of an infected leaf or type out symptoms. Gemini AI analyzes the image to identify the disease, explain why it happened, and suggest actionable treatments.
🌱 Crop Advisor: Farmers input their soil test results (or upload a soil card), and the system recommends the most suitable crops for their land along with a compatibility match score.
📈 Mandi & Market Prices: Live commodity price tracking that lets users filter wholesale rates across states, districts, and specific crops.
☁️ Live Weather: Location-specific forecasts tied to the farm's exact coordinates, featuring a "Chemical Spray Safety Index" to help time pesticide and fertilizer application.
🏛️ Government Schemes: A curated hub of central and state welfare programs (like PM-KISAN) with clear eligibility breakdowns and direct links to official portals.
🗺️ My Farm: An interactive map powered by Google Maps where farmers can draw polygon boundaries around their fields, track total acreage, and monitor harvest timelines.
How I built it
Frontend: Built with React 19, TypeScript, Vite, and Tailwind CSS to keep the UI snappy, responsive, and lightweight on low-end mobile hardware.
Backend & Auth: Powered by Firebase Cloud Functions (Node.js) for API endpoints, Firestore for real-time state management, and Firebase Auth supporting Email, Mobile OTP, and Google sign-in.
AI Engine: Integrated the Google Gemini API to handle visual disease diagnosis from uploaded plant photos and process soil chemistry data for crop suggestions.
Mapping: Embedded the Google Maps JS API to let farmers draw, calculate, and save precise field boundaries directly over satellite imagery.
Challenges I ran into
Handling Unreliable External APIs: Fetching live market prices proved tricky because government endpoints frequently experience high latency or go down for maintenance. We had to rethink our backend architecture to handle timeouts gracefully.
Tuning AI Visual Output: Getting consistent, structured JSON responses from Gemini for plant pathology took significant prompt iteration, especially when dealing with poor lighting or blurry leaf photos.
Designing for Accessibility: Balancing advanced features (like satellite geofencing) with a simple, uncluttered interface meant constantly paring back UI elements so first-time smartphone users wouldn't feel overwhelmed.
Accomplishments that I proud of
Successfully building an end-to-end multimodal pipeline that turns a quick leaf photo into a full diagnostic report with treatment steps in just a few seconds.
Implementing full regional settings—allowing users to switch language preferences and toggle land units to local measurements like Bigha.
What I learned
Hands-on experience structuring multimodal prompts for domain-specific vision tasks using Gemini.
Best practices for serverless backend design, state persistence with Firestore, and handling fallback logic in React 19.
What's next for FarmHelper
Voice Interactions: Adding voice input and text-to-speech in regional languages (Hindi, Gujarati, Marathi, etc.) so typing isn't a barrier.
Offline Caching: Storing critical weather data and farm plots locally so key features remain accessible in areas with weak internet.
IoT Hardware Sync: Connecting low-cost soil moisture and weather sensors to automate data logging directly into the dashboard.
Worldwide - currently FarmHelper is for India I am trying to make it worldwide
Built With
- agriculture
- agtech
- artificial-intelligence
- css3
- firebase
- firebase-auth
- firebase-cloud-functions
- firebase-hosting
- firestore
- full-stack
- gemini-ai
- google-gemini-api
- google-maps
- html5
- javascript
- machine-learning
- node.js
- react
- rest-api
- social-good
- tailwind-css
- typescript
- vite


Log in or sign up for Devpost to join the conversation.