-
-
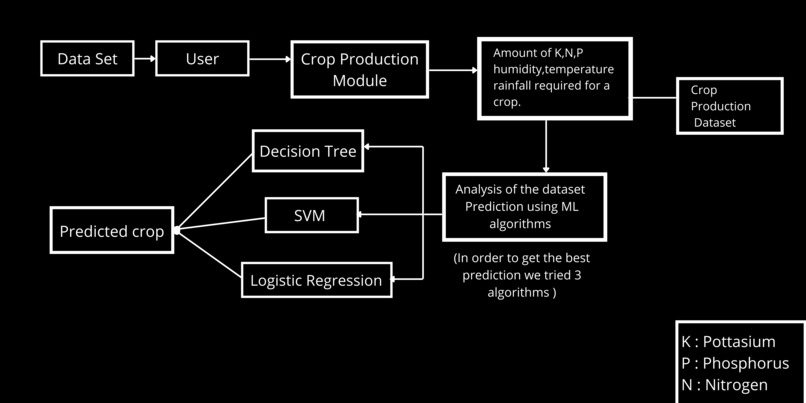
Flow chart
-

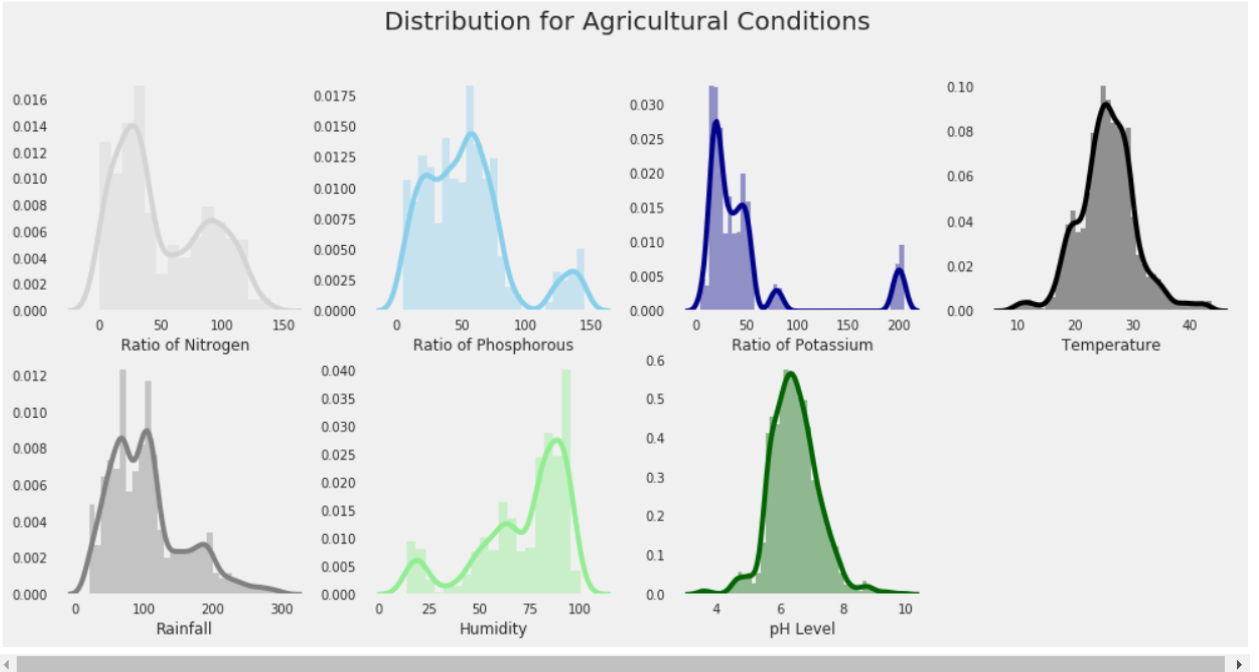
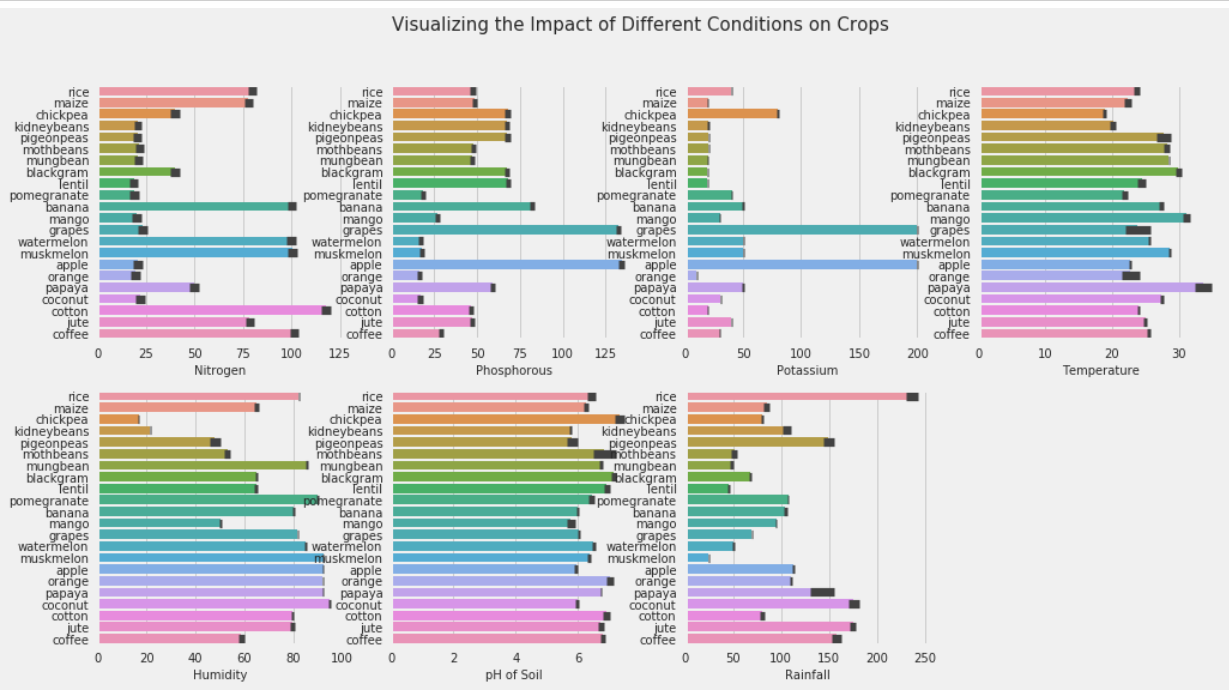
Distribution for agriculture conditions
-
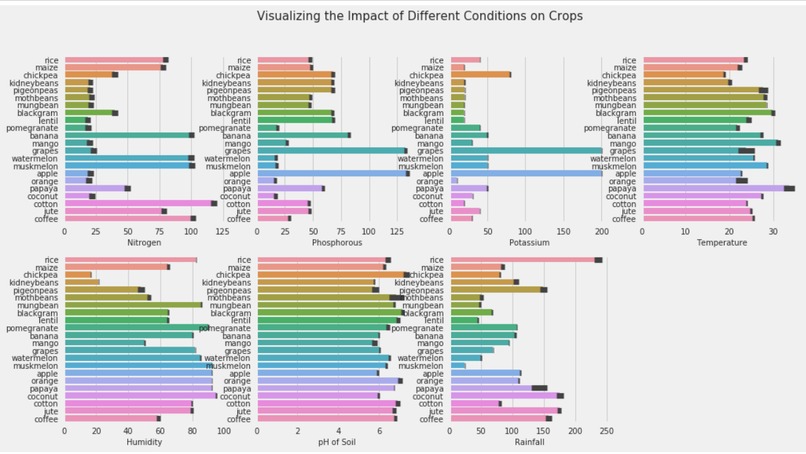
Impact of different condition on crop
-
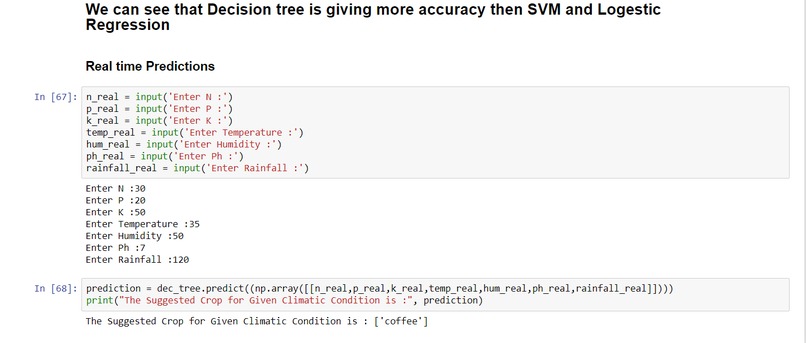
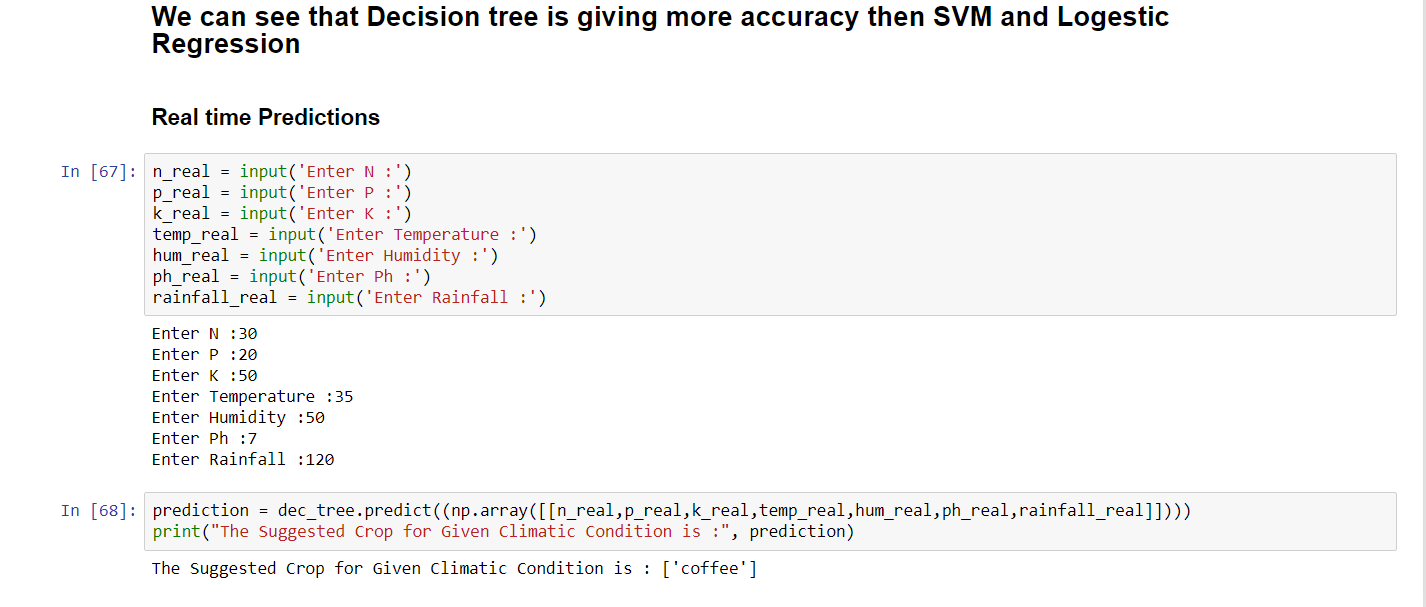
Prediction

Inspiration
Thousands of farmers are losing their lives to debts because they are not able to produce as much as before. Uneven rainfall, chemical imbalance in the soil contributes mainly to the decrease in yield. Thus our problem statement was developed.
What it does
We have gathered a dataset built by augmenting datasets of rainfall, climate, and fertilizer data available from Github. This will give us a better idea of the trends of crops considering different environmental and geographical factors.
How we built it
Applied descriptive statistics visualization and predictive modeling has been applied to identify the crops that can be grown at a stipulated temperature and other natural conditions.
Challenges we ran into
It was quite difficult to get the real-time data as all the API's were paid. We were not able to efficiently put deep learning into use. Hence we have to go ahead with machine learning algorithms.
Accomplishments that we're proud of
Using IBM Z tool for the first time, was an amazing experience to use that tool. Analyzing the crop patterns and clustering them using various algorithms enabled us to understand various trends in the crops and efficiently do mixed cropping and crop rotation
What we learned
It was the first time we used tree plotting, hard clustering for analyzing data. We learnt various techniques of analyzing data efficiently and effectively.
What's next for Farmer's Friend: Optimizing Agriculture Production
In the future, we plan to deploy the project as an app to be able to extend a helping hand to farmers.
Built With
- data-visualization
- datanalysis
- eda
- ibm
- ibmz
- ibmztool
- jupyter
- jupyter-notebook
- machine-learning
- matplotlib
- python
- shootingstar
- sklearn


Log in or sign up for Devpost to join the conversation.