-
Overall View

Farmer's Shed
Inspiration
Farmers are the most important people in society. They grow the food that ends up in the grocery stores that we eat. Now, there are many farming corporations. However, there are still many local farmers, many in Illinois and near Chicago. Whether it be mid-size farmers or people farming in their backyard, you are a farmer if you grow food to feed someone. Many things go into being a farmer, and there are many different places to get that information. So, to make that easier for everyone, we were inspired to create a simple and easy-to-use dashboard for any farmers who don't have the resources or time to track all those things themselves.
What it does
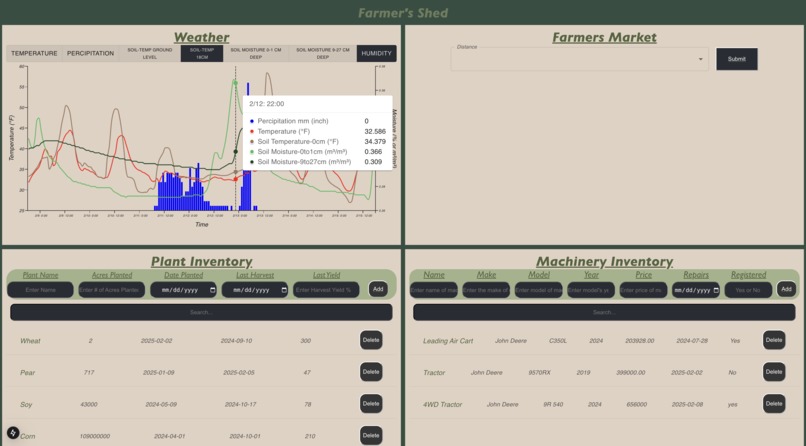
The dashboard is split in between 4 sections. Each section has its own corner.
Weather
The first corner, in the top left, is a weather widget. It graphs the 7-day forecasts for various different data points. It includes temperature, precipitation, soil temperature at different depths, soil moisture at different depths, and humidity in the air. The graphs are toggleable, so the farmers can choose whatt to see, and they dynamically resize the axis based on the data shown graphs they wan.
Markets Nearby
The second corner, in the top right, is a tool for them to see what farmer's markets are near them and who is going there. This allows farmers to build their network and find more places where they can sell their produce. They can filter based on the radius of how far they want to travel and they will be provided a list of the markets near them. This includes the name, the location, and 2 possible ways to contact, either a website or a phone number.
Plant Inventory
The third corner, in the bottom left, is a tool for the farmer to keep track of what they have planted. For small to mid-size farmers, as they grow, it might become hard to keep track of what they have planted, how much they have planted, when they planted it, and how much did it yield last time. This tool helps them keep all of this track. They have the ability to add their own data each time they plant and also the ability to delete old data that is no longer useful to them. This tool also has a search function to find any particular crop they are looking for.
Machine Inventory
The fourth and final corner, in the bottom right, is a tool similar to the plant inventory but instead for any machinery the farmer might keep and maintain.This inventory can hold the name, make, model, year, along with the price of it, when it was last repaired/maintained, and whether or not it is registered. Similar to the plant inventory, they will have the abililty to add their own data each time they get a new piece of equipment, and also the ability to delete old data that is no longer useful to them, such as if they sell or scrap a piece of equipment. This tool also has a search function to find any particular crop they are looking for.
Overall this is a dashboard to help farmers, the backbone of our country, to help them and make their lives easier so they can focus more energy on growing food.
How we built it
We built this in the form of a web app using the NextJS framework. This tool includes a React front end and a node.js backend. For data storage, we use Google's Firestore. Along with that, to get the most up-to-date data, we used a couple of APIs from other sources. Firstly, we used the free public Open-Meteo API for the weather information. Secondly, for the data for the farmer's markets, we used the USDA Local Food Directories API. Additionally, for a more complete and reactive front-end, we utilize MUI, which is a React component Library.
Challenges we ran into
None of us had experience utilizing public APIs and how to get that data onto the front end. We all learned through trial and error, along with tons of documentation, and even successfully used 2 of them in our project. Additionally, half of our team didn't have knowledge of what React was; however, with attending the Session with Fulcrum for React, they were able to learn and help more.
Accomplishments that we're proud of
One notable accomplishment for us was getting the public APIs integrated and working properly. It was really exciting to see our app come to life thanks to the help of the other's APIs and our personal perseverance and dedication.
What we learned
The most important lesson we learned was about teamwork. All of us have created our own personal projects and school projects. However, those have all been solo projects and there were some difficulties in coding a larger project together. Learning how to work collaboratively using Git and Git Hub, solving merge errors, creating branches, and so on. That lesson of collaborative coding was the most important from our point of view.
What's next for Farmer's Shed
Farmer's Shed was designed very well with modularity in mind. The components in each corner are basically widgets, and many more widgets can be designed and implemented. In the future, based on more research, we can possibly design more components that the farmers can exchange to personalize it even further. We could also add authentication so each farmer can have their own profile.
Built With
- cli
- css
- firestore
- git
- github
- mui
- next.js
- open-meteo-forecast
- react
- usda
- vscode


Log in or sign up for Devpost to join the conversation.