-
-
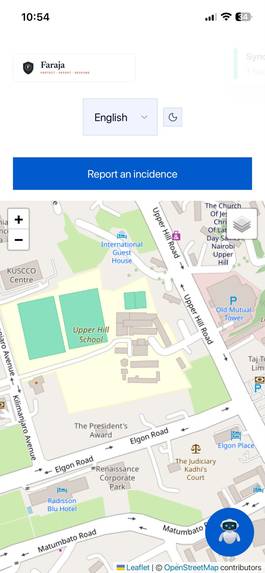
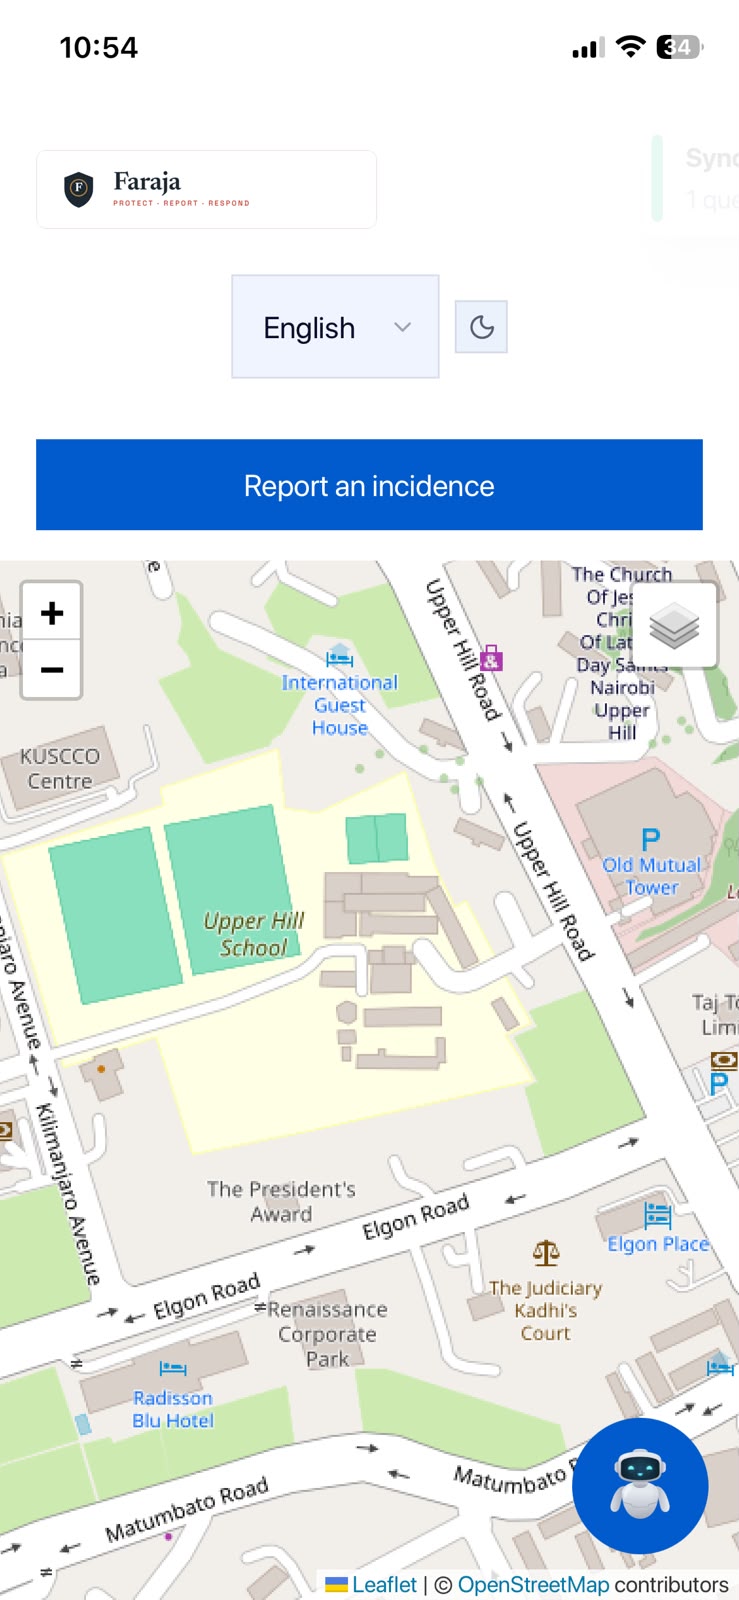
Reporters app with building footprints
-
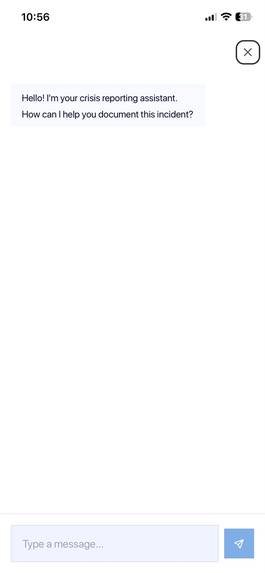
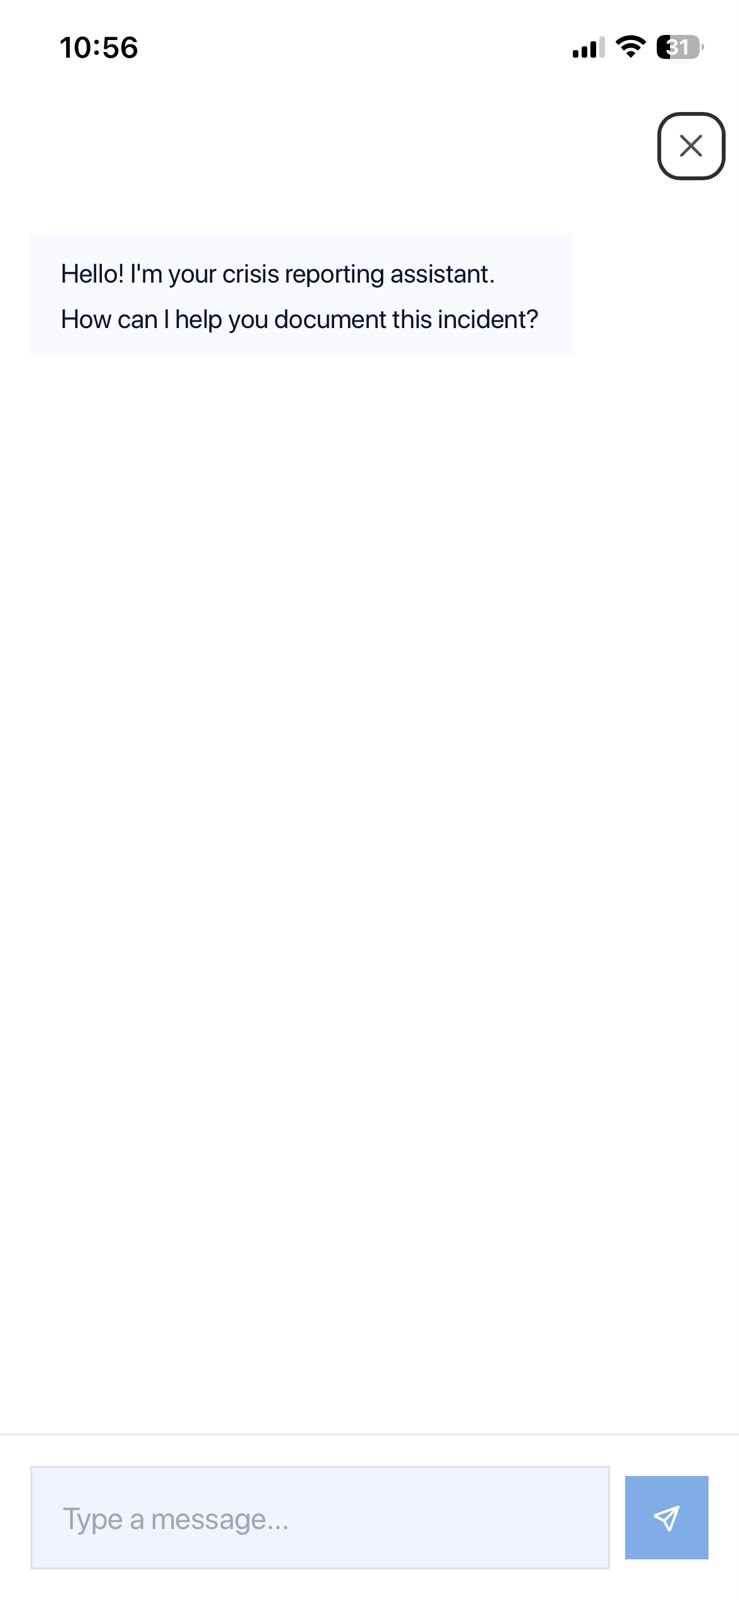
Reporter's app LLM
-
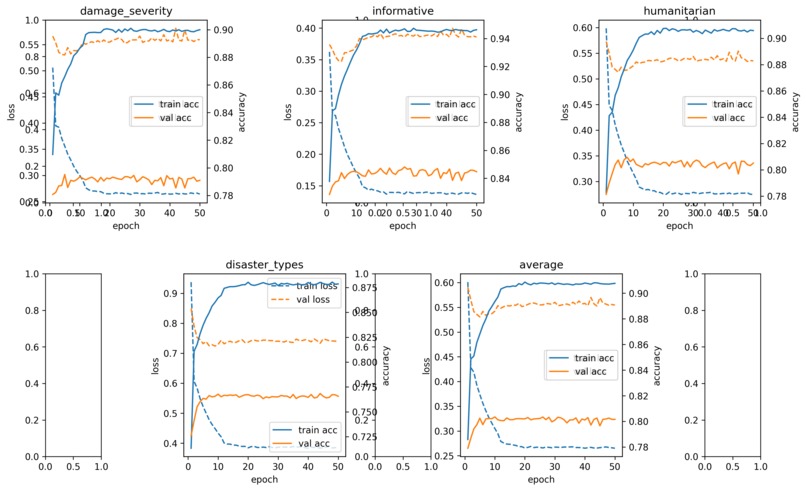
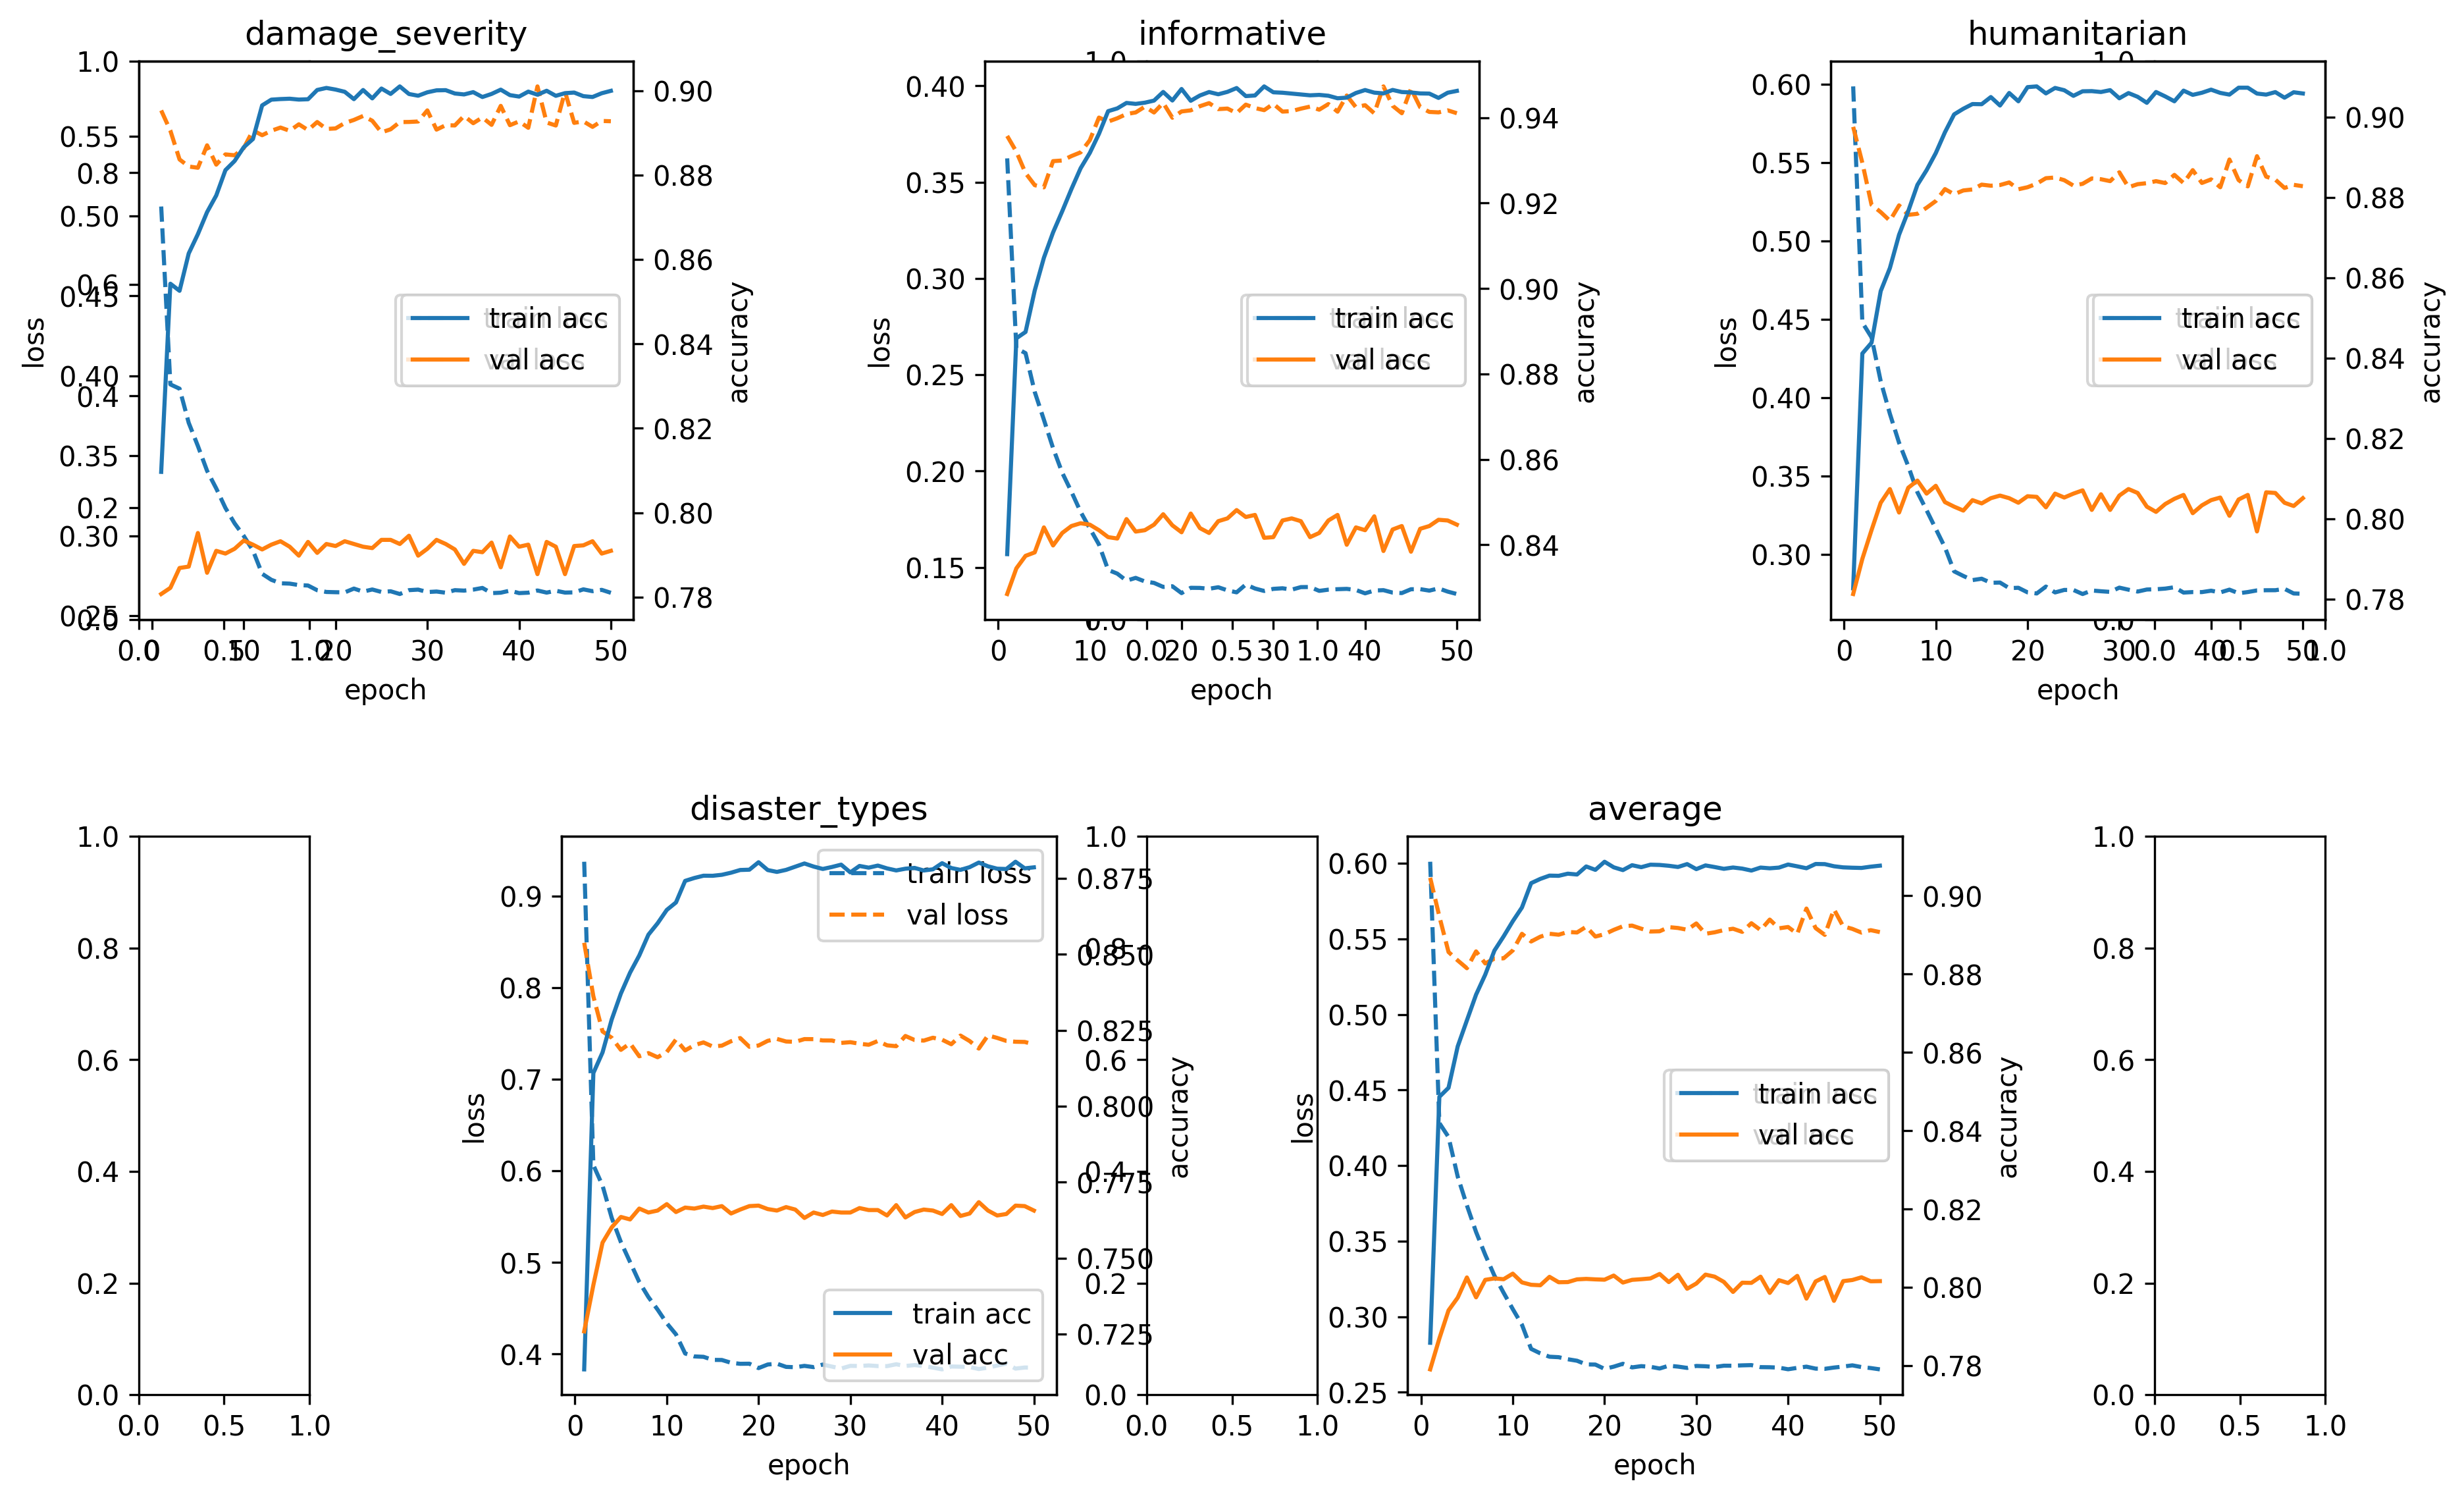
ResNet-18 multitask classification trained on 71,198 images from the MEDIC dataset across four tasks
-
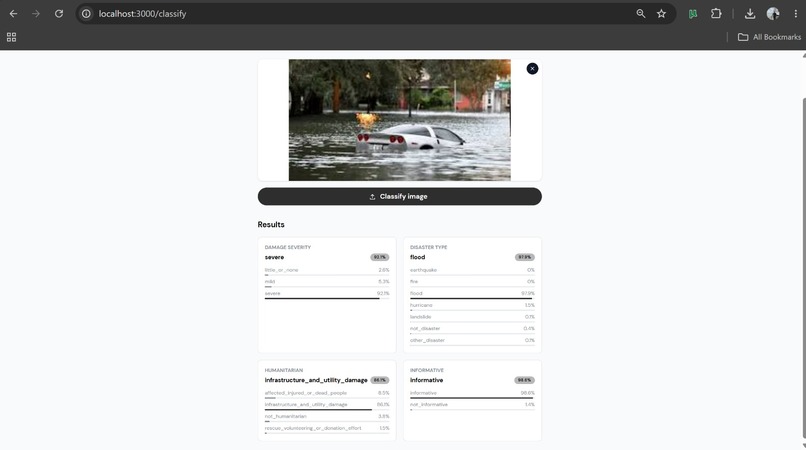
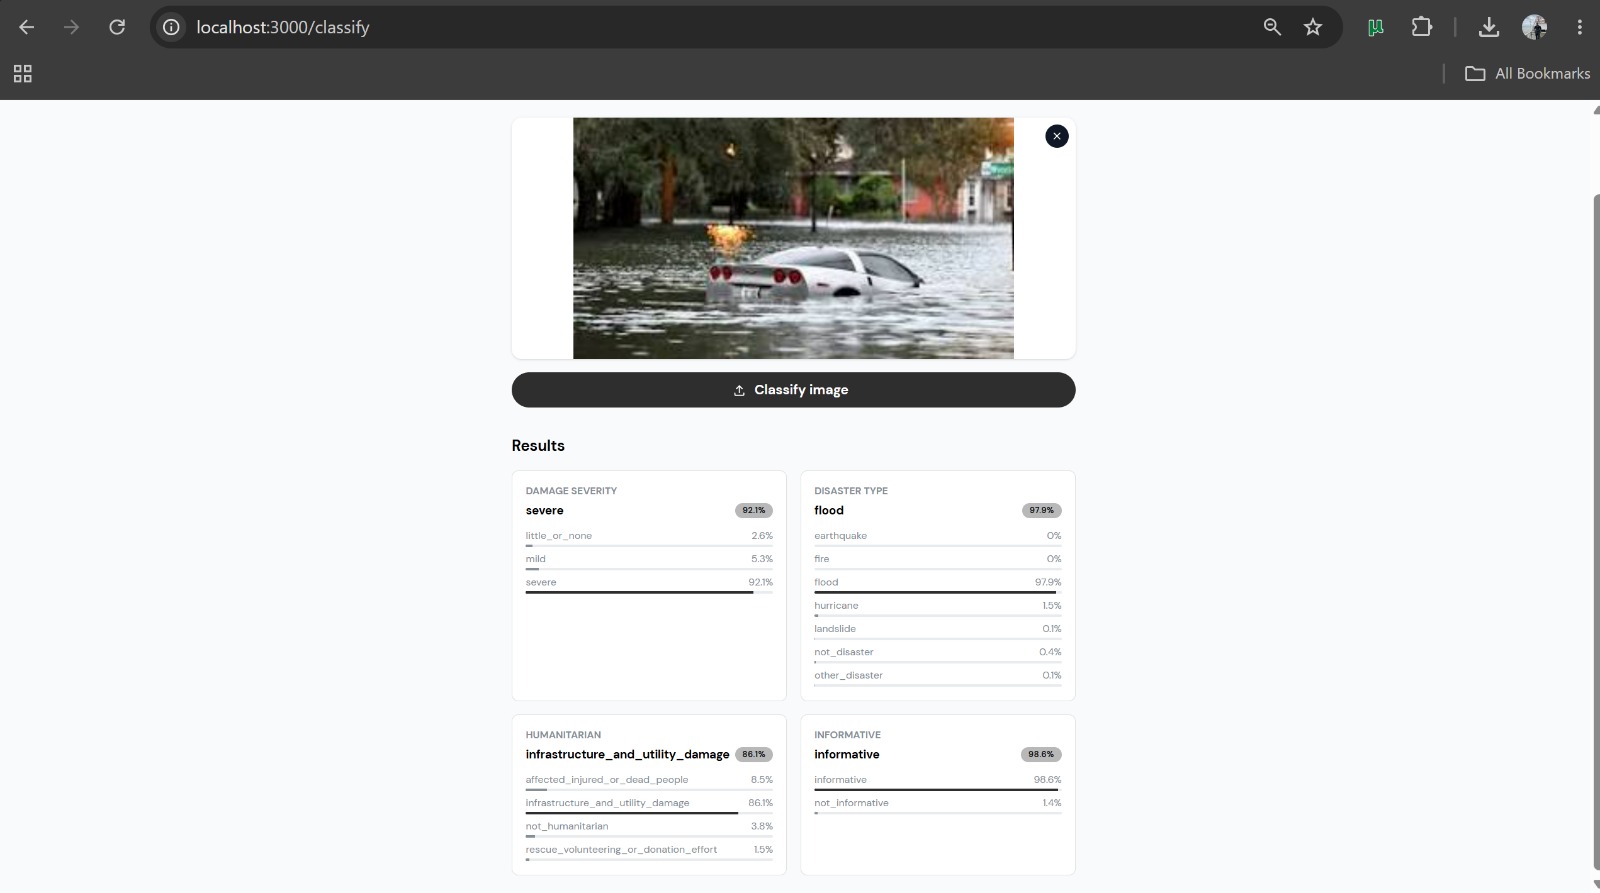
AI damage classifier returning simultaneous predictions across four tasks from a single image upload.
-
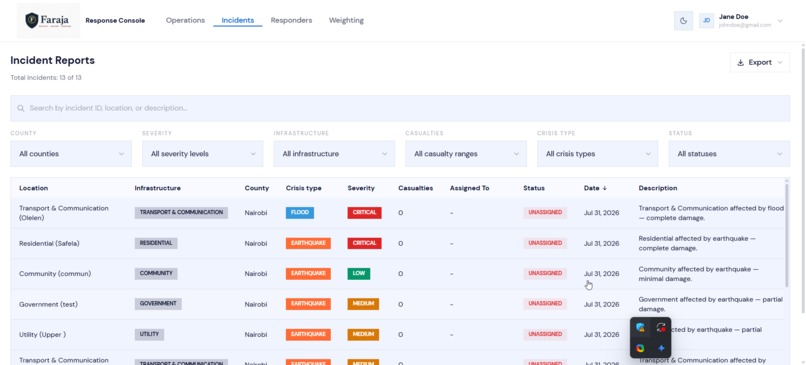
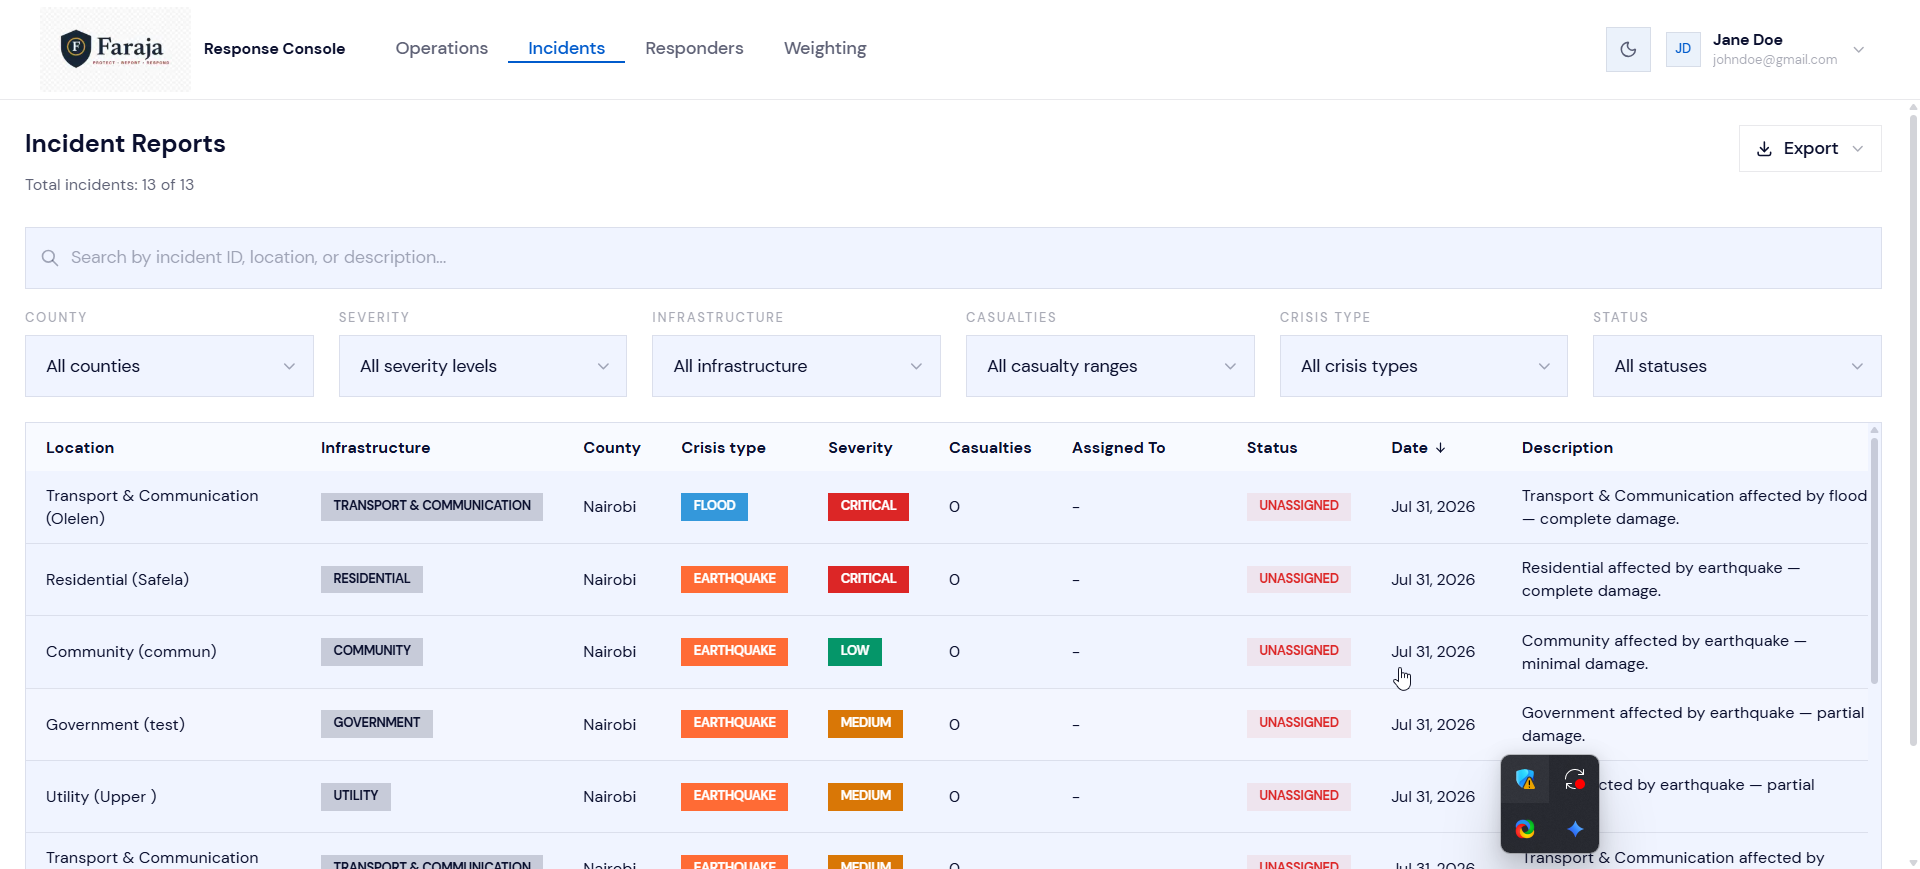
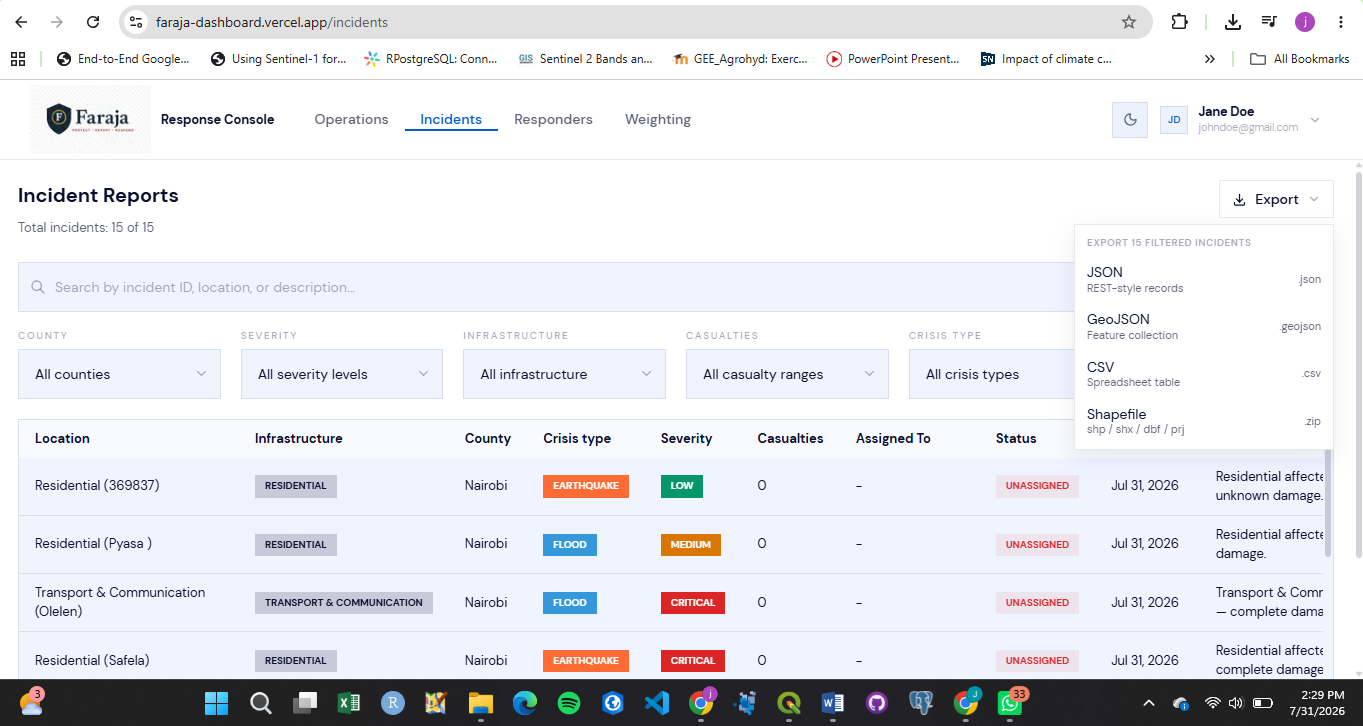
Incidents dashboard console
-
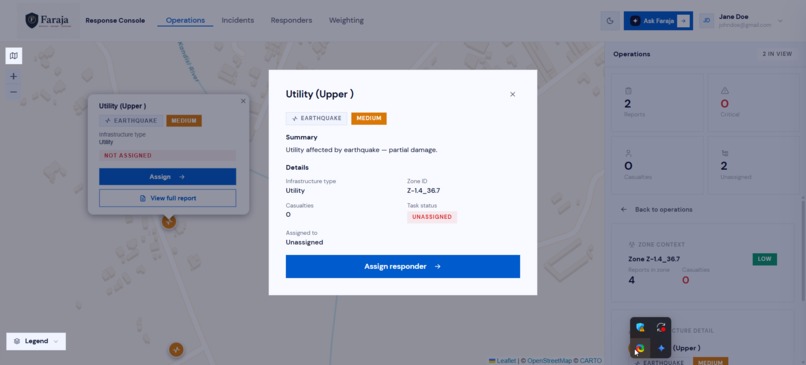
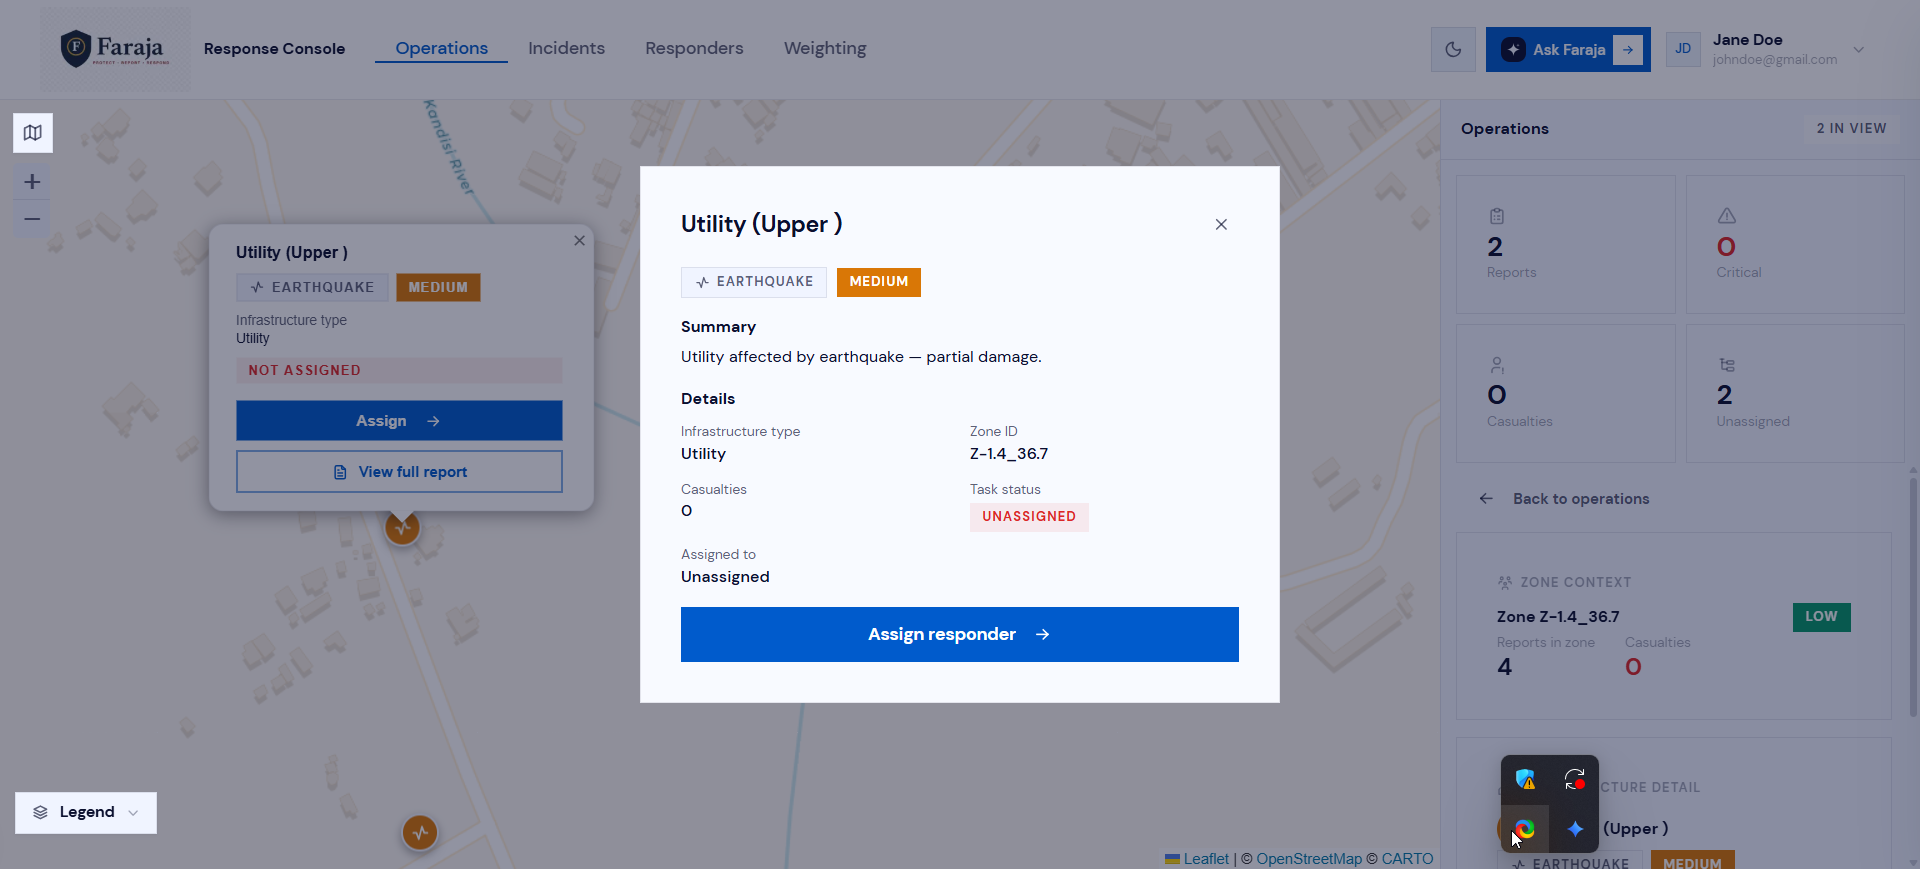
Pop-up with full incidence report on map
-
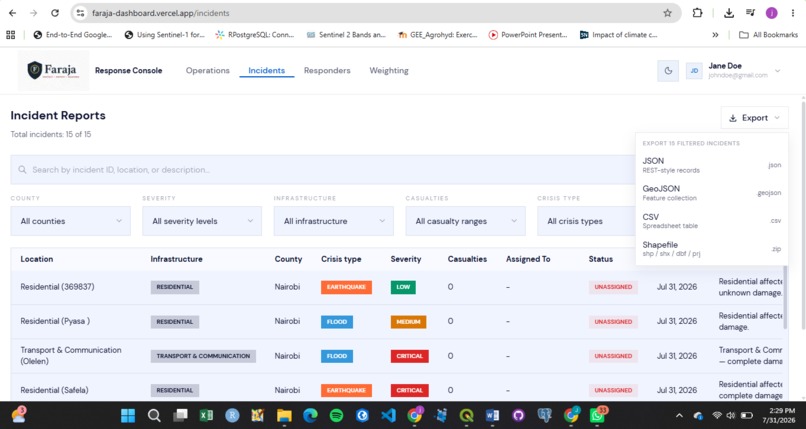
Multi-format incident data export (JSON · GeoJSON · CSV · Shapefile) built into the Faraja Response Console
-
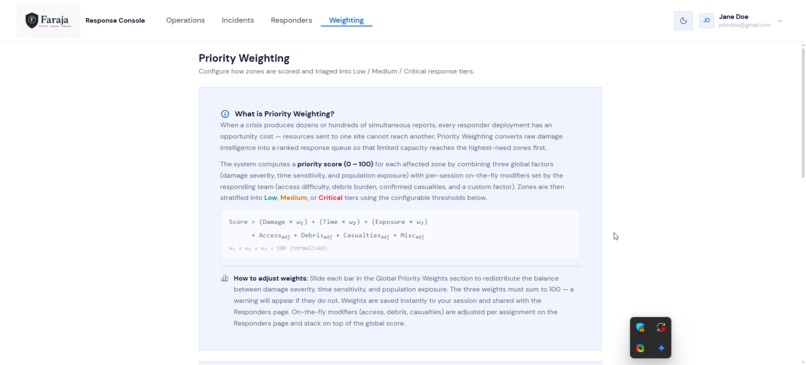
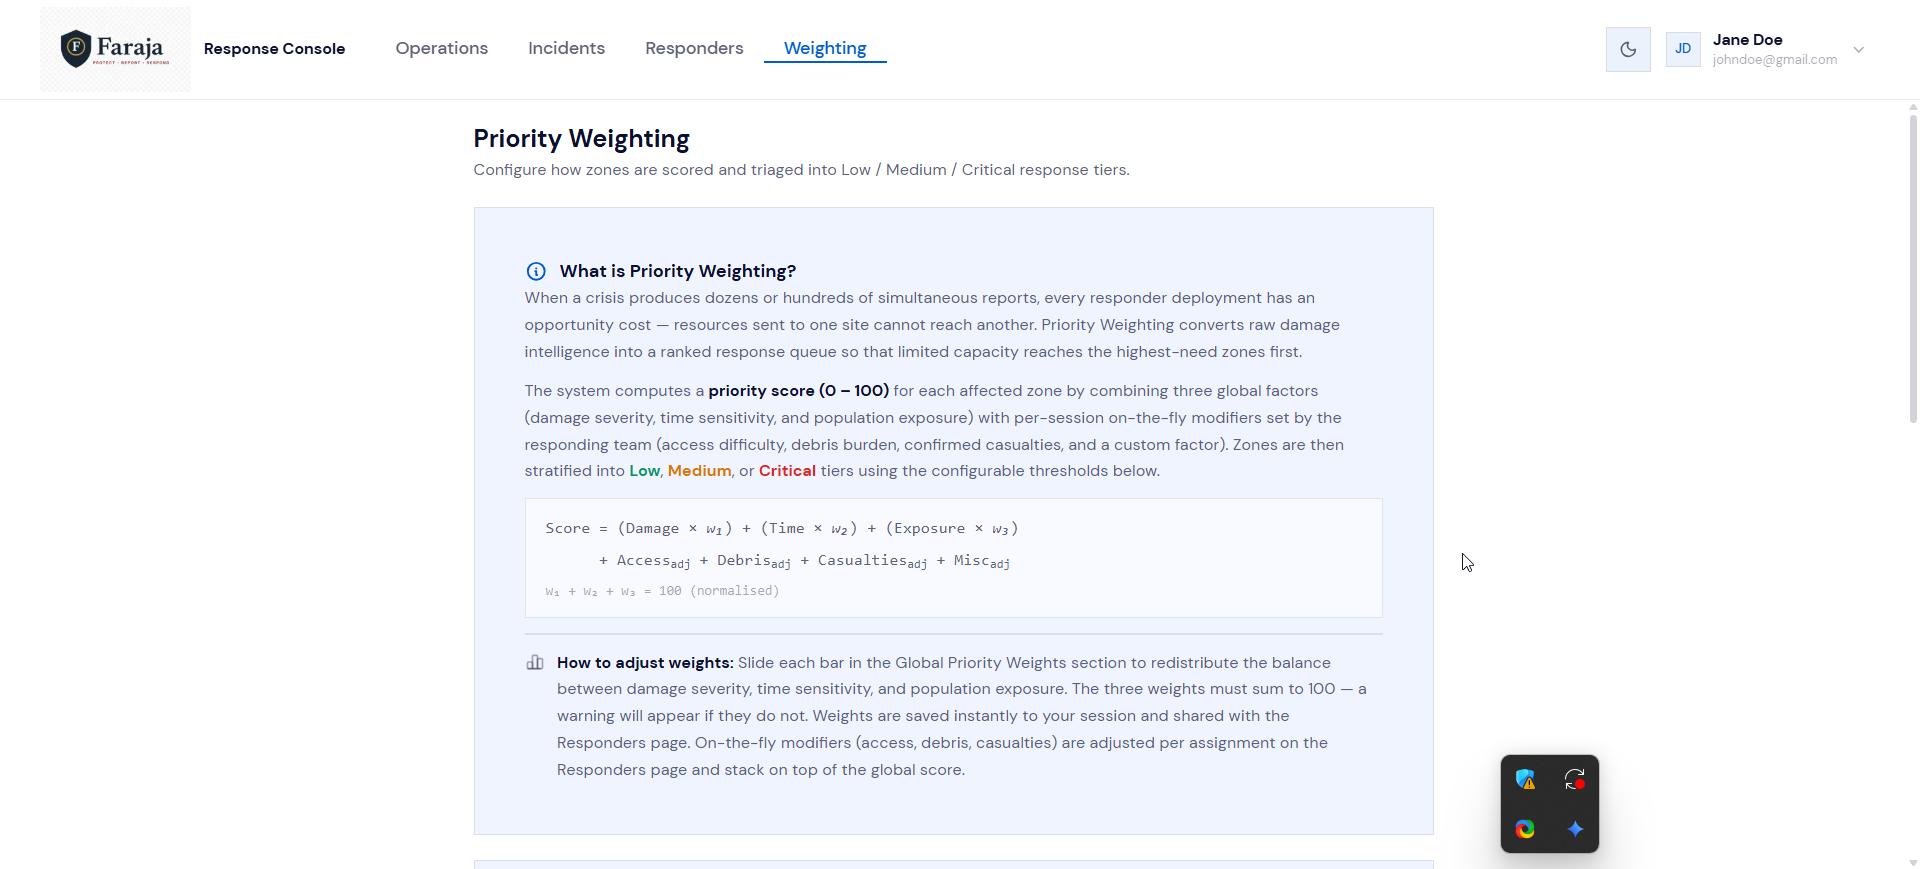
Global weights page on dashboard
-
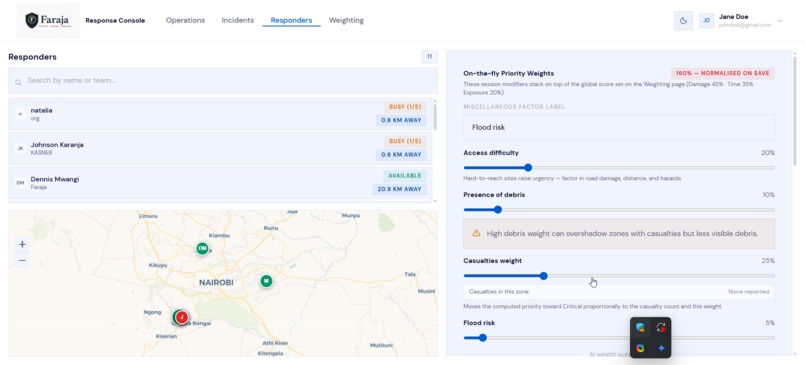
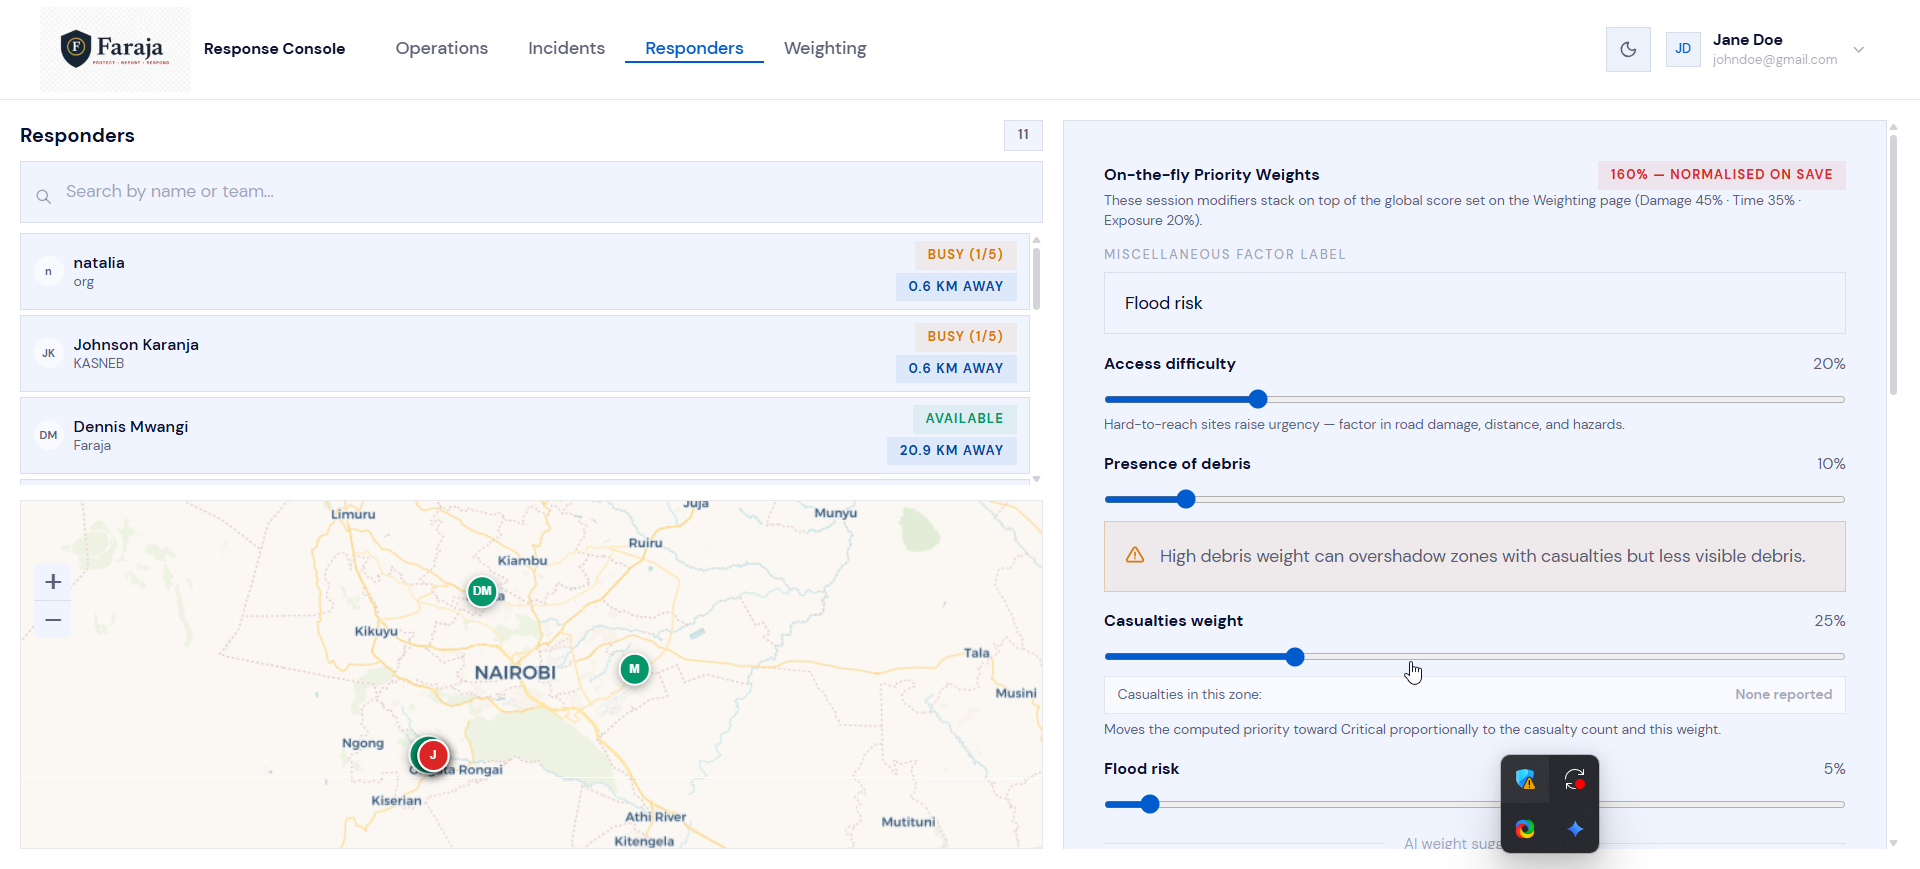
Responders assignment console
-
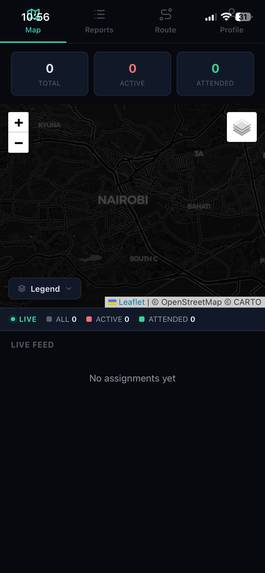
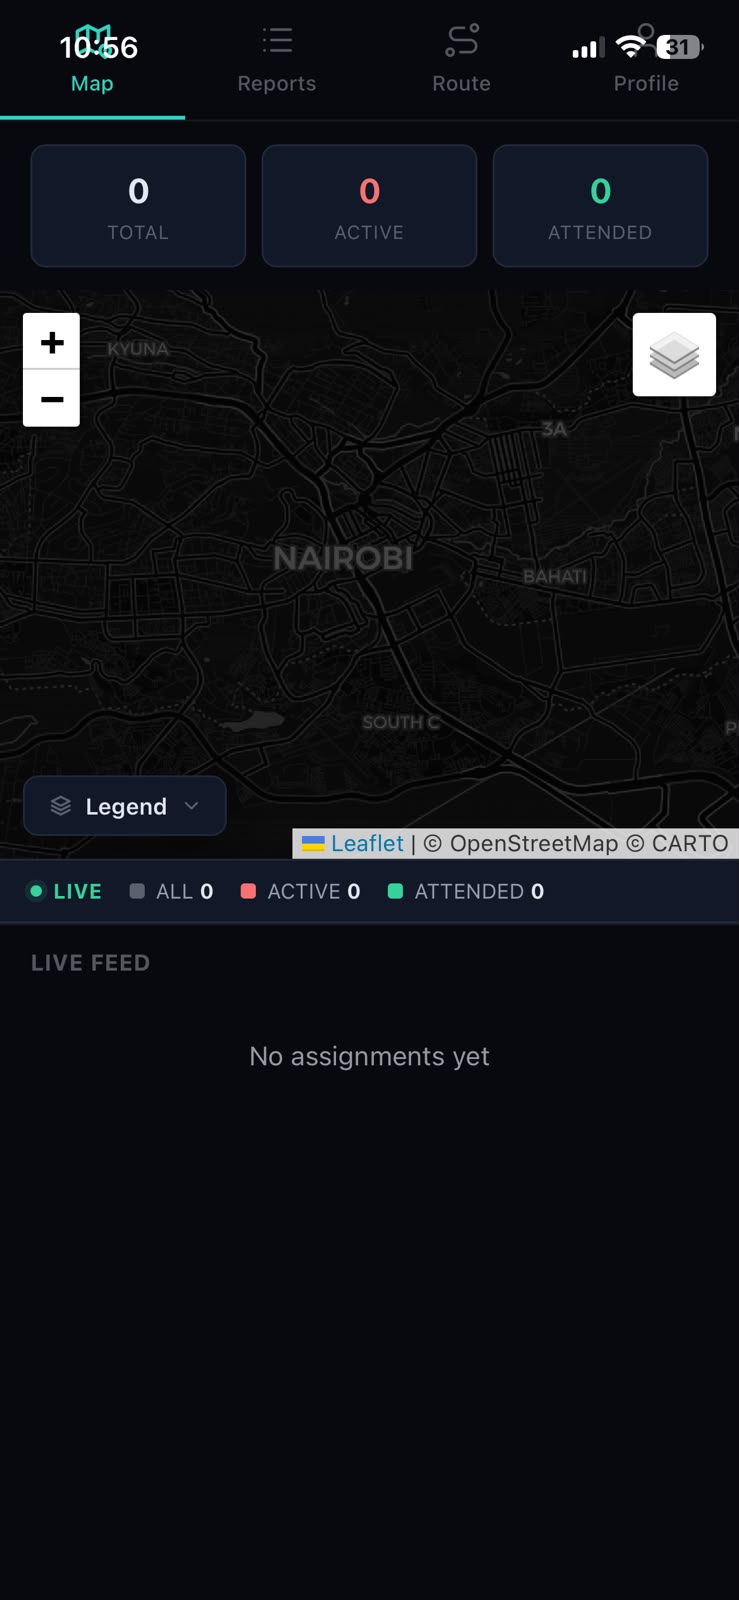
Responder console
Inspiration
The first 48 hours after a sudden disaster decide how many people recover and how many are left behind. In that window, satellite and remote-sensing products can tell responders roughly where damage happened, but structured, ground-level detail often takes days to arrive. That gap between what a satellite can infer and what a person standing in front of a collapsed building can see is where lives are lost.
We also noticed a simpler truth about our region: in most crisis-affected communities, far more people have WhatsApp than have any purpose-built emergency app, and connectivity is patchy exactly when it matters most. So we asked a direct question — what if the community itself became the sensor network, and the only thing a person needed to report damage was the phone already in their pocket? Faraja ("comfort" or "relief" in Swahili) grew out of that question.
What it does
Faraja is an open-source platform that turns community members into a live crisis-reporting network and turns their reports into prioritised action for responders.
- Two zero-barrier intake channels. People report damage through a mobile web app (no install needed) or through an automated WhatsApp bot that walks them through the same structured survey. Both channels capture disaster type, infrastructure affected, damage level, GPS location, and a photo, and both produce identical structured data.
- On-device-friendly reporting. The reporting app is a Progressive Web App that supports offline capture and syncs when connectivity returns, so reports survive the dead zones that follow a disaster.
- AI classification at intake. A single AI model classifies every submitted photo across four dimensions at once — damage severity, informativeness, humanitarian category, and disaster type — reaching 90.2% accuracy on the damage-severity task (94% recall on severe damage) and roughly 87% overall across all four tasks.
- Clean, deduplicated data. A three-tier deduplication pipeline removes noise, and building-level versioning keeps the latest assessment for each structure while preserving full history.
- A live coordinator dashboard. Reports appear on a clustered live map. A Priority Weighting engine scores each affected zone from 0 to 100 by combining damage severity, time sensitivity, and population exposure, with on-the-fly modifiers (access difficulty, debris, confirmed casualties) set by field teams. Zones are stratified into Low, Medium, and Critical tiers, and AI helps recommend thresholds from the live crisis picture.
- Responder dispatch. Coordinators rank nearby responders by distance and current workload and assign them to the highest-need zones first.
The result is structured, deduplicated, geolocated, AI-enriched crisis intelligence within seconds of a report — designed to complement, not replace, existing early-warning and early-action workflows.
How we built it
Faraja is a set of independently deployable components rather than a single monolith, which lets each part scale and update on its own.
- Reporters App — Next.js 14, TypeScript, and Mantine, delivered as a PWA with a Leaflet pin-drop map and full localisation for all six official UN languages, including right-to-left Arabic.
- WhatsApp bot — Node.js with whatsapp-web.js and Puppeteer, mirroring the survey as a stateful conversational flow with native location and image sharing.
- Queue and processing — an Express and BullMQ service backed by Redis 7 with append-only persistence. Concurrent workers download each image, call the classifier, and post the enriched report to the backend, with automatic retries on failure.
- AI classifier — a multi-task ResNet18 served through Flask, trained on the MEDIC dataset of 71,198 real crisis images. The four-task design shares visual features across tasks and keeps inference to roughly 20–30 ms per image.
- Backend API — Django and Django REST Framework with GeoDjango, running behind Nginx and Gunicorn, with OpenAPI/Swagger documentation.
- Spatial database — PostgreSQL with PostGIS and GIST spatial indexing for fast live-map performance.
- Coordinator dashboard and Responders app — deployed separately, consuming the REST API for live mapping, priority weighting, and dispatch.
The damage-severity score is computed as a weighted composite:
$$ \text{Score} = (\text{Damage} \times w_1) + (\text{Time} \times w_2) + (\text{Exposure} \times w_3) + \text{modifiers}, \quad w_1 + w_2 + w_3 = 100 $$
Challenges we ran into
- Making WhatsApp behave like a structured form. Turning a free-form chat channel into a reliable multi-step survey — handling session state, timeouts, and container restarts — took far more engineering than the web form did.
- Deduplicating real-world reports. During a crisis the same building gets reported many times, from slightly different spots, seconds apart. Building a cascading dedup strategy that removed noise without discarding genuinely distinct reports required careful spatial and temporal tuning.
- Keeping the model honest across four tasks. Balancing a multi-task model so that the primary task (damage severity) stayed strong without starving the auxiliary tasks meant a lot of iteration, and reading convergence carefully rather than trusting a single headline number.
- Designing for low connectivity. Offline capture, durable queuing, and burst resilience all exist because we assumed the network would fail at the worst possible time — and building for that assumption reshaped several design decisions.
Accomplishments that we're proud of
- A working, deployed MVP with a live dashboard, not just a prototype.
- Genuinely zero-barrier intake: anyone with WhatsApp can file a structured, geolocated, AI-classified report without installing anything.
- A damage-severity classifier at 90.2% accuracy with 94% recall on the most critical class — the class where a miss costs the most.
- A transparent, adjustable Priority Weighting engine that puts control in the hands of coordinators and field teams instead of hiding decisions inside a black box.
- A fully open-source stack with no licensing costs, so it can be adopted and adapted across the region.
What we learned
- Adoption is a design problem, not a technical one. The single biggest lever for community reporting was removing the requirement to install anything.
- AI earns trust when it stays a first-pass triage tool. Our classifications supplement human-submitted data and route urgent cases faster; they never silently overwrite what a person reported.
- Honest metrics matter more than impressive ones. Reporting the damage-severity figure separately from the overall figure kept our claims defensible and forced us to understand our own results.
- Resilience is a feature. Offline support and durable queues turned out to be the difference between a demo and something usable in a real crisis.
What's next for Faraja
- Fine-tuning the classifier on region-specific imagery for East African disaster types.
- Deeper integration with existing early-warning and early-action systems so community reports can feed directly into regional decision-making.
- Expanding the Priority Weighting engine with population and exposure data layers for sharper zone scoring.
- Piloting with a partner organisation to validate the workflow end to end in a live setting.
Built With
- django
- django-rest-framework
- leaflet.js
- machine-learning
- next.js
- nginx
- node.js
- postgis
- postgresql
- pwa
- pytoch
- react
- react-leaflet
- resnet
- typescript

Log in or sign up for Devpost to join the conversation.