-
-

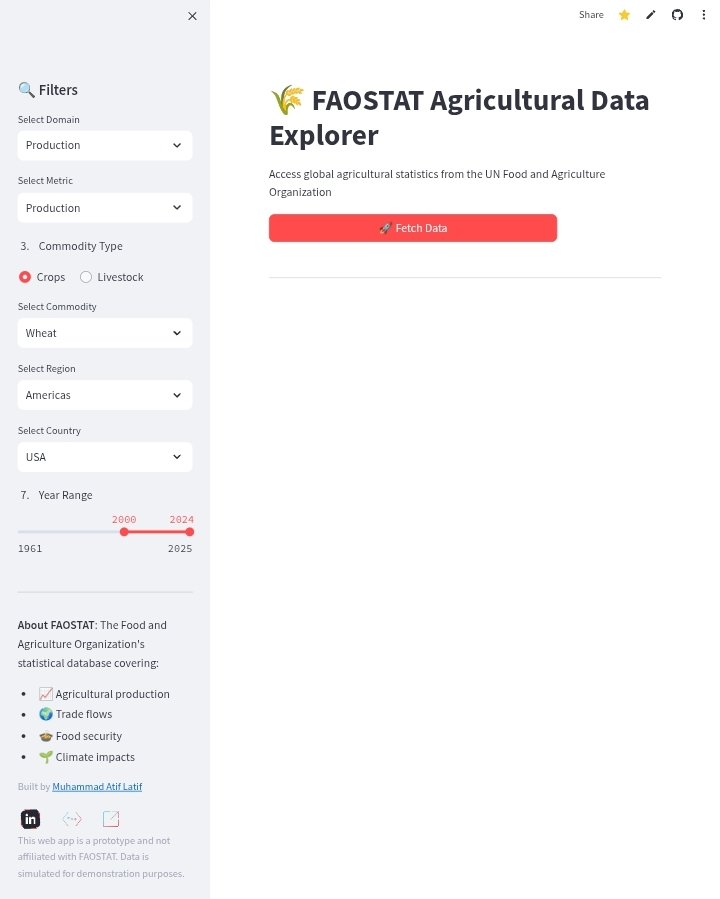
This screenshot showcases the interactive filter panel of the FAOSTAT Agricultural Data Explorer.
About the Project
Inspiration
Agriculture plays a vital role in global sustainability, food security, and economic growth. However, raw agricultural data is often complex and inaccessible to the average policymaker, researcher, or citizen. I was inspired to bridge this gap by building an intuitive AI-powered platform that transforms FAOSTAT’s massive datasets into clear, actionable insights for everyone — from analysts to everyday users.
What It Does
FAOSTATs is a Streamlit web app that leverages FAO’s publicly available data and combines it with AI models to provide:
- Interactive global agricultural statistics
- Country-wise data visualization
- AI-powered summaries and insights
- Natural language queries for faster data discovery
How I Built It
The platform was built using:
- Streamlit for the user interface
- FAOSTAT data for agricultural statistics
- Pandas and Plotly for data processing and visualization
- Python as the core language
Challenges I Faced
- Cleaning and preparing large datasets from FAOSTAT required significant preprocessing.
- Integrating natural language understanding to handle diverse user queries was tricky and required careful prompt engineering.
- Designing a UI that was both powerful and user-friendly in Streamlit involved several iterations.
What I Learned
- Gained deep understanding of working with real-world agricultural datasets
- Improved my skills in integrating LLMs for data summarization
- Learned how to build and deploy data-driven web apps using Streamlit
- Understood the importance of user experience in data presentation


Log in or sign up for Devpost to join the conversation.