Inspiration
It started with a Sunday evening argument about money — not the dramatic kind, but the slow, exhausting kind that comes from simply not knowing where it all went. Between childcare, groceries, utilities, and a growing pile of streaming subscriptions, our family's finances had become a scattered mess across spreadsheets, banking apps, and forgotten receipts.
We wanted one place — calm, clear, and built for a family — where we could open a dashboard on Monday morning and instantly understand our financial health. That shared frustration became the seed for FamilyFinance.
What it does
FamilyFinance is a household finance dashboard that brings a family's entire financial picture into a single, easy-to-read interface. It lets families:
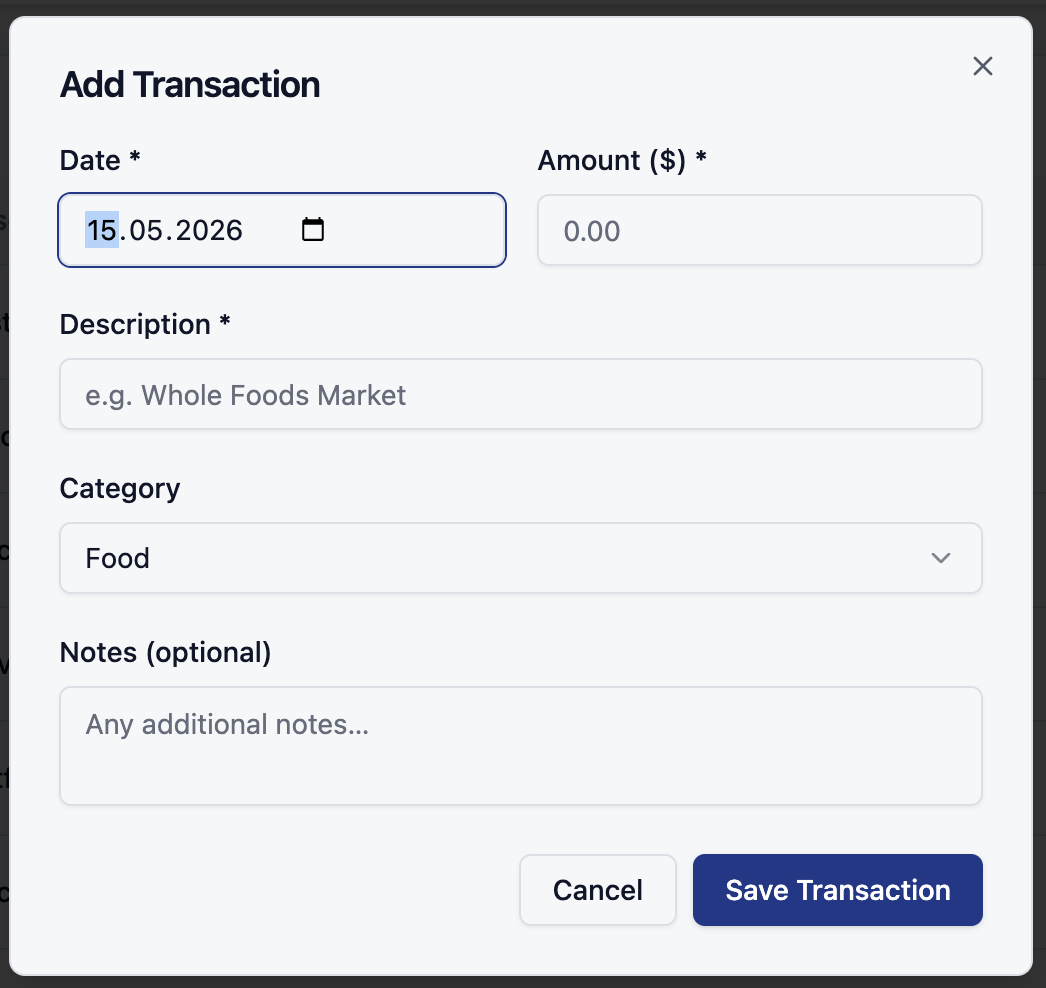
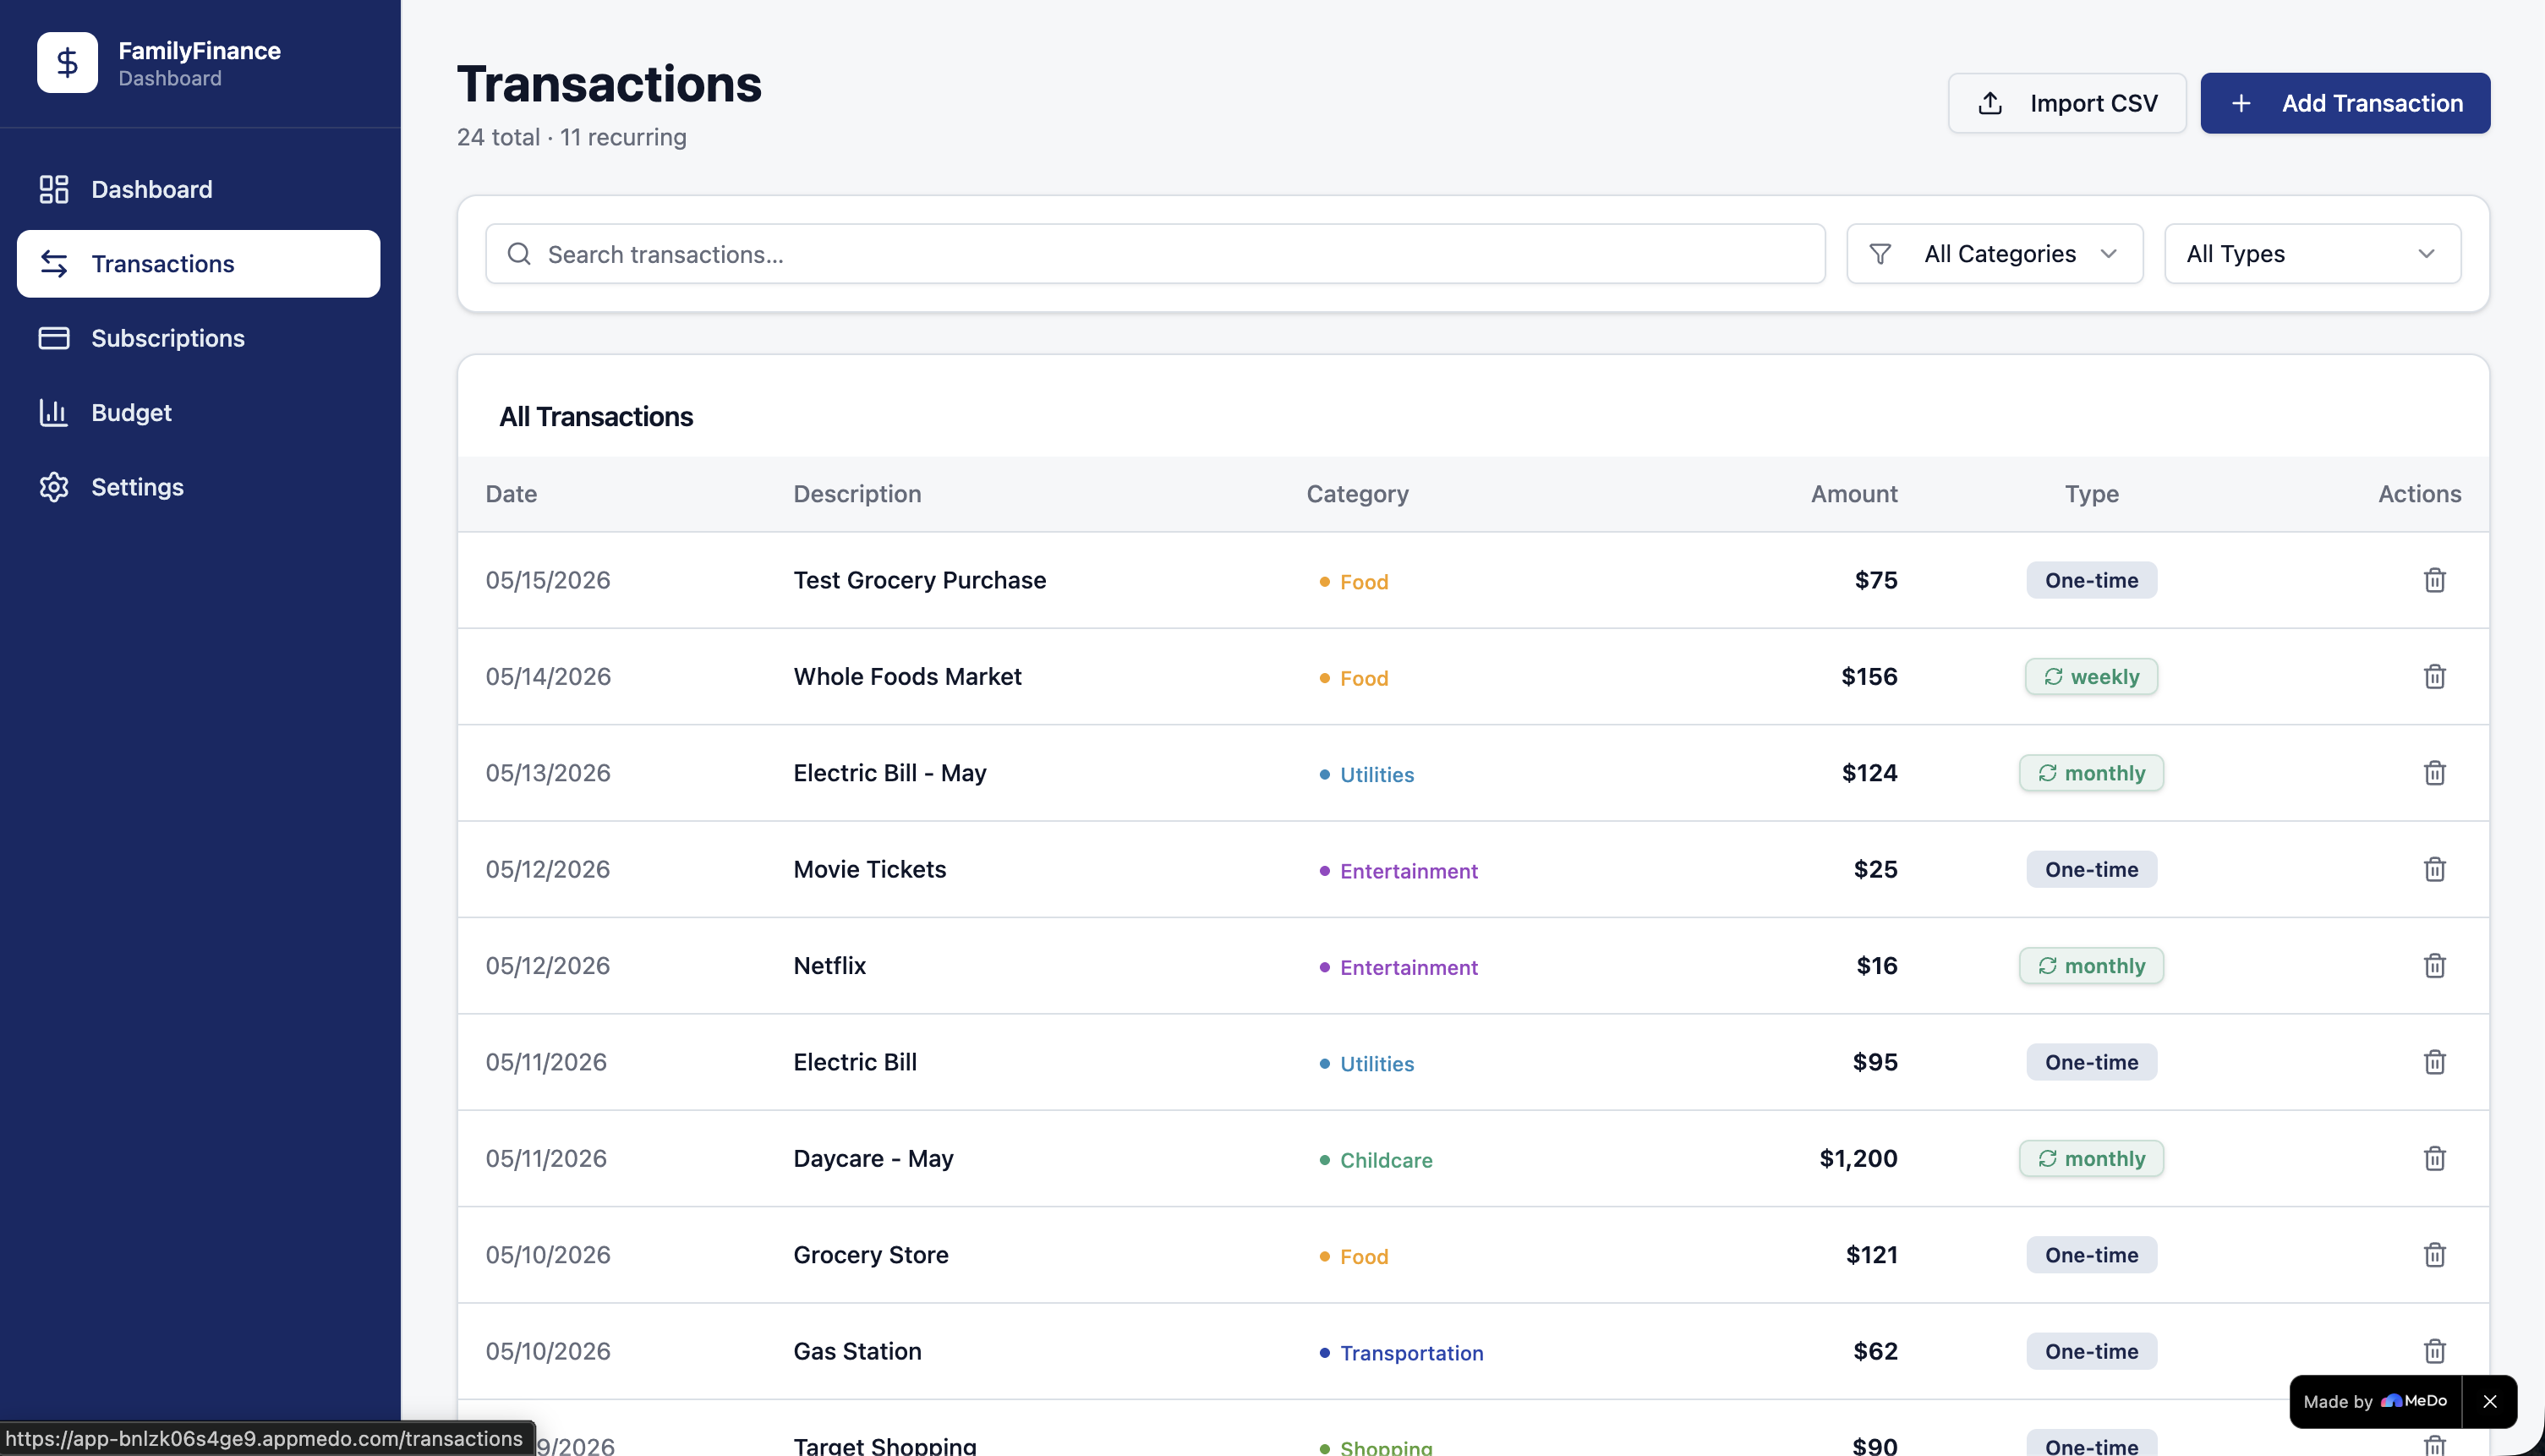
- Track transactions by logging expenses manually or importing bank data via CSV, with category tagging and recurring detection
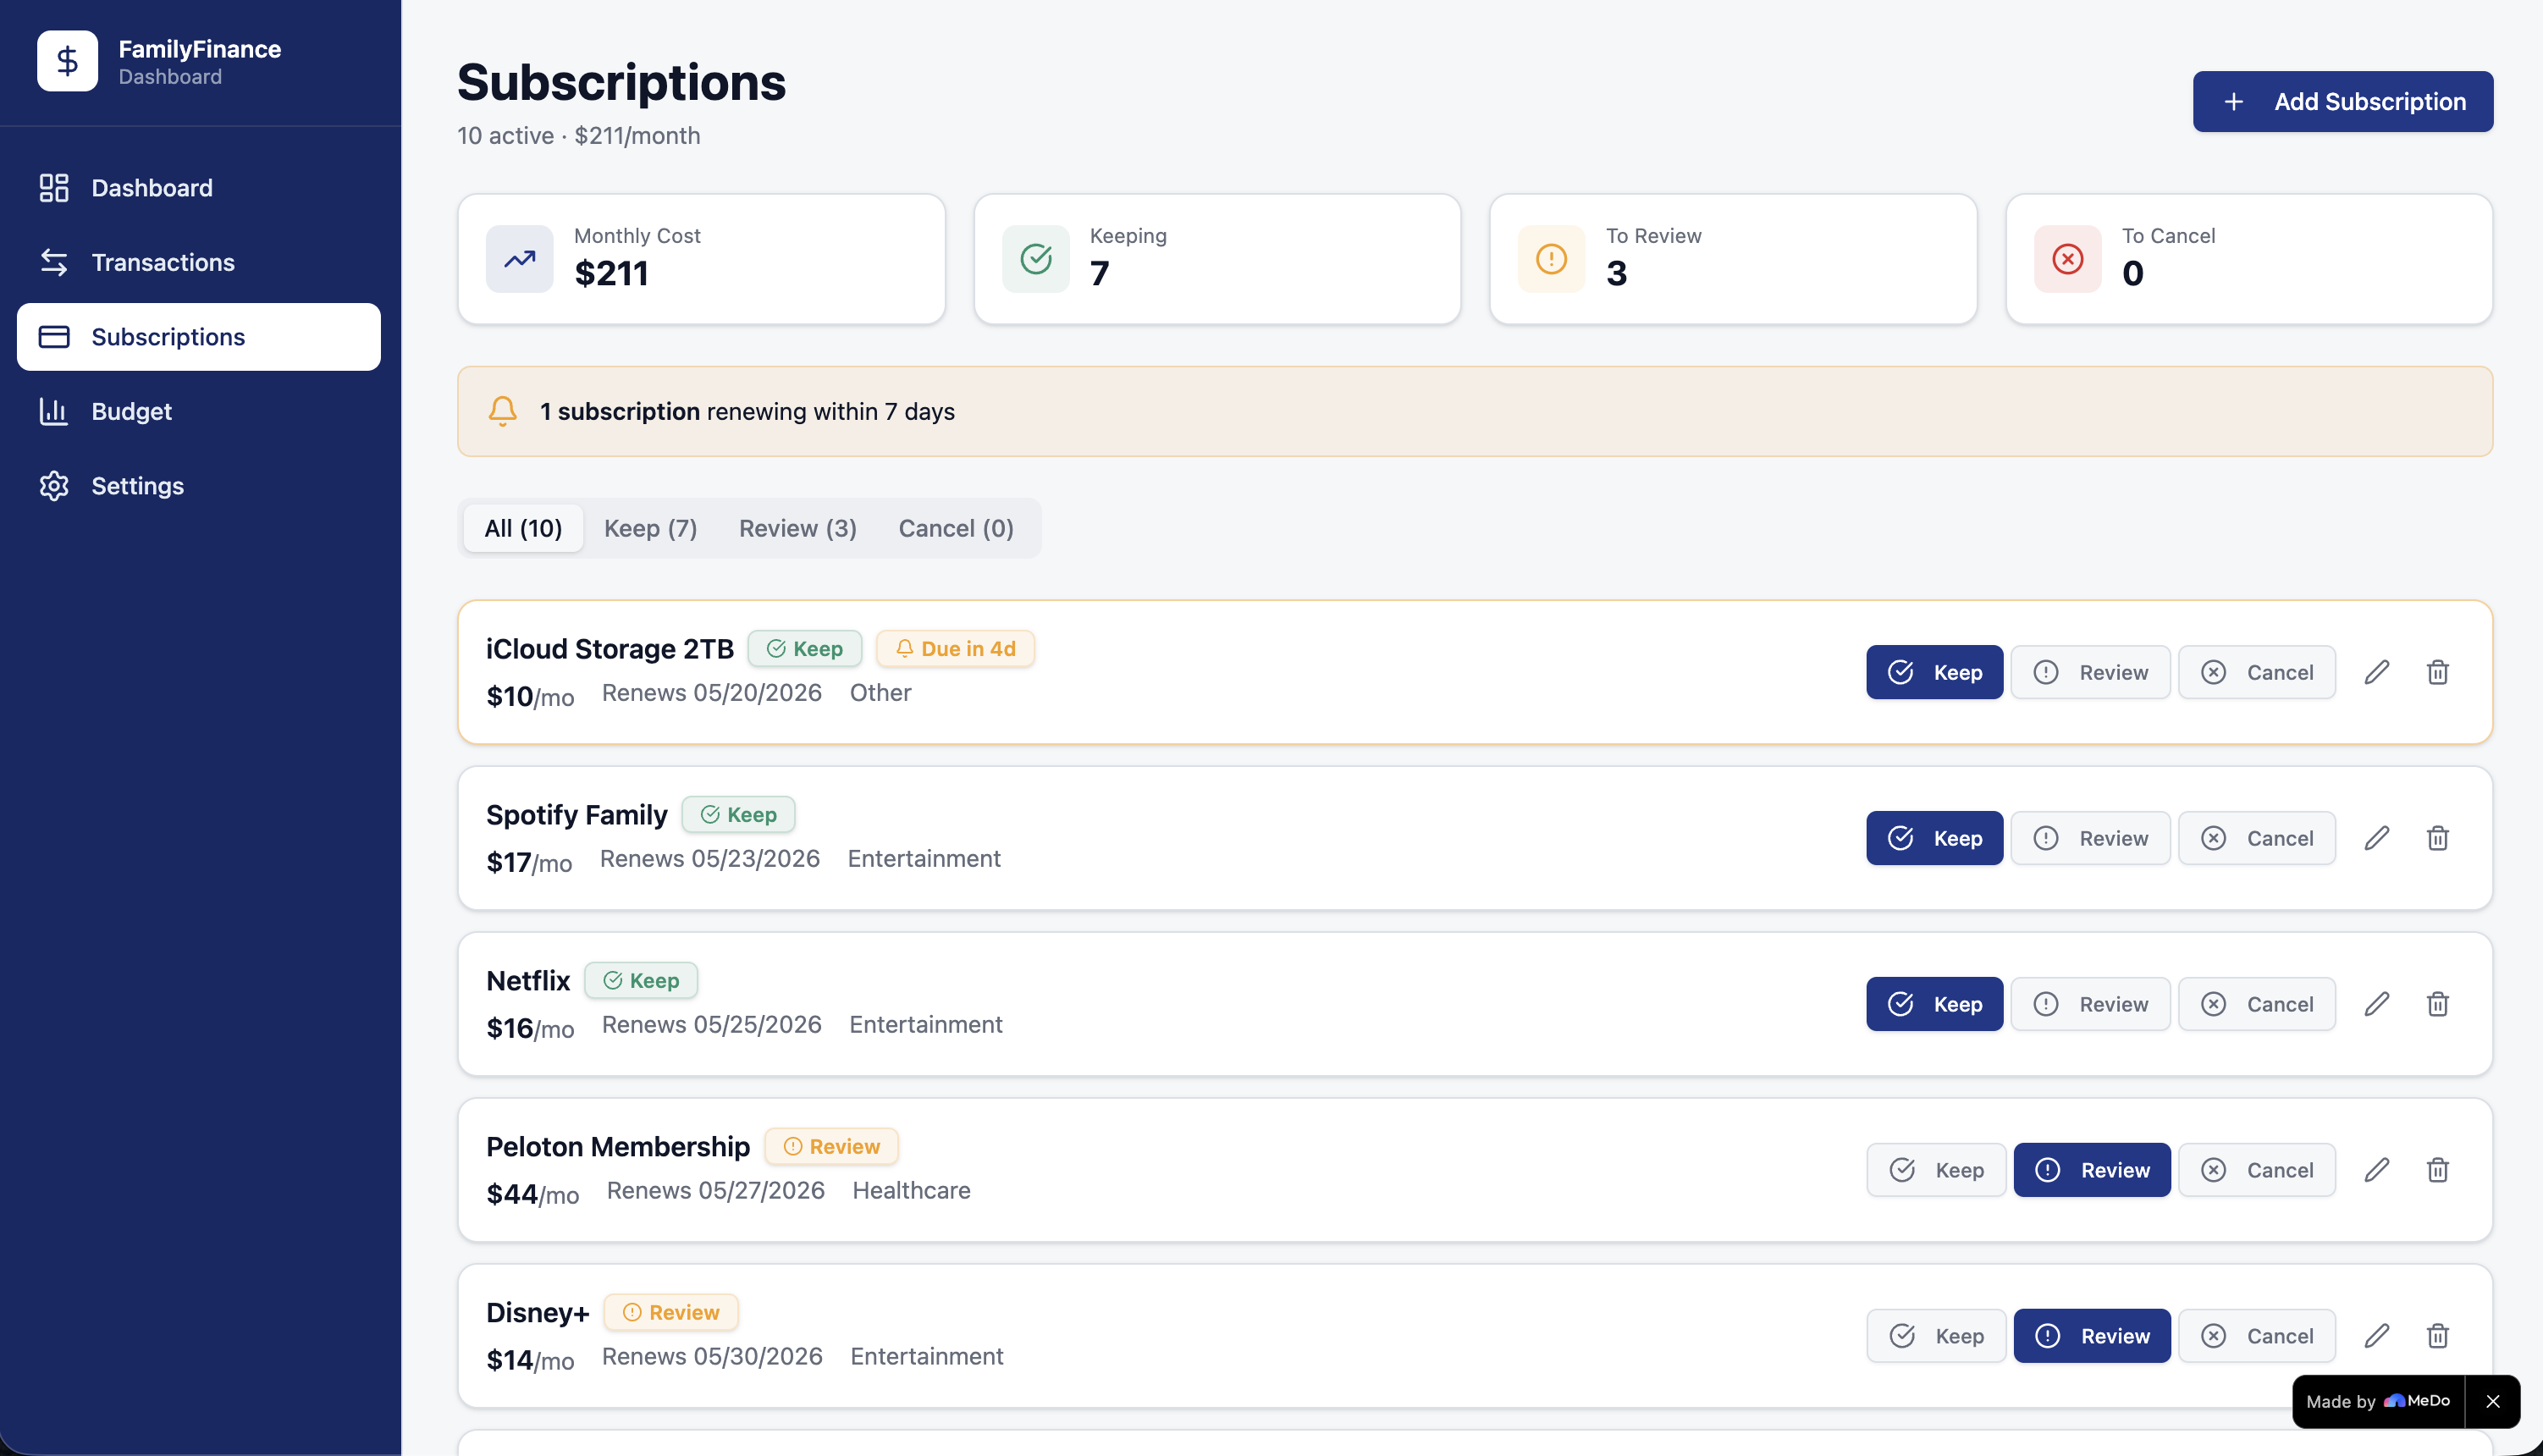
- Audit subscriptions by surfacing all active recurring plans and helping decide what to keep, review, or cancel
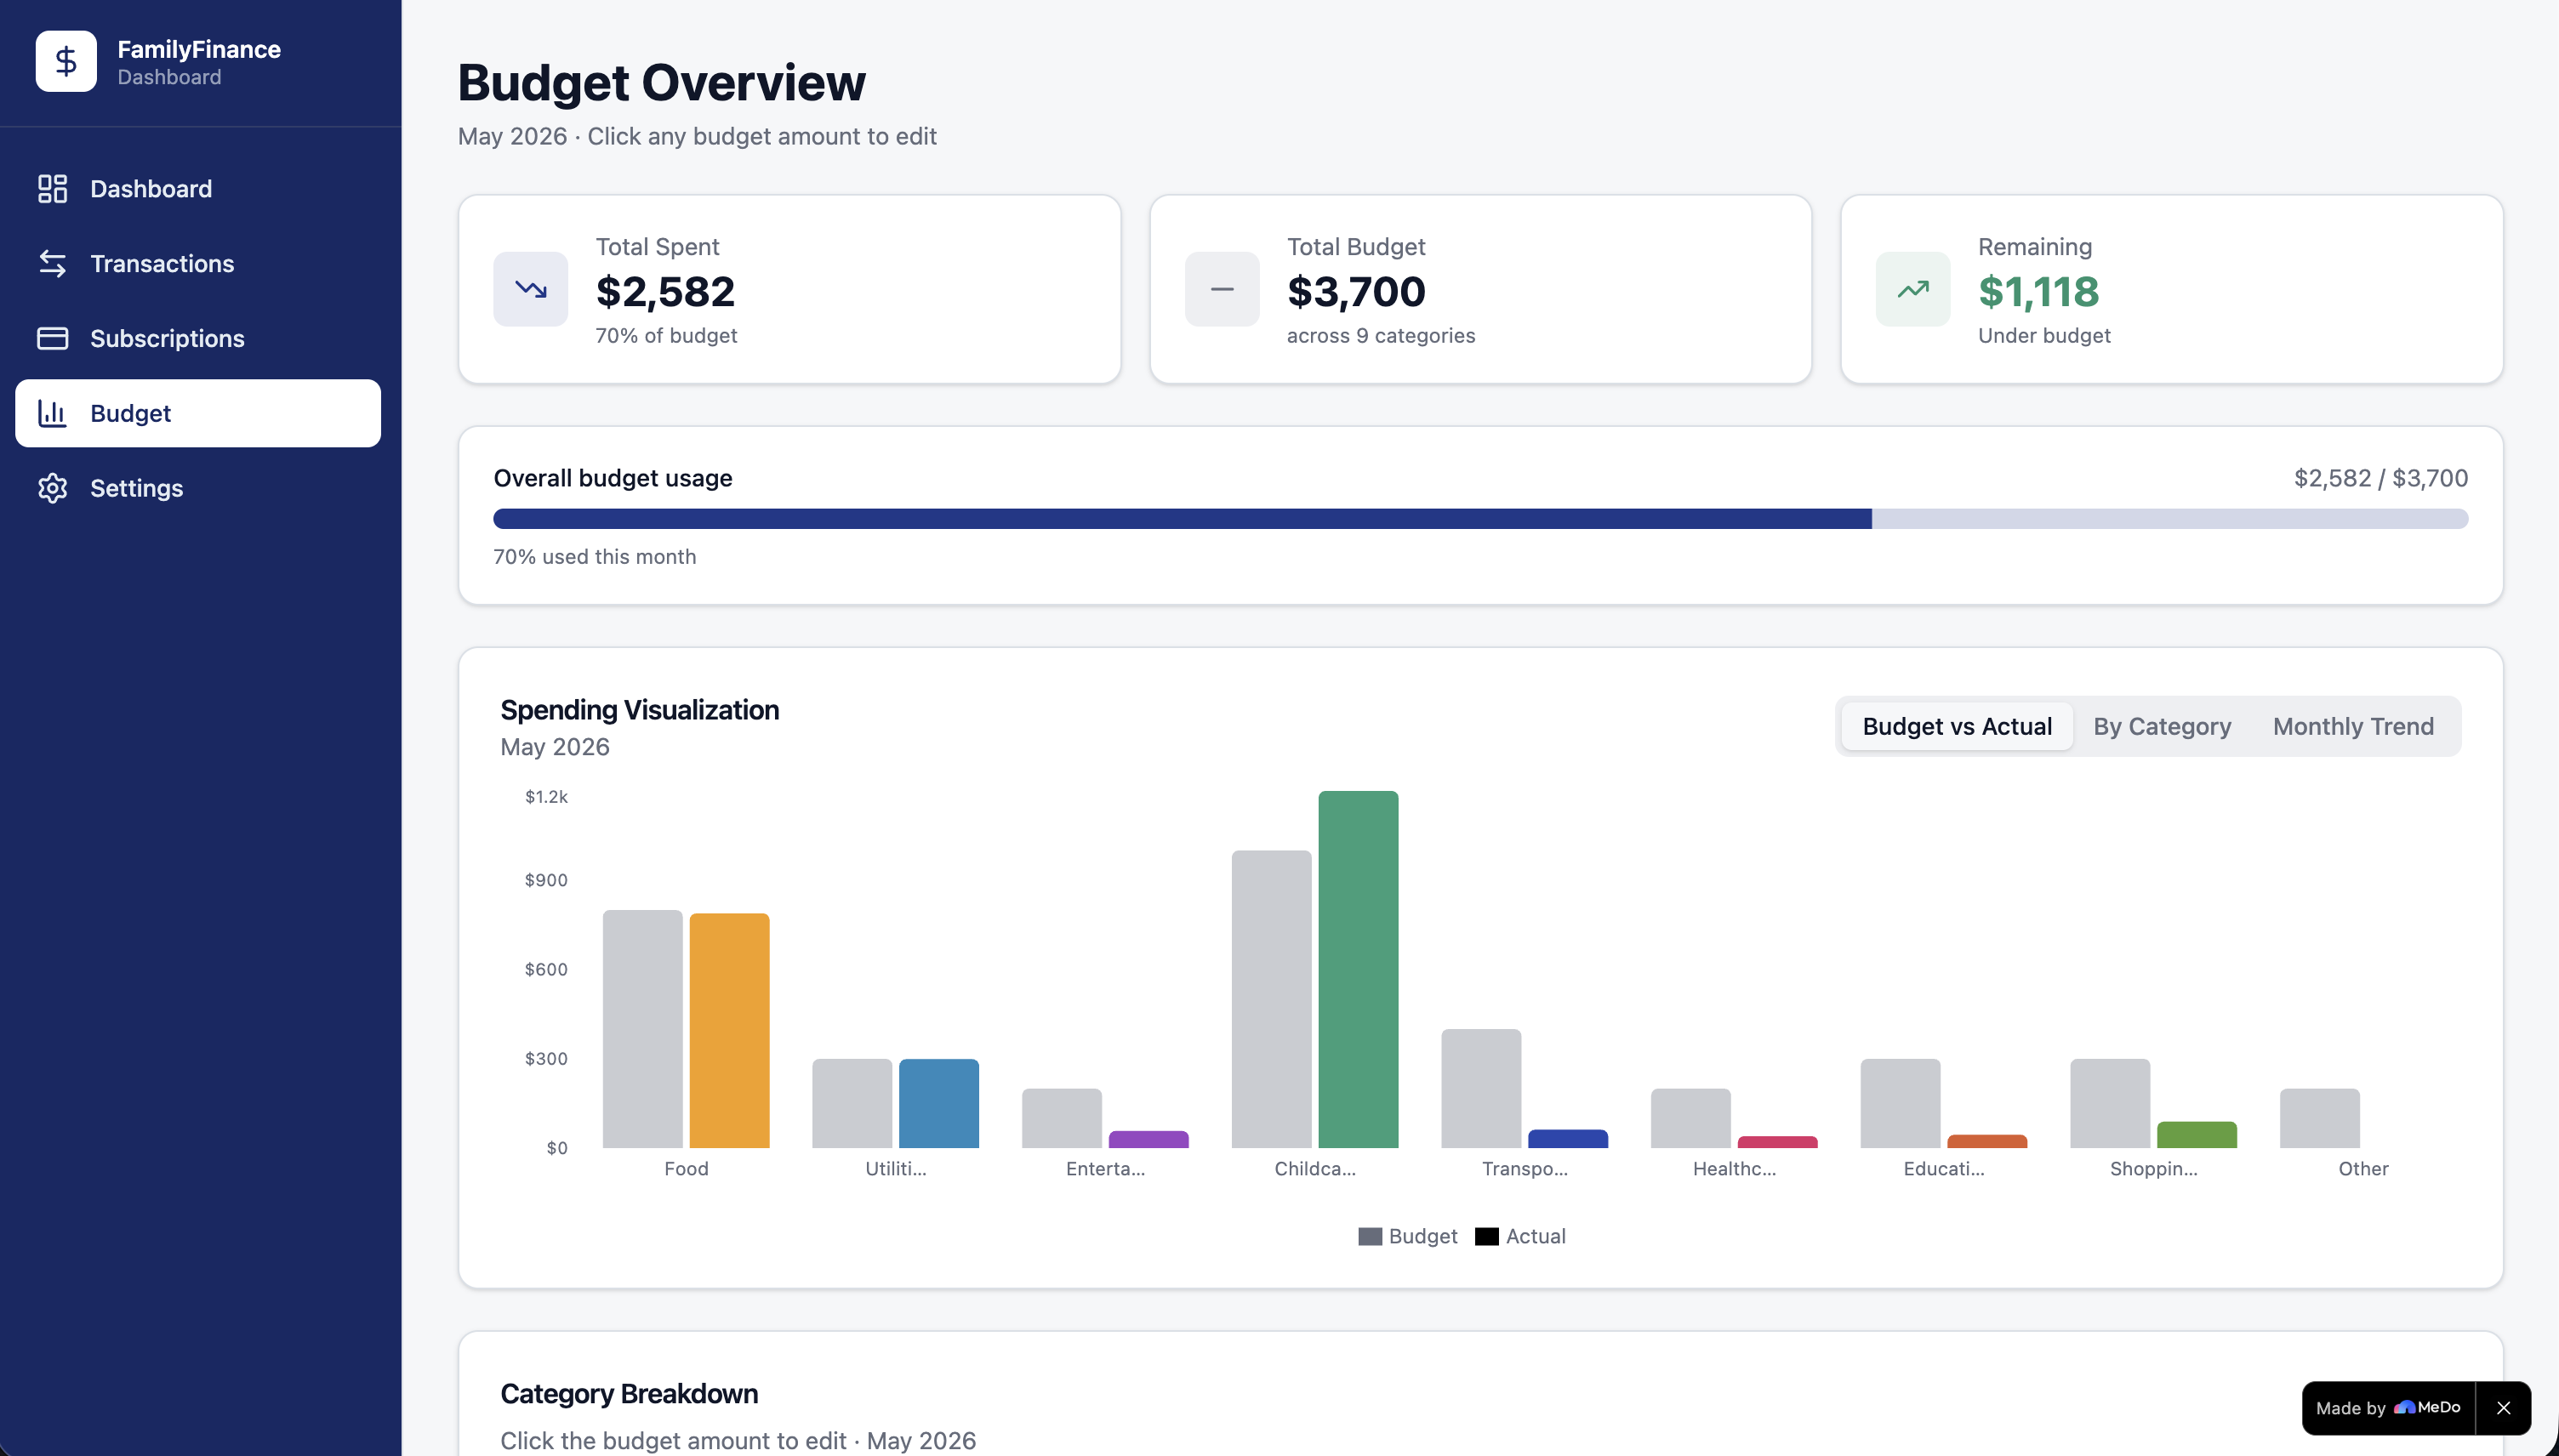
- Set and monitor budgets across up to 9 spending categories, with real-time progress bars and visual charts comparing budget vs. actuals
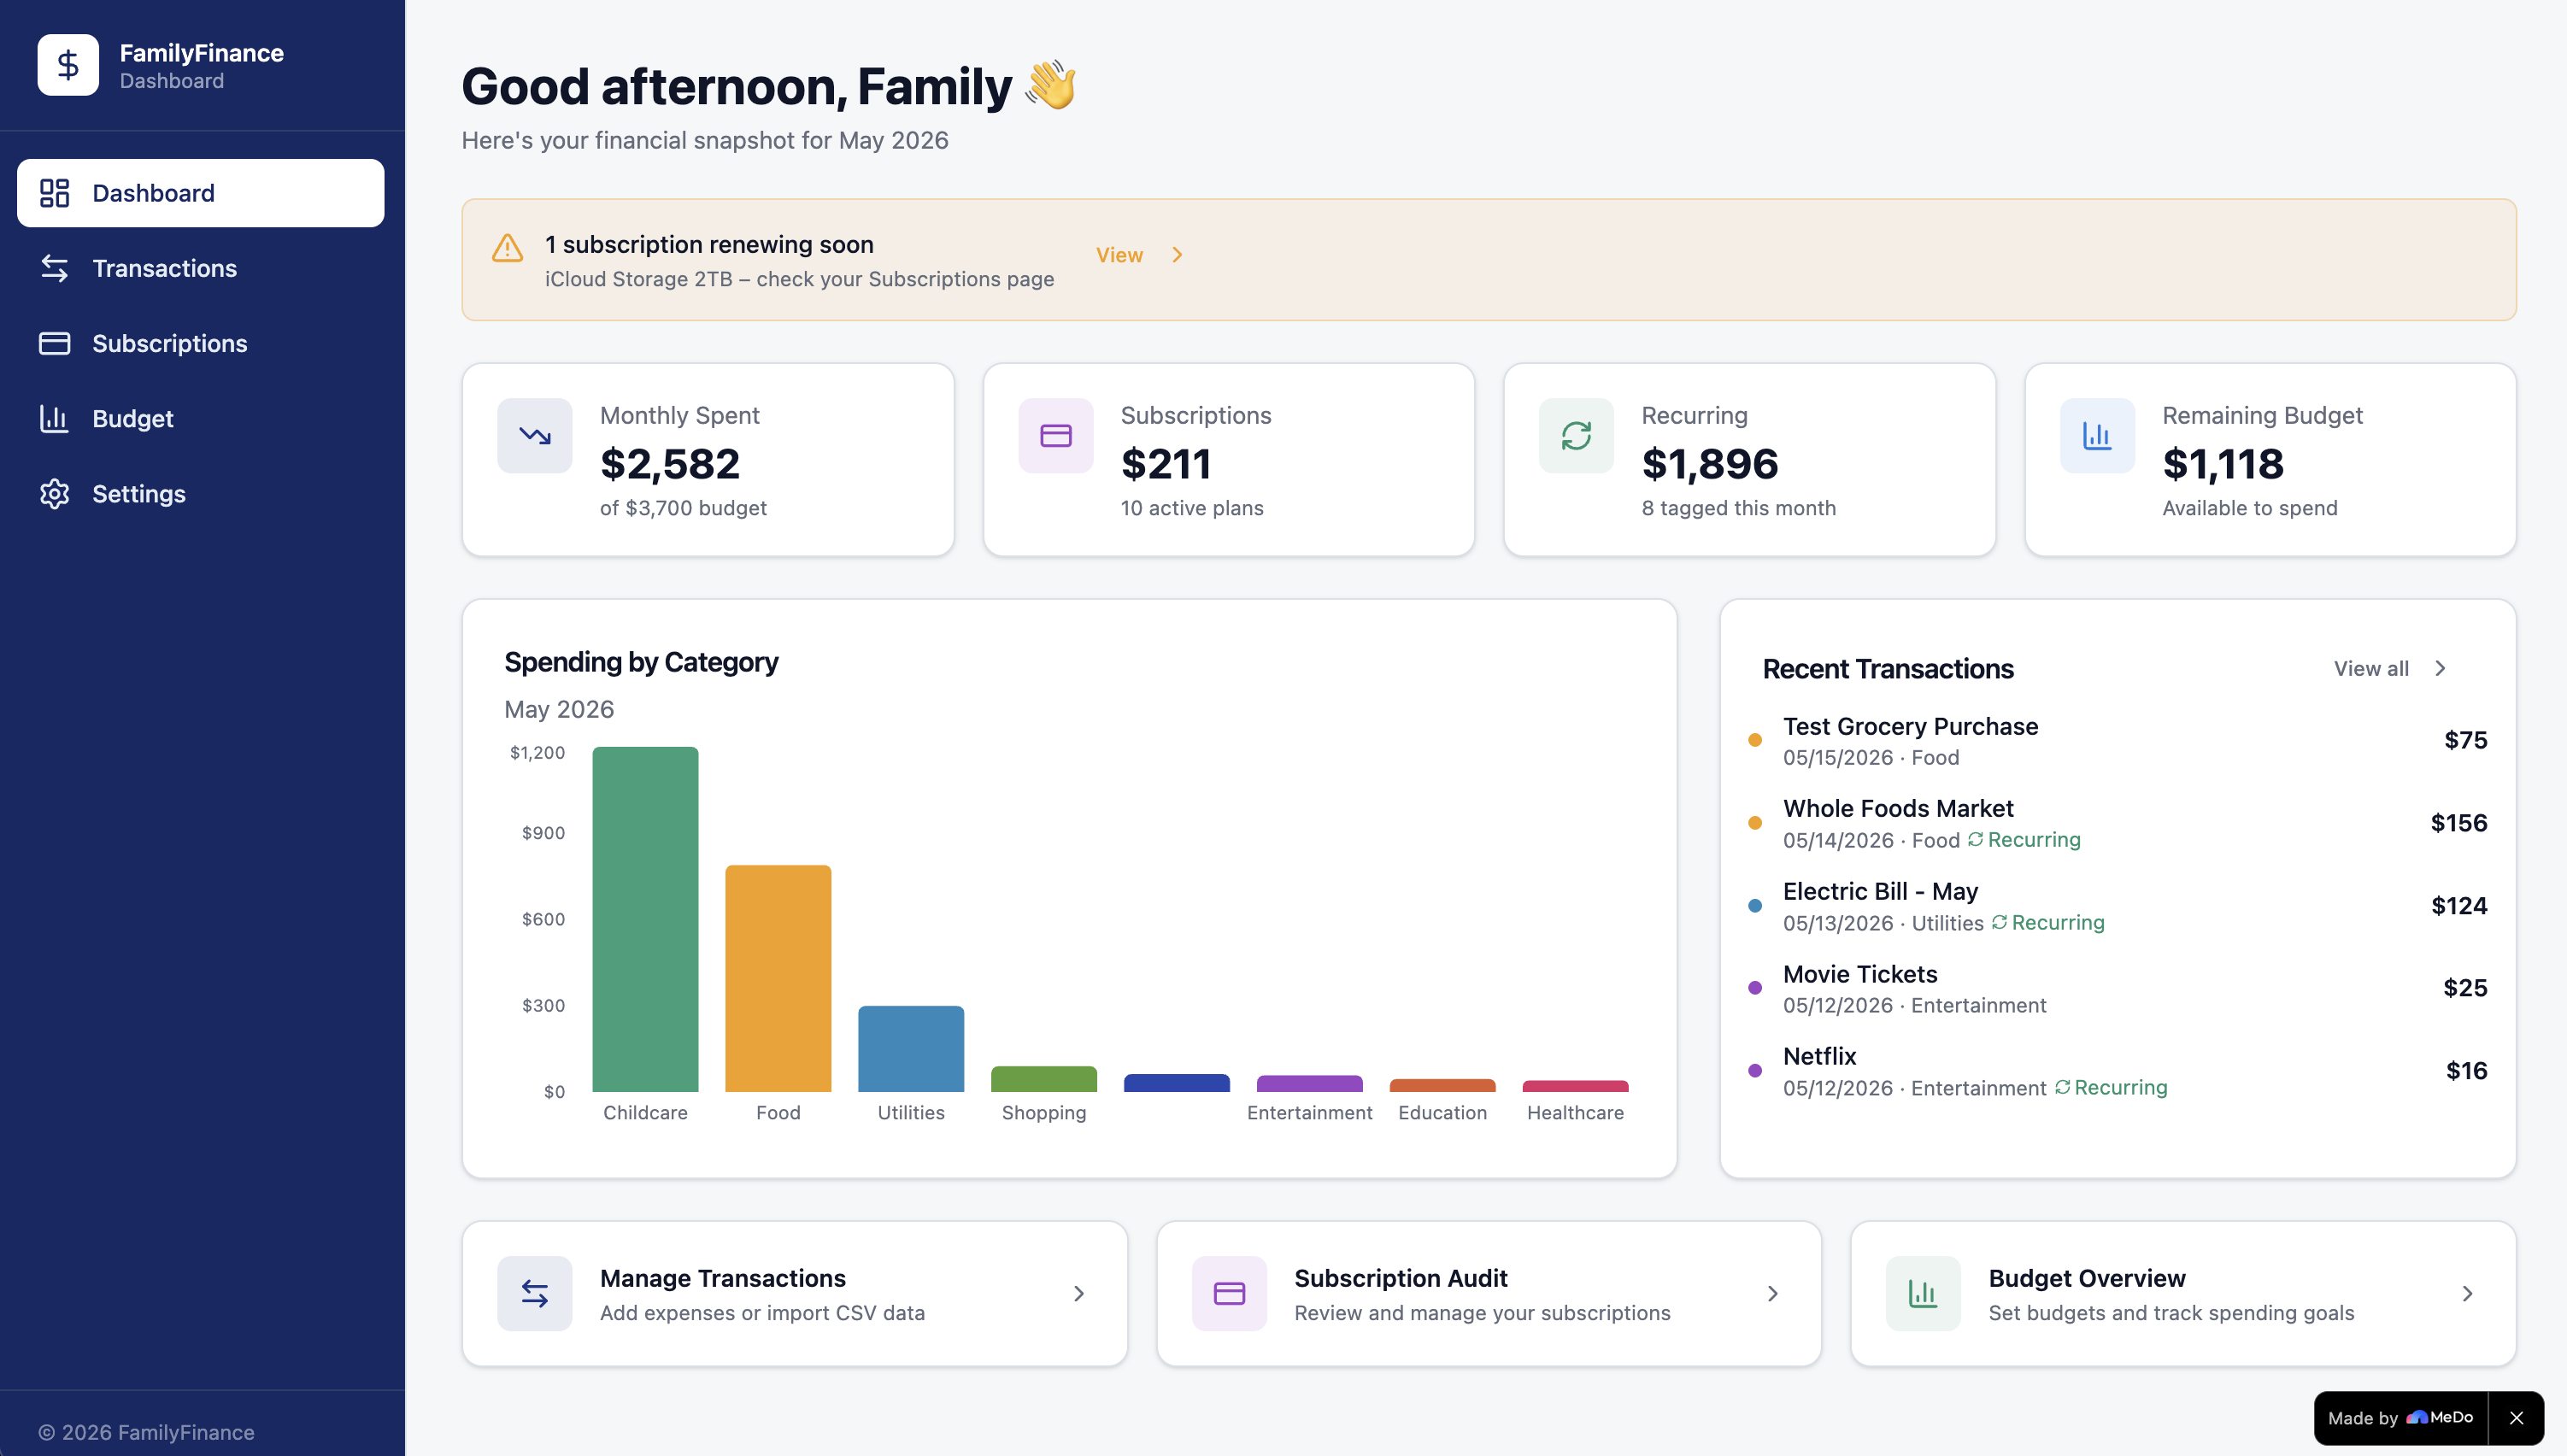
- See the full picture at a glance on the dashboard — monthly spend, remaining budget, recurring commitments, and recent transactions all in one view
The key insight the dashboard surfaces is the commitment ratio $\rho$ — the share of the total budget already locked into recurring costs before any discretionary decision is made:
$$ \rho = \frac{C_{\text{recurring}}}{B_{\text{total}}} \times 100 $$
With $C_{\text{recurring}} = \$1{,}896$ and $B_{\text{total}} = \$3{,}700$ in the current snapshot, roughly 51% of the family's budget is committed before the month truly begins.
How we built it
The app is structured around four core modules — Dashboard, Transactions, Subscriptions, and Budget — each solving a distinct pain point in family financial management.
The budget engine is built on a straightforward per-category variance model. The remaining budget $R$ across $n$ categories is:
$$ R = \sum_{i=1}^{n} \left( B_i - S_i \right) $$
where $B_i$ is the budget limit and $S_i$ is the actual spend for category $i$. A category is flagged as over-budget when the variance $\delta_i = B_i - S_i < 0$.
The subscription tracker aggregates all active plans to compute the total monthly recurring cost:
$$ C_{\text{recurring}} = \sum_{j=1}^{m} p_j $$
where $m$ is the number of active plans and $p_j$ is the monthly price of plan $j$. This figure is prominently displayed on the dashboard so families always know how much of their budget is already spoken for.
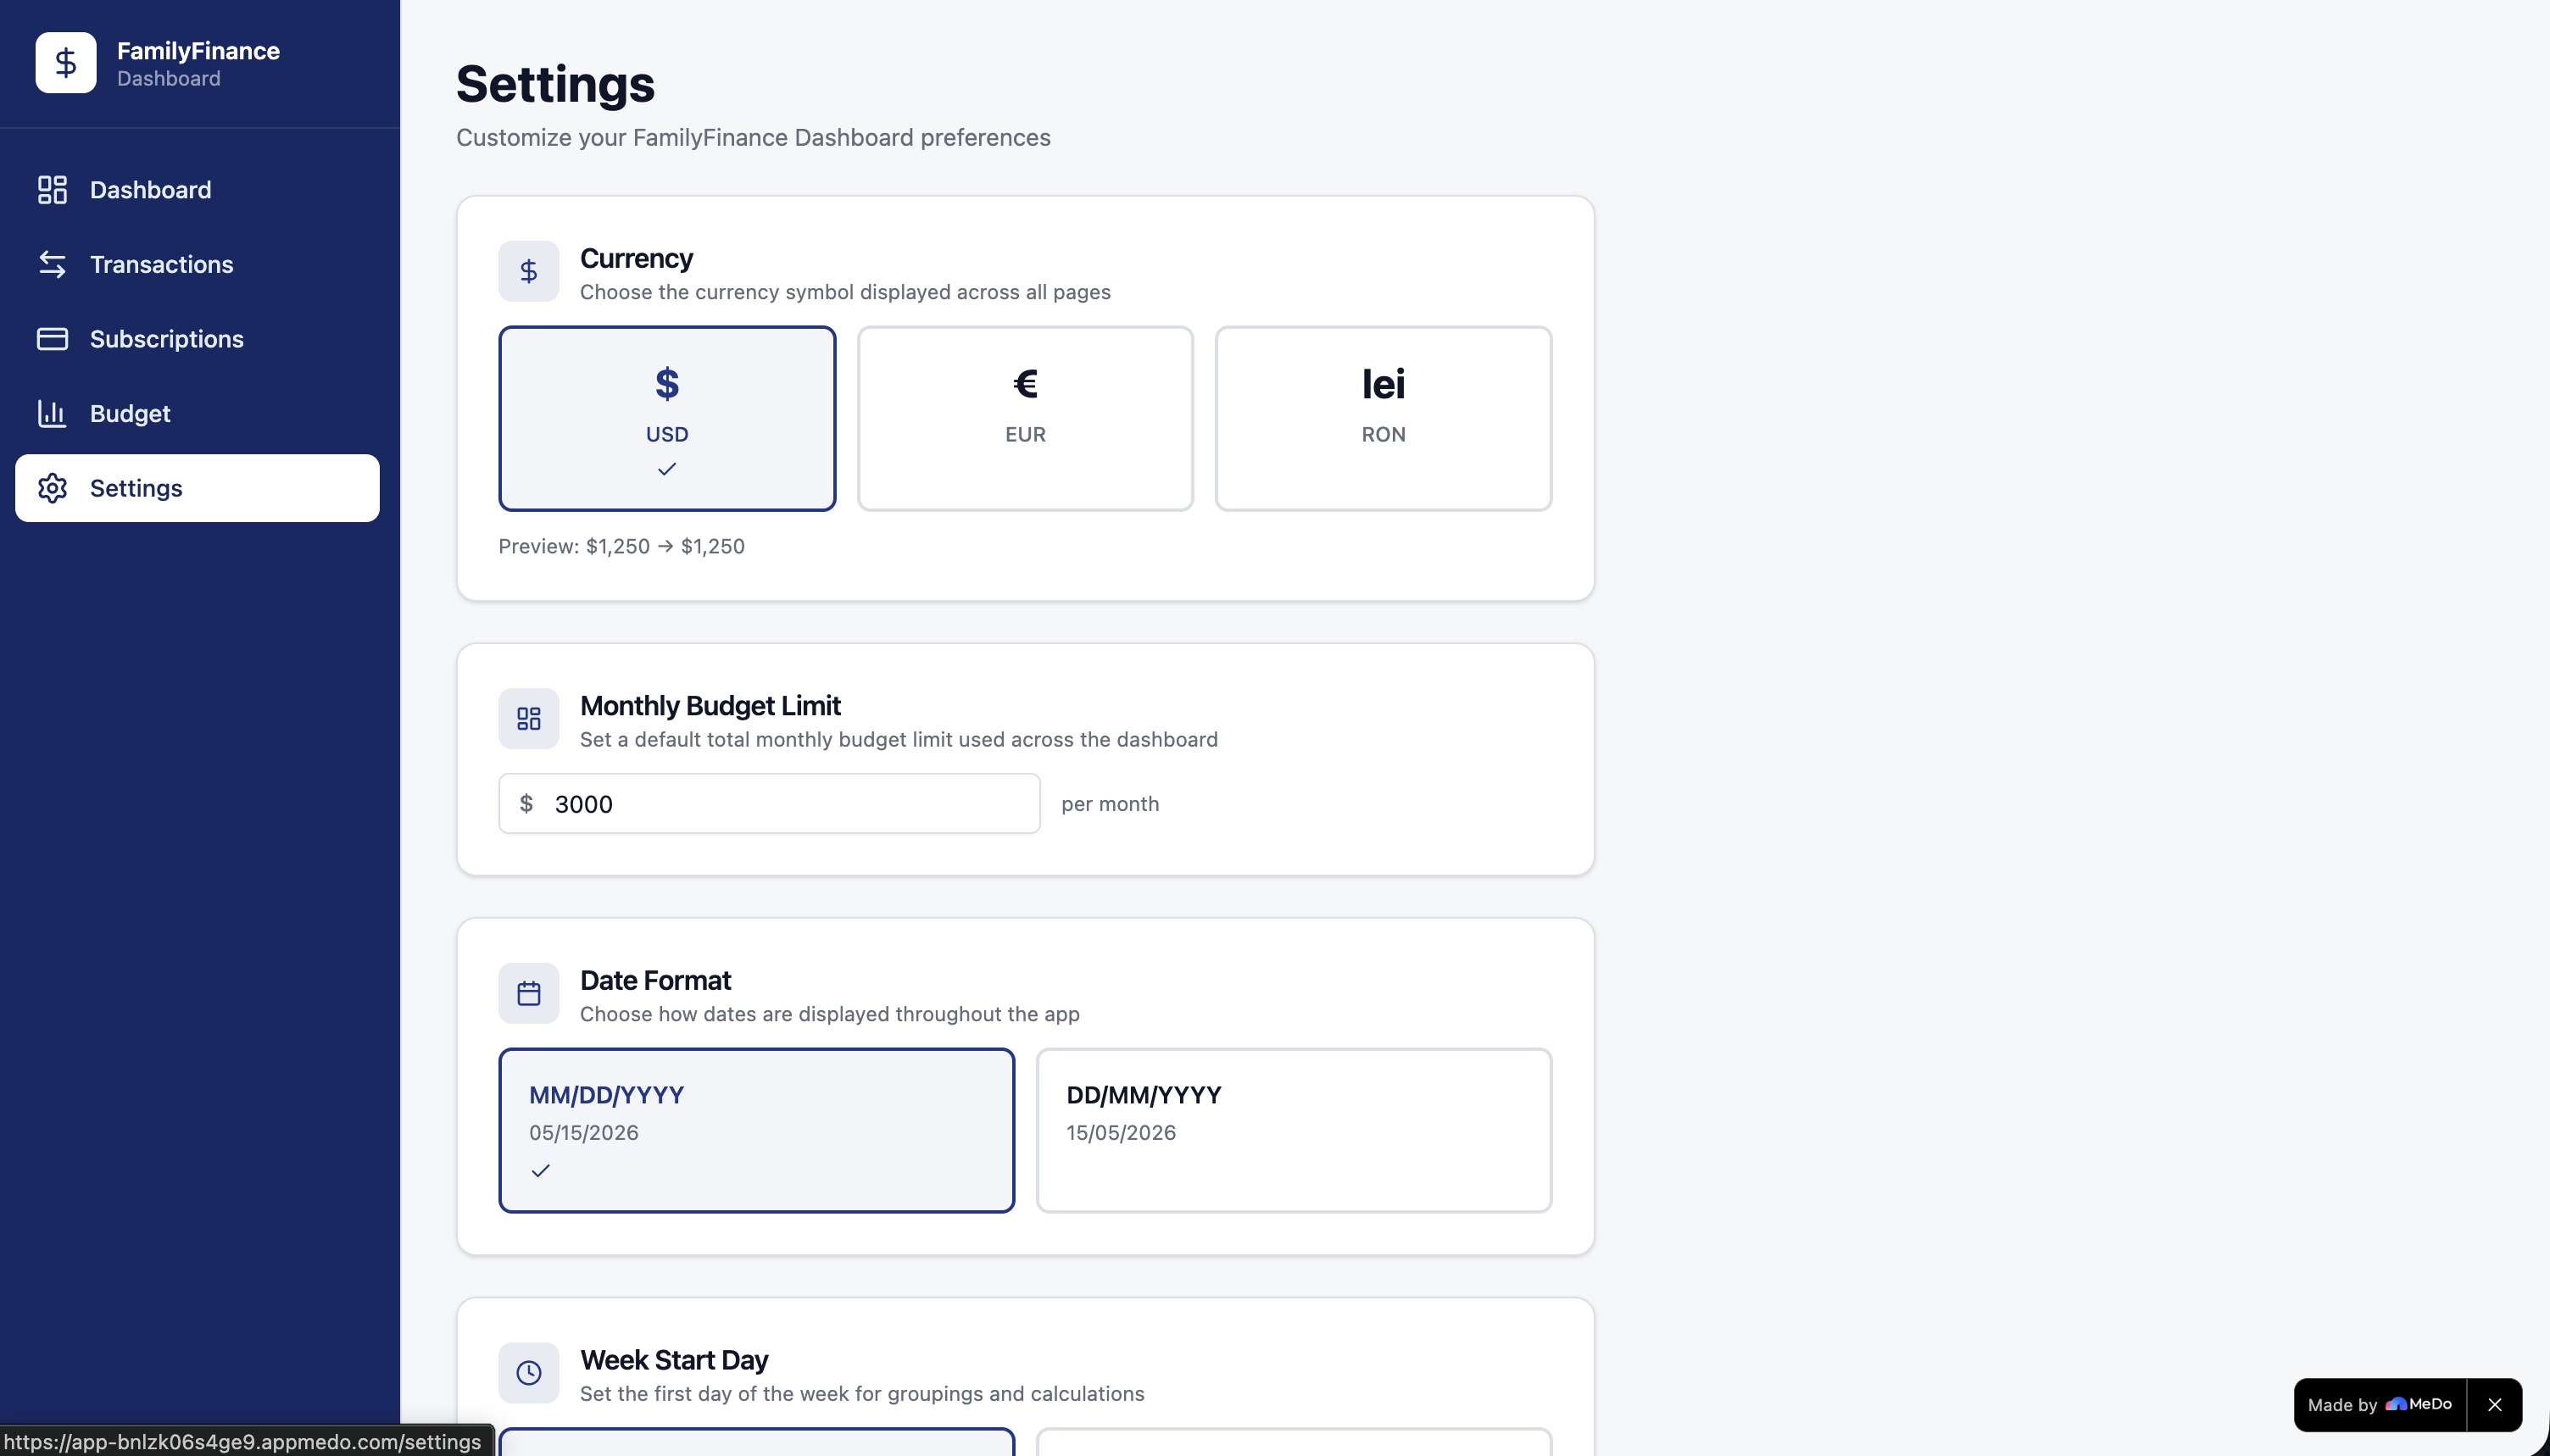
The Settings module allows customisation of currency (USD, EUR, RON), monthly budget limit, and date format — keeping the tool adaptable to different households.
Challenges we ran into
Categorisation ambiguity was an early friction point. Real-world transactions rarely arrive pre-labelled, and the line between categories is genuinely blurry — is a gym membership Healthcare or Subscriptions? We iterated through several tagging models before landing on a flexible, user-editable system.
Recurring detection proved harder than expected. Identifying whether a transaction is truly recurring — not just coincidentally similar in amount — required balancing pattern matching with user control. Over-automating it produced false positives; being too conservative meant users had to manually tag everything.
Budget psychology was a subtler challenge. Displaying a remaining budget of \$1,118 can feel either reassuring or alarming depending on framing. We learned that pairing raw figures with percentage-of-budget progress bars made the data feel actionable rather than abstract.
Designing for a household, not just one person meant keeping language and layout accessible to every member of the family, not only the person who set the budget. Every label and data point had to pass a "would a non-finance person understand this immediately?" test.
Accomplishments that we're proud of
We are proud of shipping a dashboard that genuinely reduces cognitive load around household money. The four-KPI summary row — Monthly Spent, Subscriptions, Recurring, and Remaining Budget — distils what would normally take several app switches and mental arithmetic into a single, scannable line.
We are also proud of the Subscription Audit feature. Most families are surprised by how much their subscriptions add up to once listed together. Building a workflow that helps families actively decide what to keep versus cancel — rather than just listing costs passively — felt like a meaningful step beyond typical finance apps.
Finally, the CSV import pipeline allows families to plug in real bank export data immediately, making FamilyFinance useful from day one rather than only after weeks of manual data entry.
What we learned
The single biggest lesson was that data density and clarity are in constant tension. Financial dashboards tempt you to show everything; the hardest design decisions were about what to leave out.
We also learned how important the distinction between recurring and one-off spending is for real-world budgeting. Recurring costs are invisible in most month-end summaries — they blur into the total and lose their identity. Making them a first-class metric changed how we thought about the entire product.
On the technical side, building the budget visualisation taught us that the same number can tell completely different stories depending on how it is displayed. A spend of \$800 on Food means little on its own; paired with a \$900 budget limit and shown as an 89% fill bar, it becomes immediately meaningful.
What's next for FamilyFinance
The most requested feature is multi-member support — shared household accounts where each family member can log their own transactions, and the dashboard aggregates them automatically.
We also want to add predictive overspend alerts. Using a simple linear projection, we can estimate end-of-month spend for each category:
$$ \hat{S}i = S_i^{\text{current}} \cdot \frac{D{\text{month}}}{D_{\text{today}}} $$
where $D_{\text{month}}$ is the total days in the month and $D_{\text{today}}$ is today's day number. When $\hat{S}_i > B_i$, an early warning is triggered — giving families time to adjust before they actually overspend, not after.
Longer term, we envision savings goal tracking, bill-due reminders, and a year-in-review summary that helps families reflect on their financial habits and set better budgets for the year ahead. The mission stays the same: less financial anxiety, more financial clarity — for the whole family.
Built With
- react
- supabase
- typescript
- vite

Log in or sign up for Devpost to join the conversation.