-
-

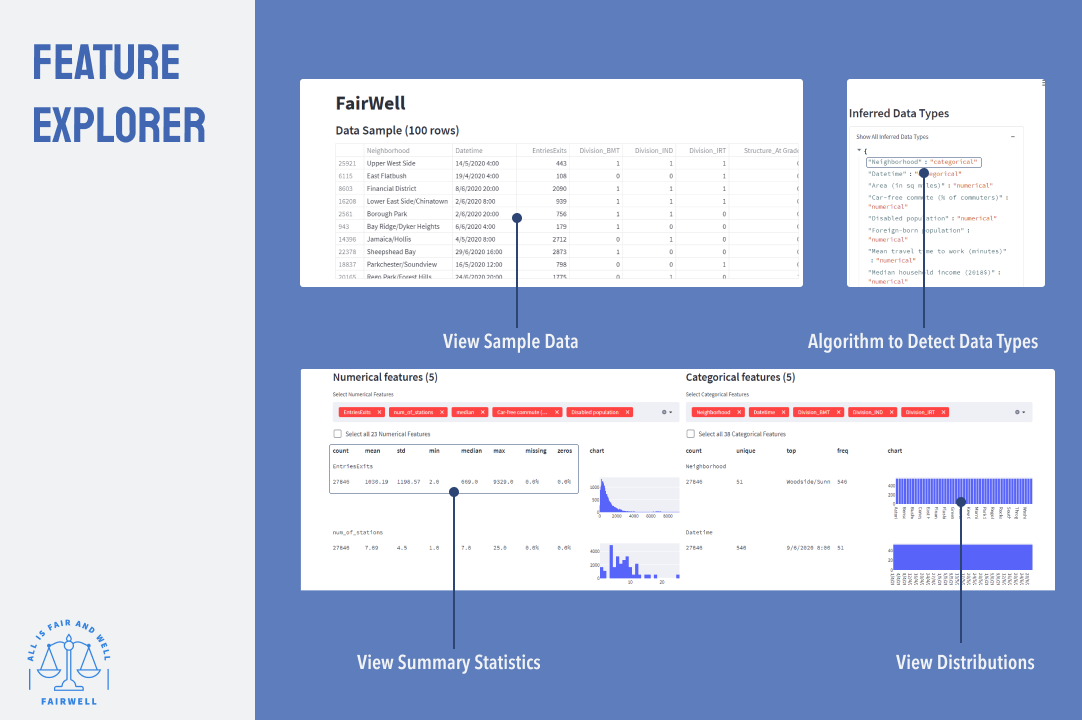
Quickly view the distributions of their dataset, as well as the summary statistics for each feature
-

Identify and execute mitigation techniques to reduce bias before training the model
-

Identifying bias from the model after it is trained

Inspiration
The problem of defining and addressing fairness has been a topic of increasing importance in the recent years. Especially with work surrounding machine learning. Multiple definitions of fairness have been raised, each having their own pros and cons. This work does not aim to propose a single notion of fairness but rather we aim to (i) provide tools on how to measure and assess fairness and (ii) how to mitigate bias in models where necessary.
Businesses have recognised the need to develop AI models that are responsible and fair towards their data inputs. Facebook, too, understands the importance of responsible AI as it can help mitigate concerns surrounding privacy, fairness, accountability and transparency in its algorithms. They set up a cross-disciplinary Responsible AI (RAI) team to ensure Machine Learning systems are designed and used responsibly. The team has since released Fairness Flow, an internal tool to assess AI fairness.
"Fairness Flow lists four definitions (of fairness) that engineers can use according to which suits their purpose best, such as whether a speech-recognition model recognizes all accents with equal accuracy or with a minimum threshold of accuracy."
What it does
FairWell is a Responsible AI tool developed using Streamlit. The aim is to address model biasness on specific groups of people, allowing data scientists to evaluate their dataset and model predictions, and take steps toward making their datasets more inclusive and their models less biased. The tool allows users to detect fairness issues in both datasets and models, and in turn, get inspiration on various mitigation approaches through mitigation recommendations.
How we built it
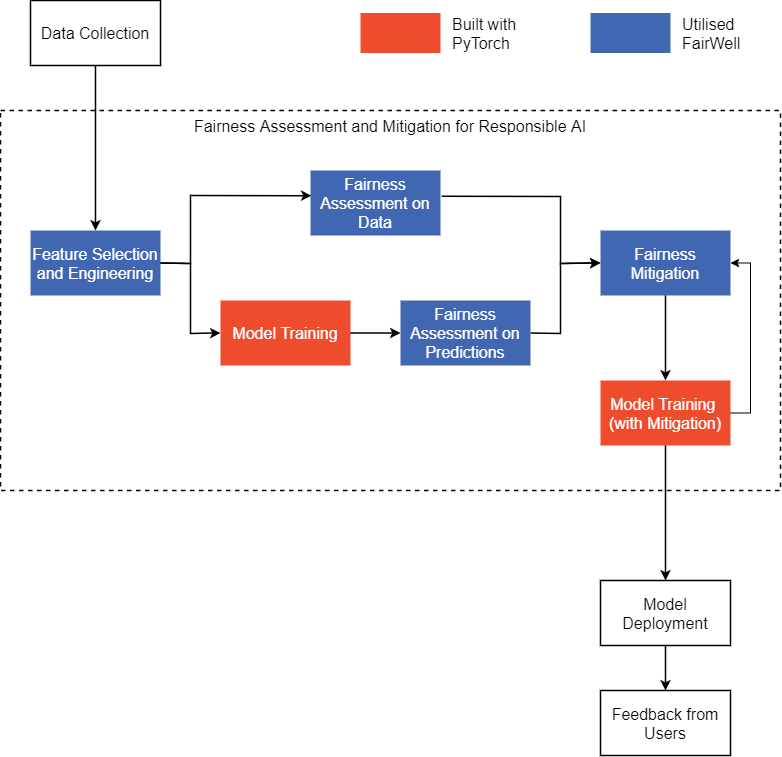
FairWell automates areas in the machine pipeline where fairness assessment and mitigation can be automated, to reduce friction faced by data scientists when developing Responsible AI models.
Our work can be summarised as below:
- Fairness assessment
- On data
- On model predictions
- Bias mitigation
- Pre-processing by transforming the data
- In-processing by imposing constraints during training
- Post-processing where the predictions of models are modified
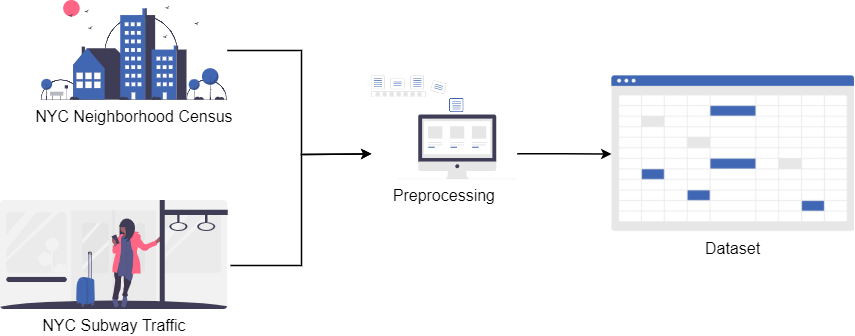
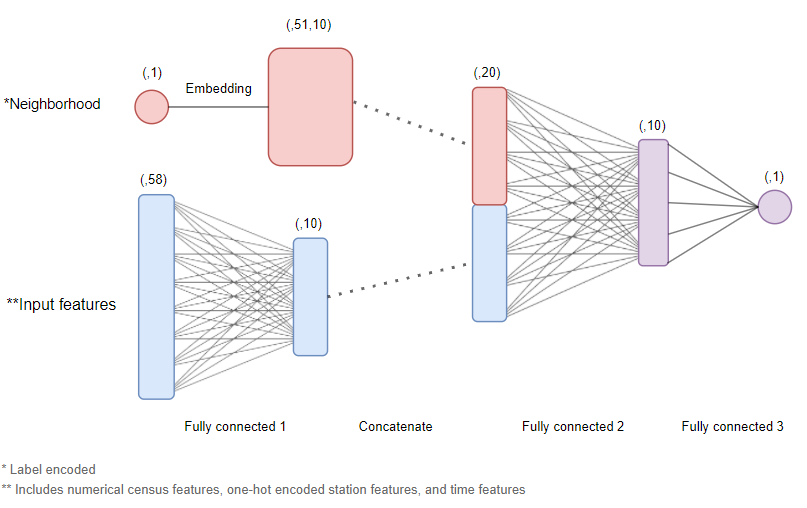
Recognising the need for a demo, the New York City Subway Dataset which contains both neighbourhood census data and subway traffic data is used as an example. A PyTorch model is built using the dataset, then assessing the fairness the data and model predictions were done, followed by iterating through various mitigation approaches to build fairer PyTorch models.
The dataset we selected consists of subway traffic in NYC, along with neighbourhood census data of the city. It is hosted on Kaggle by Edden, who has performed preprocessing steps to convert the raw data provided by The Metropolitan Transportation Authority (MTA), North America's largest transportation network. The census data is from NYU Furman Center's New York City neighbourhood Data Profiles and the neighbourhood data is from University of Berkeley GeoData Library.
Approach
The baseline model is built for a time series binary classification problem to predict whether subway traffic is high or low.
Pipeline Overview
Feature Explorer
The FairWell feature explorer page allows users to quickly view the distributions of their dataset, as well as the summary statistics for each feature. An algorithm is created to quickly infer the data types of each feature, categorising them into either numerical or categorical. Based on the data type, a histogram or bar chart will be shown for numerical or categorical data type respectively.
Dataset
Our final dataset contains the following features:
| Features from neighbourhood Census Data | Features from Subway Dataa |
|---|---|
| neighbourhood Car-free commute (% of commuters) Disabled population Foreign-born population Median household income (2018\$) Median rent, all (2018$) Percent Asian Percent Hispanic Percent Black Percent white Populationc Poverty rate Public housing (% of rental units) Unemployment rate Residential units within 12 mile of a subway station Population density (1,000 persons per square mile)c Serious crime rate (per 1,000 residents) Severely rent-burdened households Rental vacancy rate Mean travel time to work (minutes) |
Datetime Stop Name Connecting Linesb Divisionb Structureb Boroughb neighbourhood Entriesd Exitsd |
a Used to derive "Number of Stations" feature
b One hot encoded features
c Used to derive ""neighbourhood Area Size"" feature
d Used to derive "EntriesExits" target feature
Data Fairness Assessment
Recall that bias can occur in the data even prior to training a model. To identify potential bias arising from data, we pass our cleansed dataset into the FairWell Featurer Explorer page, to generate the distributions and statistics of our dataset.
Based on this analysis, we then identified a number of features that could be potentially sensitive. For example, we noticed that some neighbourhoods had as much as 74.1% of the population made up of Hispanic citizens, while others had as little as 3.7%. This large disparity in values could be a point of concern.
These features were binned into binary features by using the mean as the threshold. The binned dataset is then uploaded onto the FairWell Data Fairness Assessment page where all features were evaluated based on the Class Imbalance and Jensen-Shannon Divergence metrics for fairness. The features with the highest Jensen-Shannon Divergence were then identified for potential bias mitigation later on.
In FairWell, the fairness metrics below will be calculated for each feature:
- Class Imbalance (CI): Identifies any under representation of classes within the dataset
- Jensen-Shannon Divergence (JS): Measures label imbalance between 2 classes by measuring their similiarity between their probability distributions
A scatter plot which plots the selected fairness metric for each subgroup pairing within the feature is shown. All user uploaded datasets' metrics will be plotted on the same scatter plot to allow for ease of comparison.
Modelling with PyTorch
PyTorch was then used to build a baseline neural network model.
The dataset we are working with is a 2-dimensional dataset, consisting of both spatial and temporal dimensions; also frequently known as "panel” data. Other approaches to similar problems often include more complex architectures involving LSTMs, CNNs or transformers. However, in this use case, we opted to keep things simple by using a standard multi-input feedforward network.
Fairness Assessment on Model Predictions
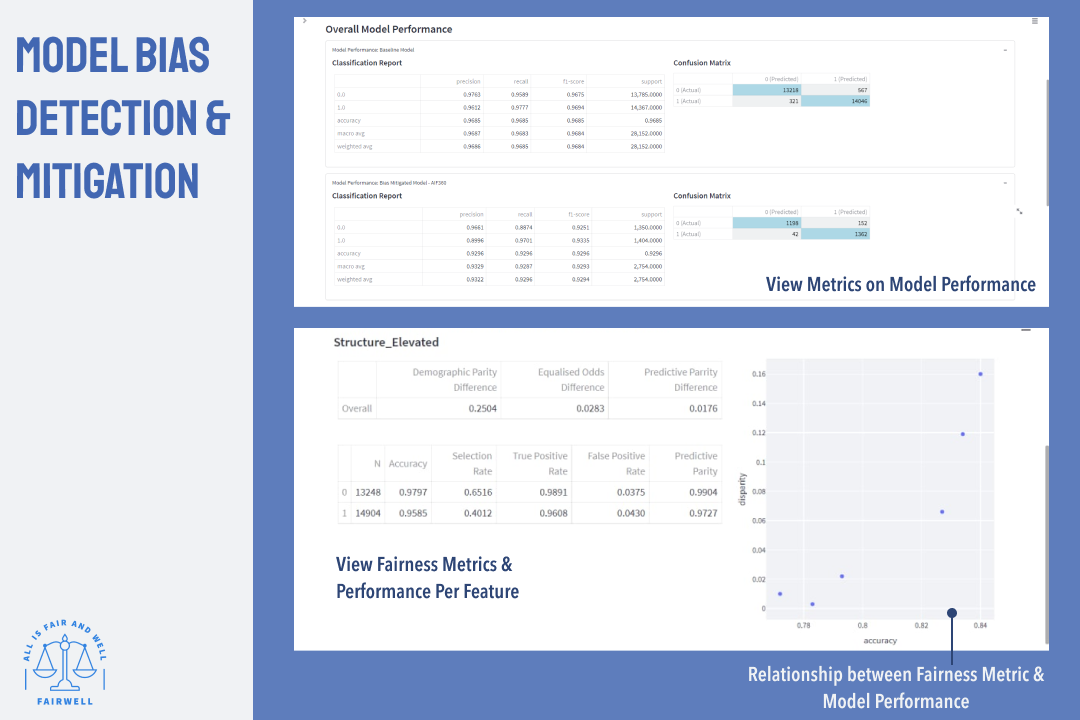
In FairWell, the inference process will then kick off for every model, returning predictions as outputs. With both the ground truth (target) and the predictions, each model's performance will be calculated, along the following fairness metrics for every feature:
- Demographic Parity (DP): Measures the same positive prediction ratio across groups identified by the sensitive features.
- Equalized Odds (EO): Measures the equality in terms of error rate. Same false positive rate and false negative rate across sensitive groups identified.
- Predictive Parity (PP): Measures the error rates in terms of fraction of errors over the ground truth. The model should have the same precision across sensitive groups.
A scatter plot that plots the relationship between the selected fairness metric and each model's performance will be shown. This is coupled with an expandable insights section, allowing users to evaluate the potential trade-offs from their models and fairness.
Lastly, the page will compare the aforementioned fairness metrics of each feature selected for fairness assessment, providing users with useful mitigation approaches they can take towards fairer model development. After applying fairness mitigation, users can revisit this page with a new dataset and model for comparison against their previous iterations.
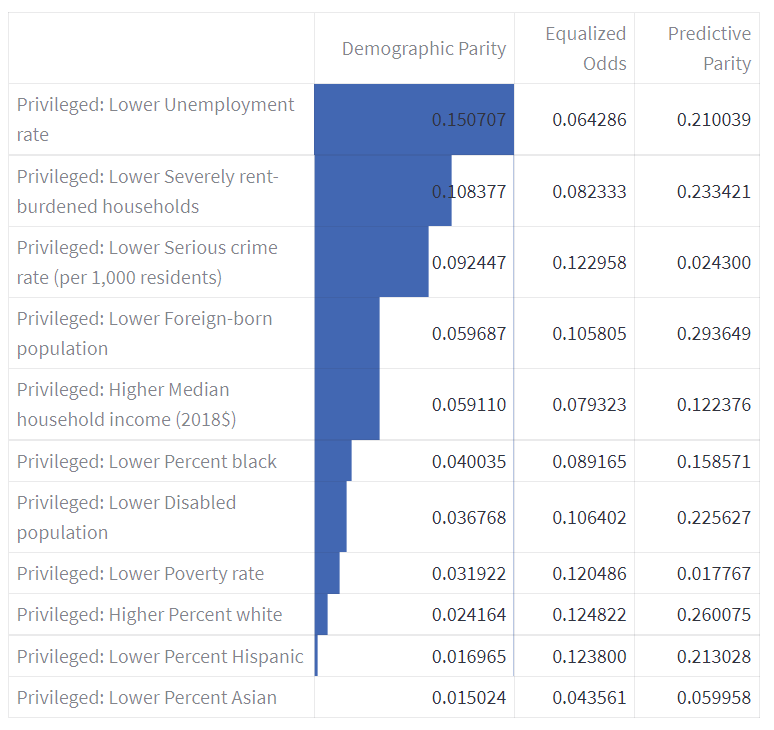
Back to the model, the baseline trained model, testing dataset and feature list were then uploaded onto the FairWell Model Bias Detection & Mitigation page. Inference is then run automatically within the FairWell environment to generate the following fairness metrics for our baseline model predictions: Demographic Parity, Equalized Odds and Predictive Parity. Here, the metric we focused on is Demographic Parity, making sure each subgroup receives a positive outcome at an equal rate.
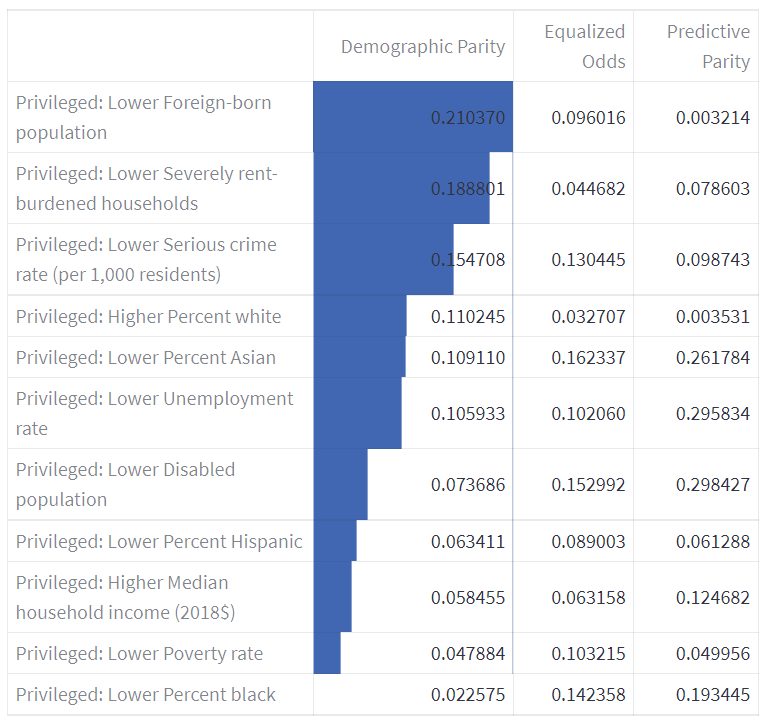
Based on our assessment of both data fairness and model fairness, we narrowed down to a list of features that exhibited both high Jensen-Shannon Divergence and high Demographic Parity disparity. On the top of that list was the Privileged: Lower Foreign-born population feature, with a score of 0.0264 max Jensen-Shannon Divergence and 0.2251 Demographic Parity.
The following mitigation approaches were performed independently (more details on the following section):
- Undersampling (pre-processing mitigation)
- Reweighing (pre-processing mitigation)
- Demographic Parity Loss (in-processing mitigation)
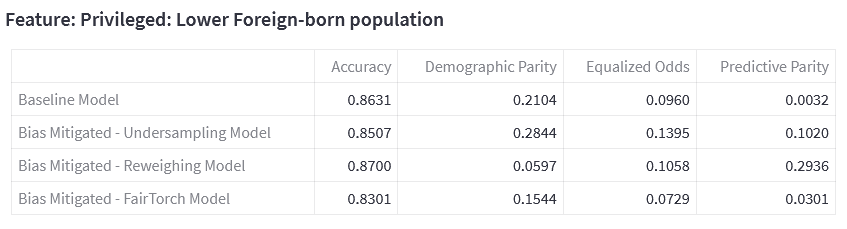
With Privileged: Lower Foreign-born population as the sensitive feature, undersampling was applied to the dataset (pre-processing mitigation) and demographic parity loss (in-processing mitigation) was utilised during model training. The mitigation approaches are applied separately, thus the resulting datasets and models are independent of each other.
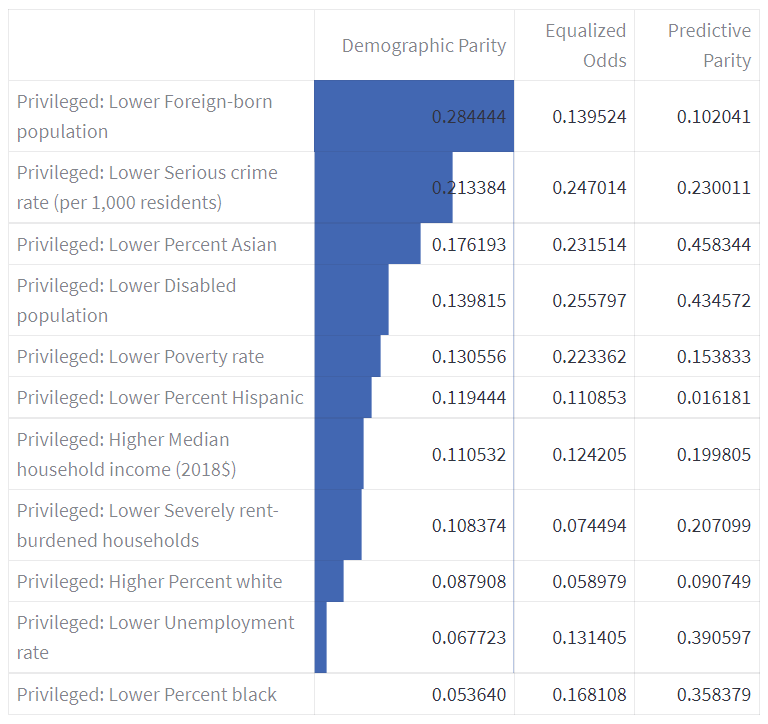
Comparing Demographic Parity, the undersampled dataset did not perform as well on the sensitive feature, with a higher Demographic Parity score of 0.284. This could be attributed to a small number (about 50) of neighbourhoods, which can in turn affect the undersampling technique utilised.
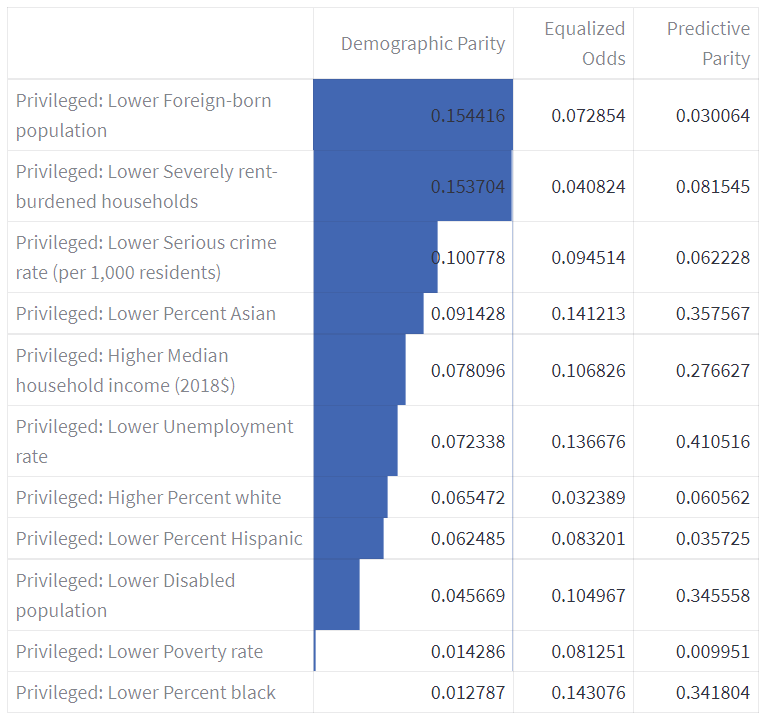
As for the reweighing (pre-processing mitigation) approach, we took all 11 features into account to generate weights for each observation.
Comparing the Demographic Parity for each feature, all of the values were lower. This indicates that the model predictions are fairer, compared to the baseline dataset.
Fairness Mitigation
Based on our Responsible AI Research, we have identified two approaches in mitigating bias, pre-processing the dataset and in-processing where we impose a fairness loss constraint during model training. In our example use case, we tried 3 of those approaches. For all datasets, time-based features were generated and min-max transformation of numerical features and label encoding of categorical features was conducted.
Pre-processing
Reweighing17
- In this approach, we used IBM's AI Fairness 360 package to generate weights for each (sensitive feature, label) pair and assigned them to each observation.
- These per-sample weights were then passed into the model and computed as part of the loss function, allowing the model to prioritize certain observations during training.
Under-sampling17
- In this approach we used the Imbalanced Learn package to correct class imbalance in the sensitive feature by randomly undersampling neighbourhoods belonging to the majority class. This was done in order to ensure an equal representation in both privileged and underprivileged groups.
- The undersampled dataset was then fed into the model.
In-processing
- Fairness loss constraint
- In this approach, we borrowed the work of the FairTorch team to incorporate a group-fairness constraint into our loss function, allowing the model to optimize on a combination of both BCELoss and Demographic Parity.
- For our example model, a value of alpha=0.5 was identified to achieve the best balance between the two.
Effect of Mitigation Approach
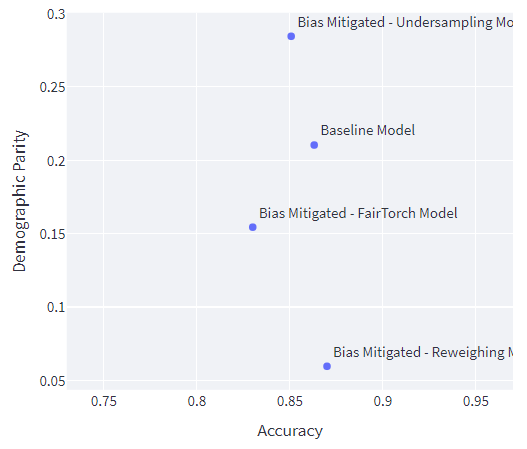
All 4 of our trained models (1 baseline, 3 post-mitigation) were then again uploaded onto the FairWell Model Bias Detection & Mitigation page, for a side-of-side comparison of the models' metrics.
From FairWell, we found that there was a trade-off between accuracy and fairness, where generally models that are more accurate tend to also exhibit a larger amount of bias. The selection of which model to use is hence highly subjective and varies on a case-by-case basis, depending on the priorities of the project.
The scatterplot below will further illustrate how one might intepret the results for a specific sub group - Privileged: Lower Foreign-born population.
Demographic Parity
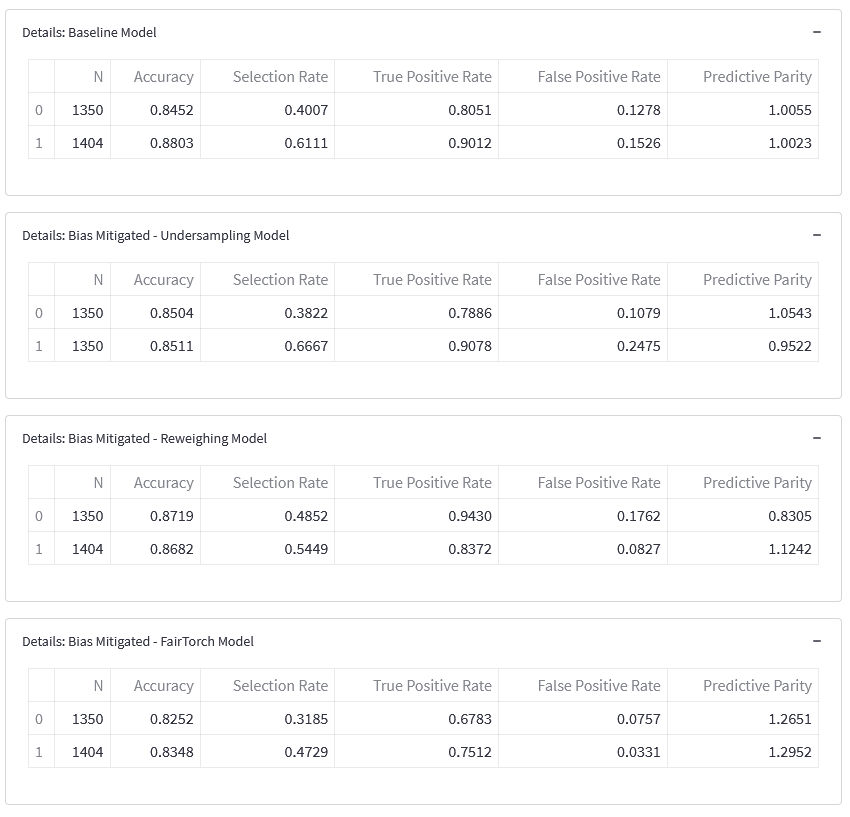
By using the mitigations steps described earlier, we observe that generally, there's a trade-off between accuracy and demographic parity. The baseline model is biased towards neighbourhoods with lower foreign born population. Comparing the selection rate, we can see that it is higher (0.611 vs 0.401) for neighbourhoods with lower foreign born population.
Comparing the selection rate for reweighing model and baseline, we can see that the reweighing model is less biased towards neighbourhoods with lower foreign born populations (0.545 vs 0.611). On the flip side, it is less biased against with neighbourhoods without lower foreign born populations (0.485 vs 0.401). Comparing the DP for both models, the model with reweighted data has lower DP compared to the baseline (0.060 vs 0.210). Both accuracy and disparity improved compared to the baseline.
Comparing the selection rate for DP loss contrained model and baseline, we can see that the DP loss constrained model is less biased towards neighbourhoods with lower foreign born populations (0.473 vs 0.611). On the flip side, it is more biased against with neighbourhoods without lower foreign born populations (0.319 vs 0.401). Comparing the DP for both models, the model with DP loss constrain has lower DP compared to the baseline (0.154 vs 0.210). In this case, the accuracy decreased while the disparity increased.
Although here we can observe that the undersampling bias mitigation technique has resulted in a higher DP than the baseline model. Comparing the DP for both models, the model with under sampled data has higher DP compared to the baseline (0.284 vs 0.210). Both accuracy and disparity decreased.
This showcases how bias mitigation techniques are subjective and requires an iterative process that acknowledges the trade offs between accuracy and fairness
Equalised Odds
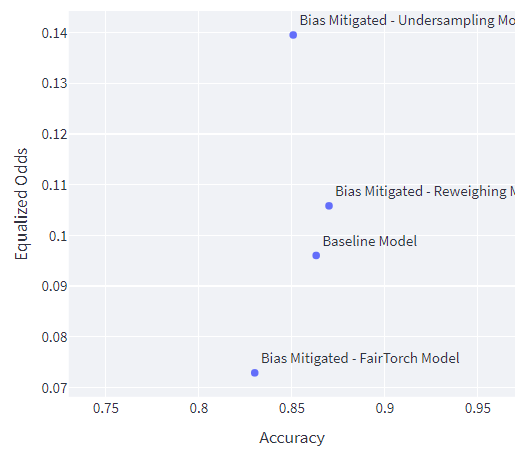
Compared to the baseline model, the under sampling model and the DP loss constraint model performed worse off in accuracy. However, the reweighing model performed slightly better than the baseline.
Looking at the EO disparity scores only the DP loss constrained model is fairer than the baseline model.
Predictive Parity
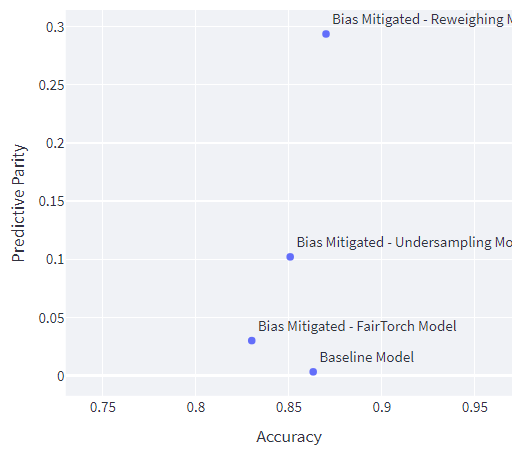
Compared to the baseline model, all the models have higher PP disparity scores.
Looking at the PP disparity scores, the baseline model is the fairest model.
Challenges we ran into
Our implementation process involved us utilizing new technologies. Most of our team were new to PyTorch and the 60 minute tutorial helped us familiarize ourselves with the package. Our team had to research extensively on other new technologies such as StreamLit, FairTorch and AIF360 in a short period of time to implement into our solution. This was extremely time consuming and tedious as we had to dig into the documentation to discover the limitations of these tools and pivot our implementation plan accordingly.
We did not have a subject matter expert on AI Fairness in our team, thus we had dive deep into documentations on the topic. Sieving through all the resources available posed a challenge without an SME to validate our findings. Even after we have gained a fair understanding of AI Fairness, we have found that the topic itself is subjective. Fairness assessment is specific to each use case. Fairness does not have one single definition and varies across different situations and scenarios. This poses as a challenge when researching on the various metrics and mathematics involved in assessing bias. This took many iterations of trial and error with different technologies, even to the point of implementing the mathematical formulae from scratch.
Accomplishments that we're proud of
We created a framework for building Responsible Machine Learning Models, providing structure to the subjective process of integrating fairness into machine learning pipelines. Furthermore, with our fully functional, user-friendly, and interpretable web application, we have made AI Fairness accessible to all.
What we learned
We gained greater awareness on the importance of AI Responsibility and will continue to be more conscious of integrating it into the machine learning life cycle.
What's next for FairWell: A Tool to Bid Goodbye to Unknown AI Biasness
FairWell provides a holistic approach to incorporating Responsible AI practices into their machine learning workflows. We will continue to integrate and improve on FairWell in future. This includes making FairWell available for multiclass classification and regression problems, expanding supported machine learning libraries beyond PyTorch, and automating model building and tuning. With FairWell, we aim to make all models fair and well, so you can bid farewell to unknown model bias.


Log in or sign up for Devpost to join the conversation.