Inspiration
As a group of international students who regularly rely on air travel, this project felt relevant because fluctuations in airfare directly affect our budgets. While it’s easy to assume that expensive tickets are simply the result of operating risks, such as safety requirements, demand uncertainty, and inflation, we observe that monopoly and market share dynamics play a role in pricing structure. Beyond international students, airfare affects most people's budgets due to globalization, especially on routes with limited carrier options. Fair Fare aims to analyze airfare structure and pricing patterns to assess whether higher fares are better explained by risk and cost factors faced by airlines, or by monopoly power and reduced competition, helping passengers and policymakers make more informed decisions.
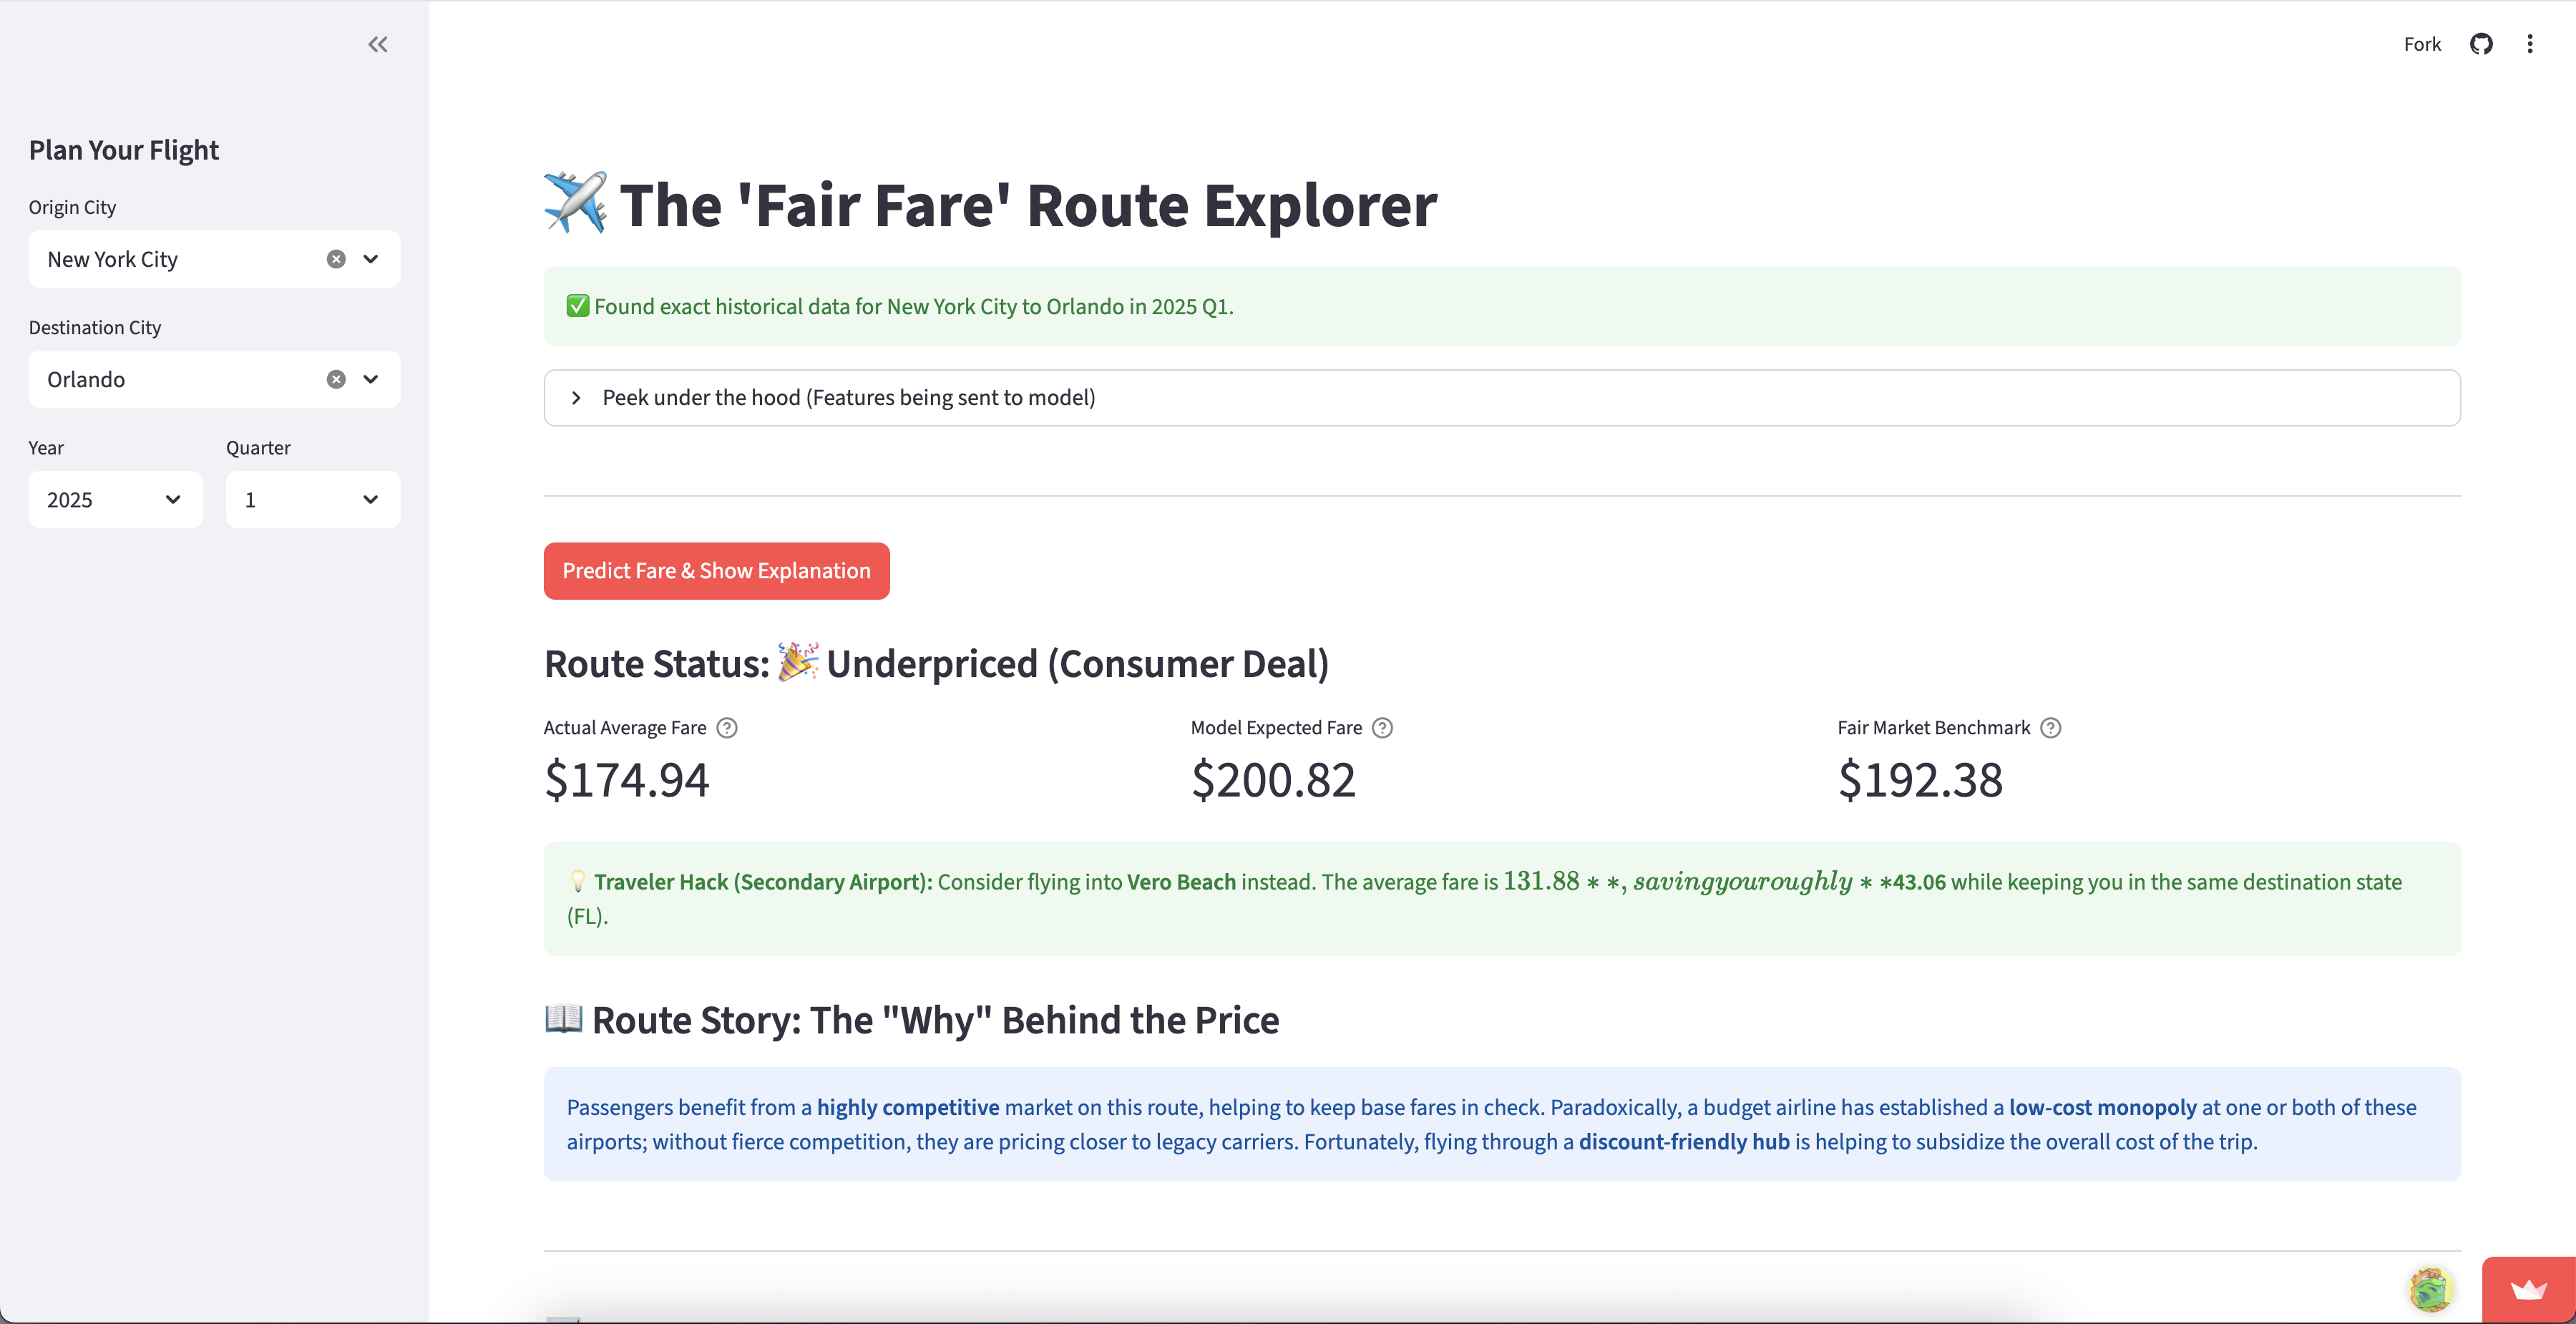
What it does
Fair Fare is an explainable AI engine and interactive dashboard that analyzes the pricing structure of US domestic flights. When a user looks up a route, the model first calculates the expected fare. Then, under the hood, we run a counterfactual simulation: "what if" we break monopolies, erase hub premiums, and inject budget airline competition into the data. By comparing the actual market price against this simulated "Fair Fare" benchmark, our app calculates the exact Competition Penalty ($) a consumer is paying because of these factors.
How we built it
Fair Fare contains 3 main components:
- Data Exploratory and Preprocessing: We used data from the competition package and extra data from FRED and censusgov USA to include real-life demographic conditions and merged it with pandas. For missing data, we inspect it thoroughly and decide to remove it. We do some label extraction and simple transformations for feature engineering. We choose the covariates based on EDA findings, such as graphs and a correlation matrix.
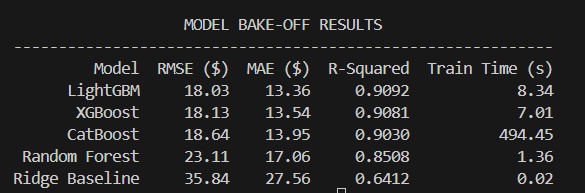
- Model Training and Evaluation: We built some models focusing on good models for tabular data, including XGBoost, LightGBM, and CatBoost. We fed each model using the same train, validation, and testing data. We use some regression metrics such as RMSE, MAE, and R^2. We ended up using LightGBM.
- Dashboard: We created a web app dashboard so the user can use the model more easily. Allowing the user to analyze the pricing structure of a route and quantify the dollar impact of anti-competitive forces on domestic flight routes.
Challenges we ran into
Coming from a different background and knowledge, collaboration feels difficult during the early stage. During data cleaning, we also had challenges adapting an extra data source since the observations are recorded at the county level quarterly, which is rather challenging to find and requires some level of adaptation. We also had challenges during web app dashboard development due to a lack of deep knowledge of Streamlit. Besides, we are unable to adapt some features from the initial plan due to device requirements.
Accomplishments that we're proud of
- Strong model performance on route-level fare prediction: In our model bake-off, gradient boosting models (LightGBM/XGBoost/CatBoost) achieved high accuracy (RMSE around 18, MAE around 13–14, R² around 0.91), substantially outperforming a ridge baseline.
- Actionable “Fair Fare” framing: We moved beyond predicting fares to benchmarking what a route should cost using fundamentals, making the results interpretable for non-technical users.
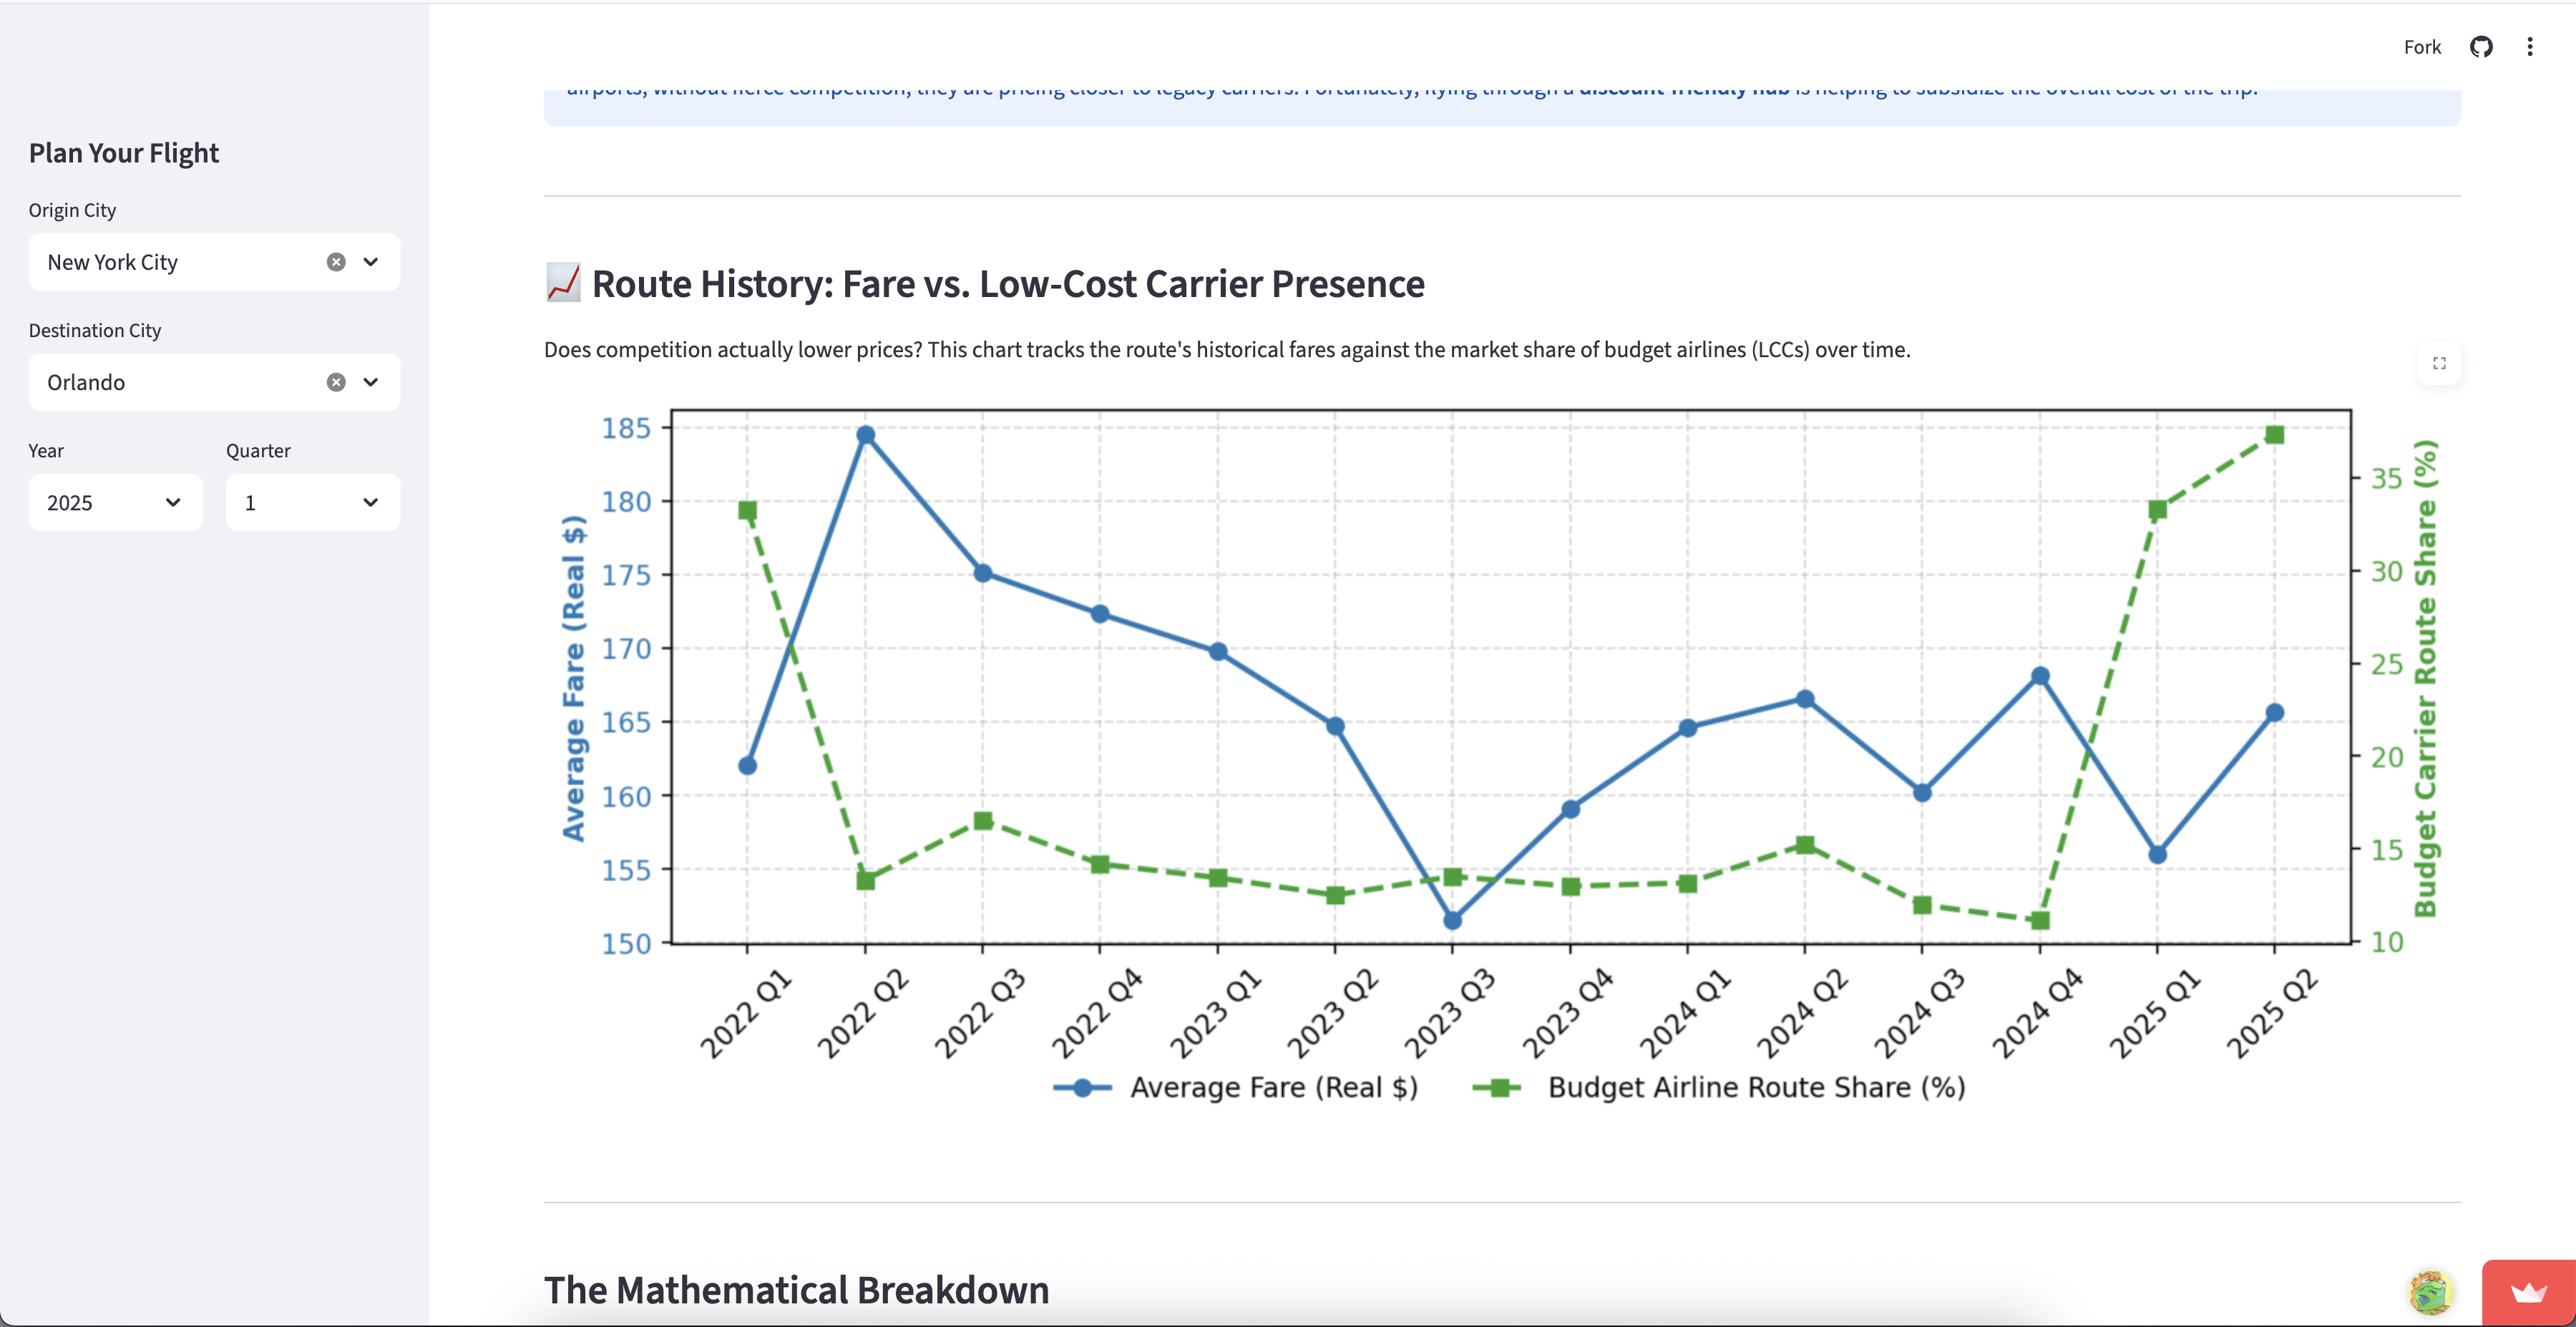
- Clear evidence on competition effects: Our EDA and model explanations consistently show that greater low-cost/low-fare presence is associated with lower price-per-mile, while higher dominant carrier market share is associated with higher price-per-mile.
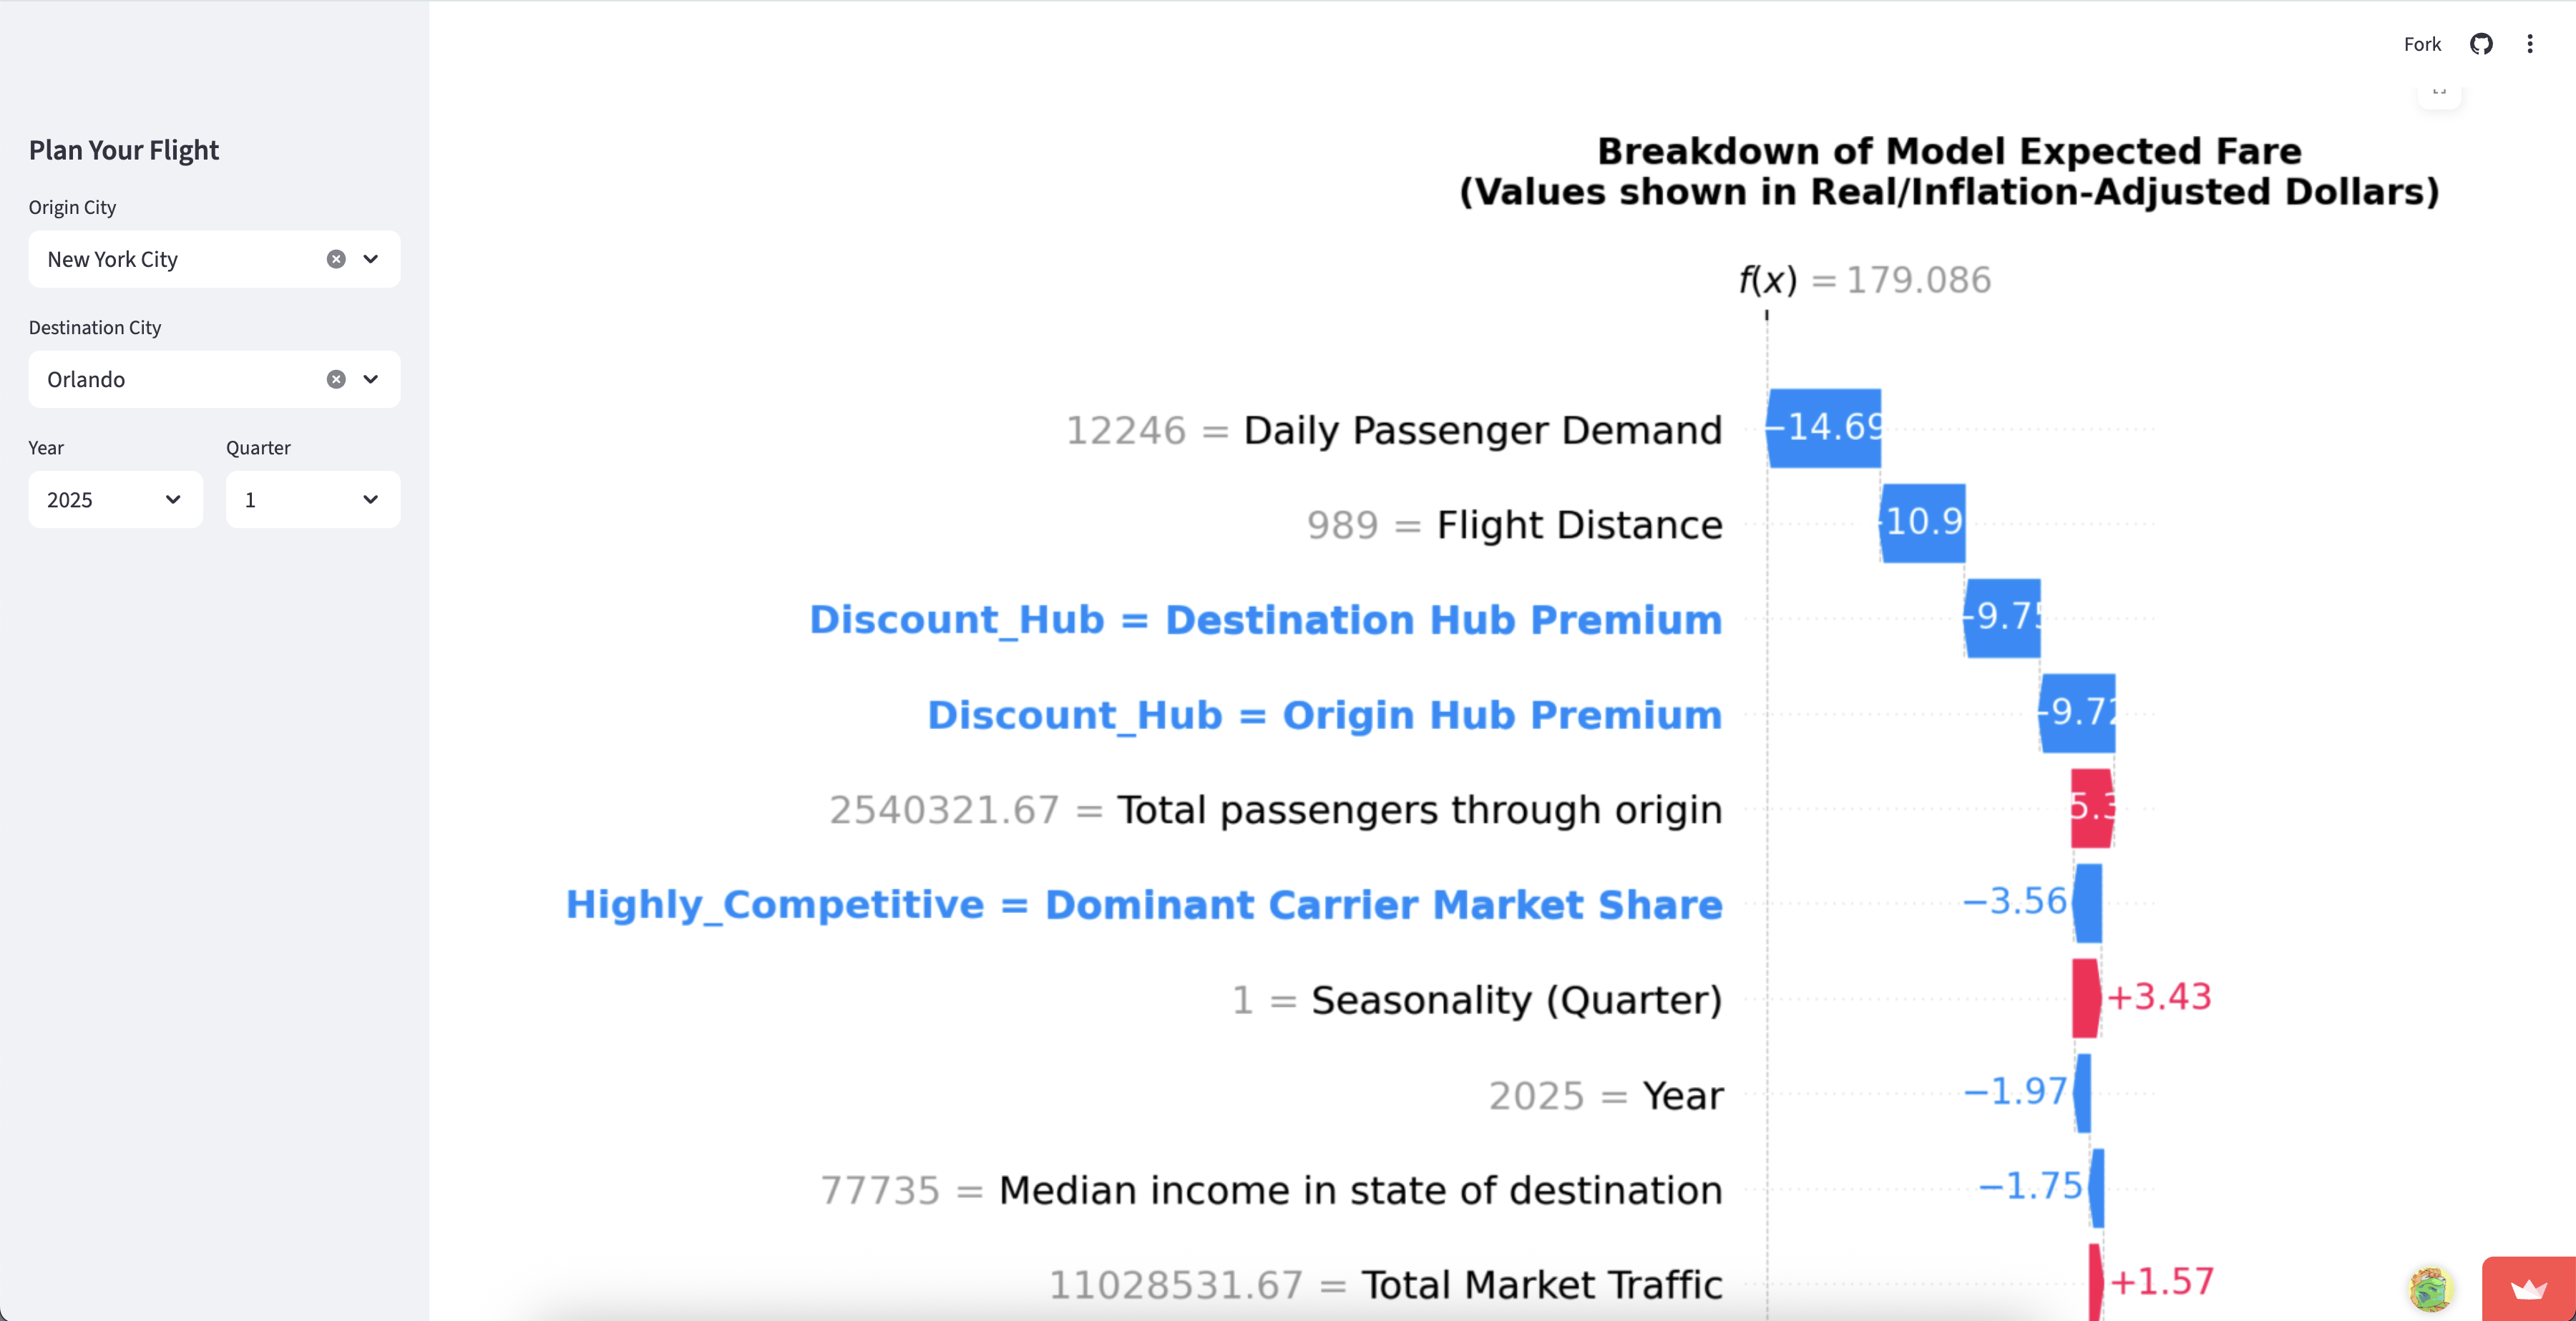
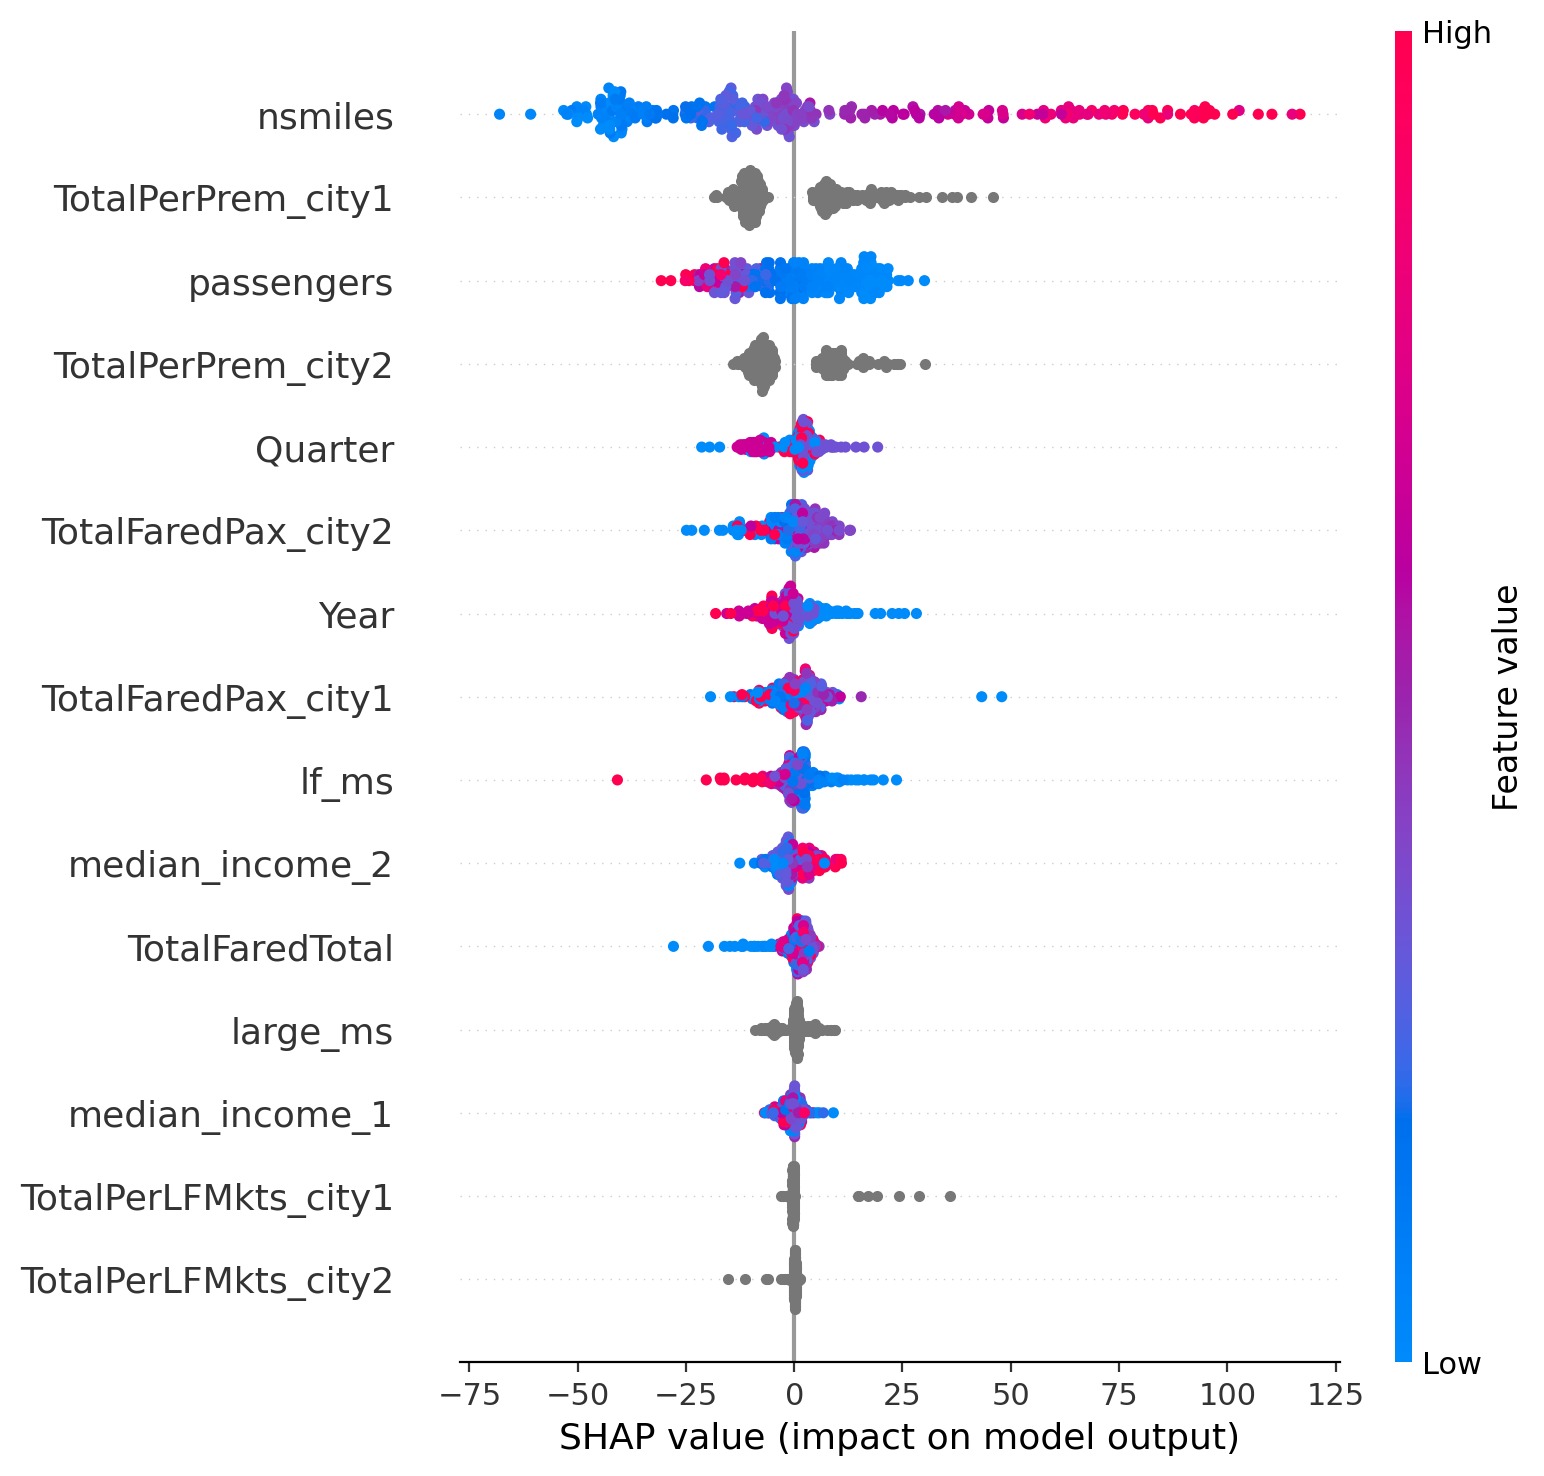
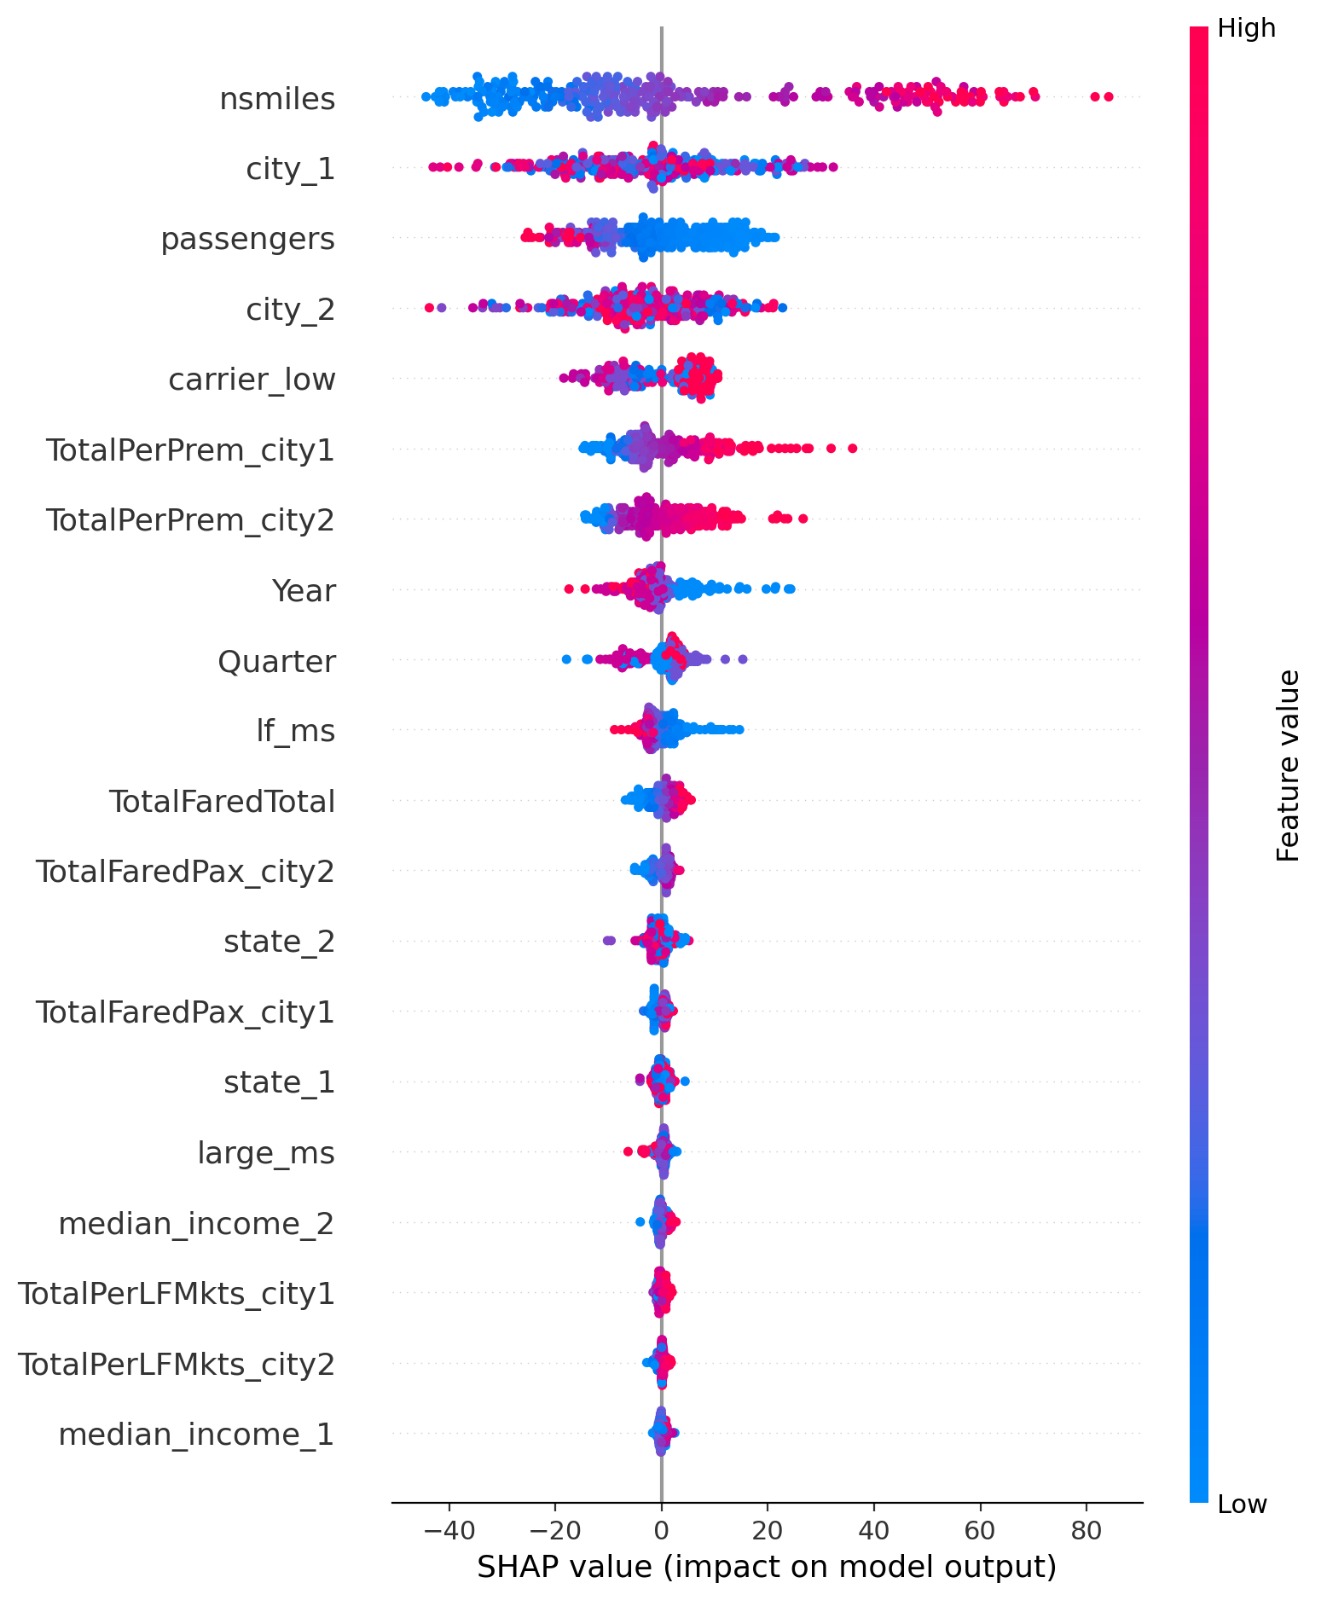
- Explainability with SHAP: We translated model outputs into feature contributions, making it possible to explain why a route is expensive (distance, demand, city-level premiums, market structure) rather than treating the model as a black box.
- Usable dashboard prototype: We built a Streamlit-based interface so users can explore routes and understand how competition and market structure influence predicted fares.
What we learned
Through this project, we learned a lot about the type of Boosting Algorithm and how to implement it. As one of the best tabular models, it’s good to have this knowledge for future projects. Besides, we also learned about fast web-app dashboard development using Streamlit. Not only how to use and integrate it with Python, but also its limitations and requirements during development. For the airfare analysis, we learned how market structure and conditions matter for airfare pricing. Besides, we also learned how Low-Cost-Carriers can push down the predictions, increasing competition, and destroying hub premiums
What's next for Fair Fare: Benchmarking U.S. Route Airfares - Team 30
- Better market-structure features: Add explicit hub/fortress-hub indicators, airport-level competition measures, and route-type flags (hub-to-hub vs hub-to-nonhub) to separate network effects from city identity.
- Forecasting extension (if needed): Train on earlier years and evaluate on later periods to support forward-looking estimates, with uncertainty intervals so predictions are decision-ready.
- Stakeholder-specific outputs:
- Travelers: “Overpriced route” warnings and alternative airport suggestions where competition is stronger.
- Platforms/OTAs: Fair Fare benchmark labels to improve transparency and user trust.
- Policymakers: Monitoring lists for persistently high-premium, low-competition markets.
- Reproducibility + deployment: Package the pipeline into a clean, end-to-end workflow (data prep → training → evaluation → dashboard) with documented configs so others can reproduce results easily.
Built With
- lightbgm
- python
- streamlit
- xgboost


Log in or sign up for Devpost to join the conversation.