-
-
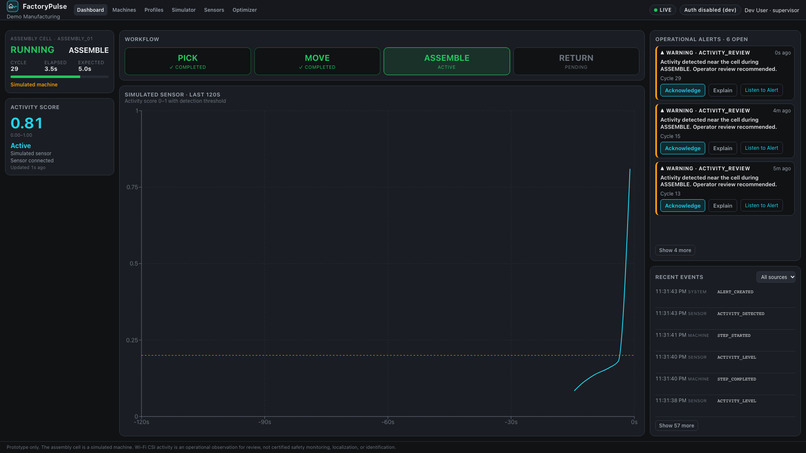
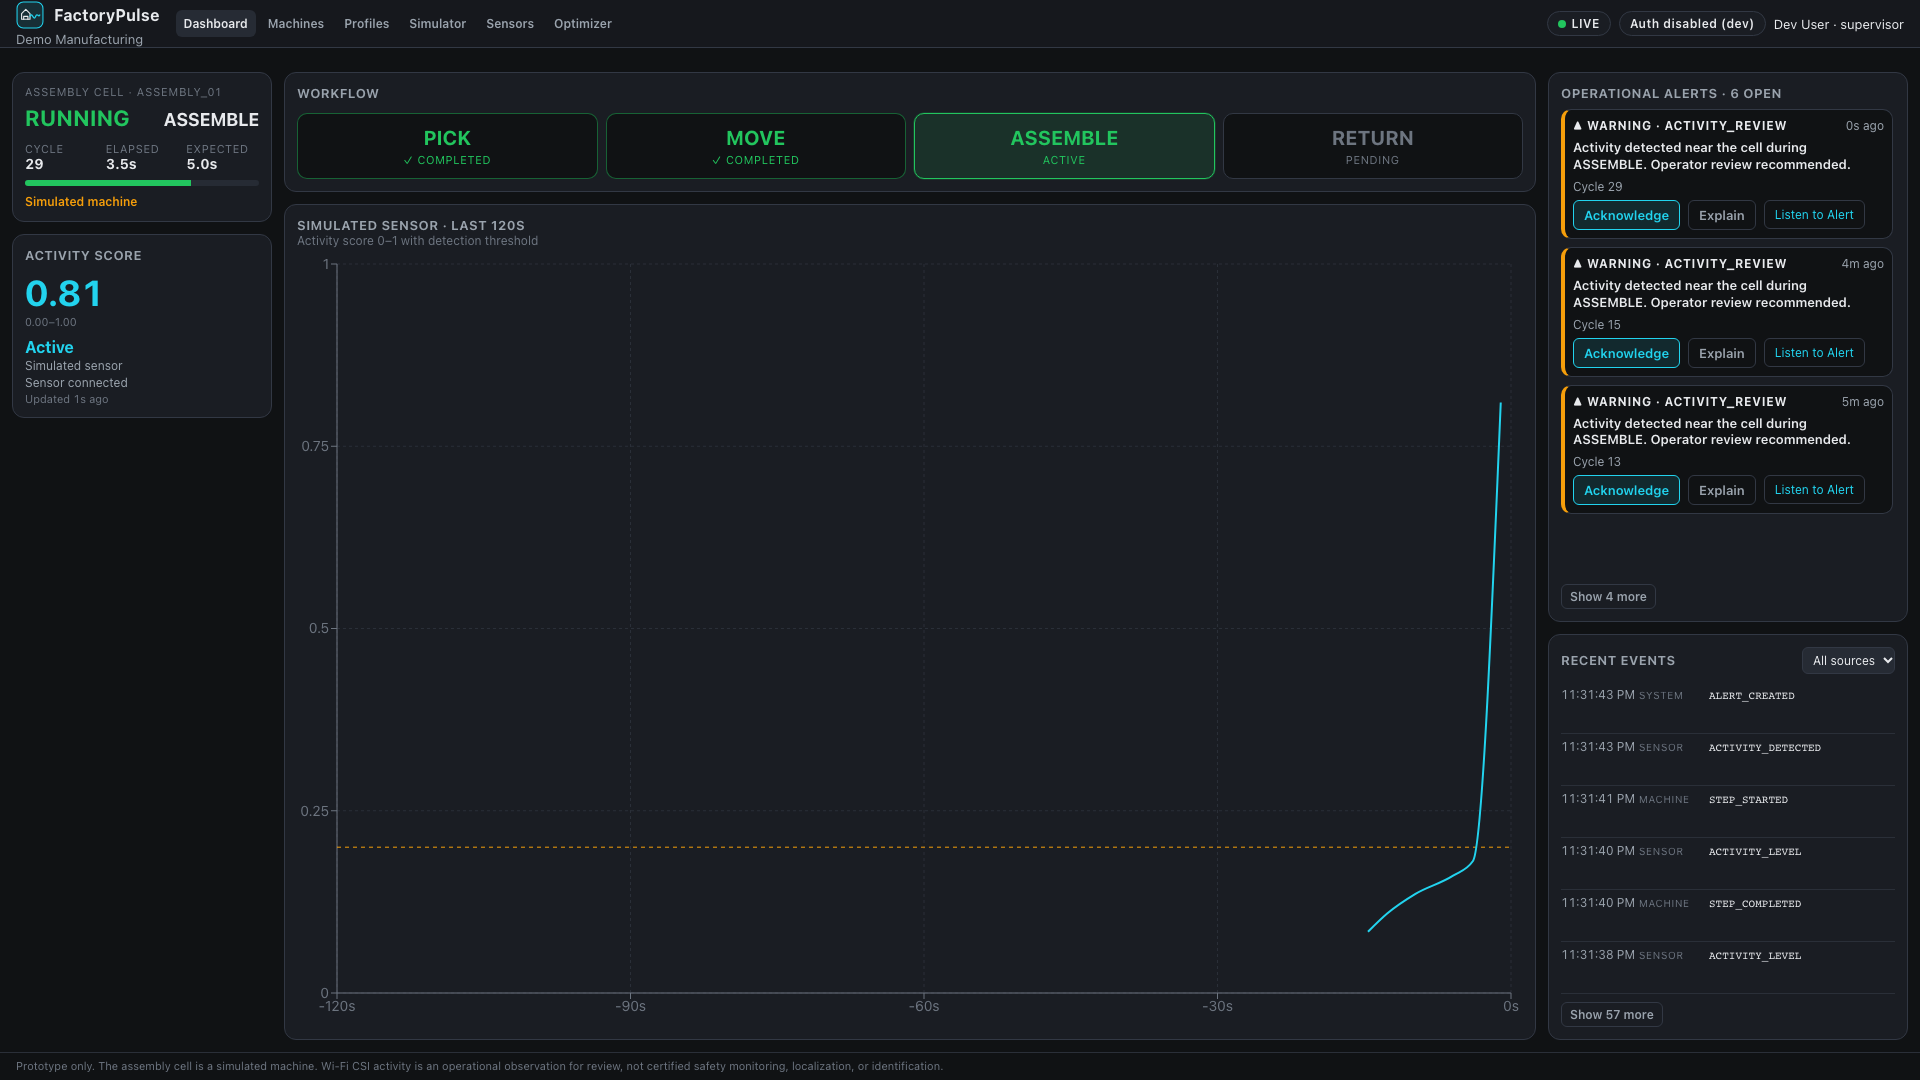
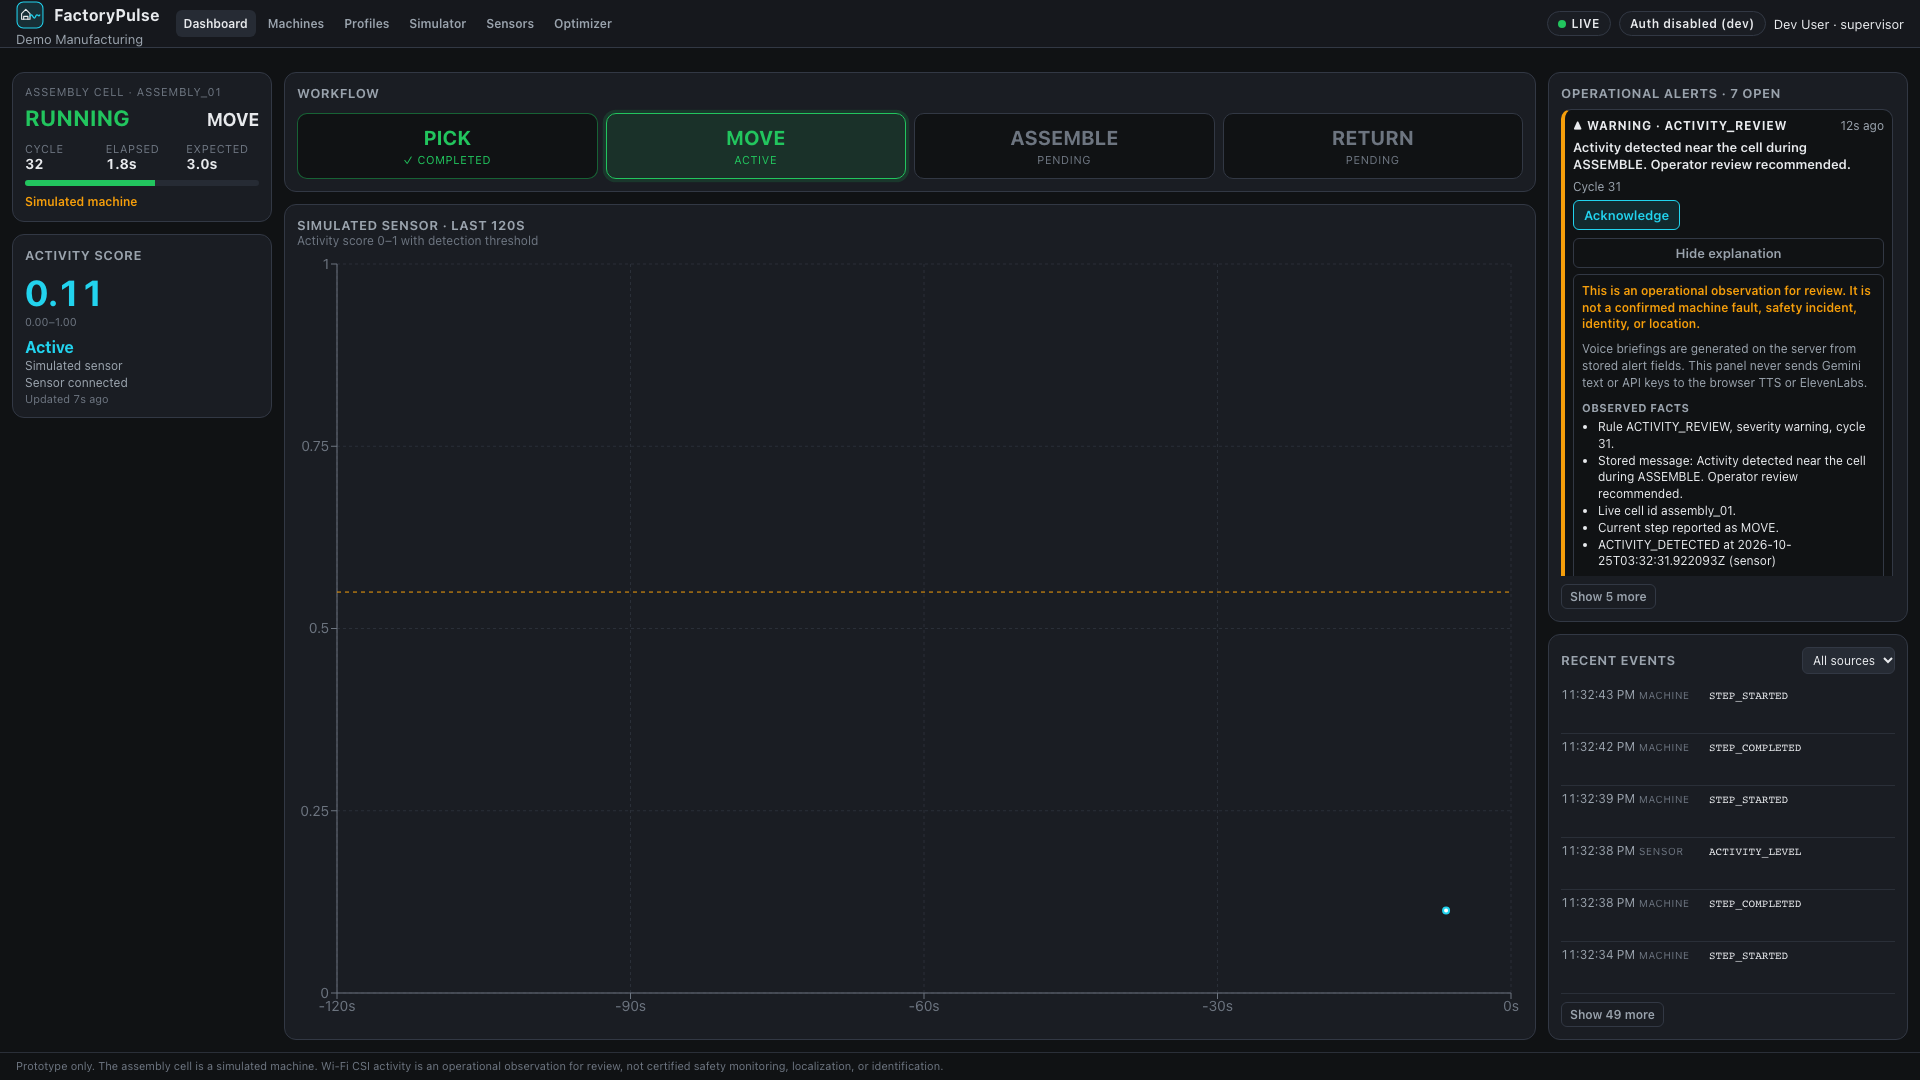
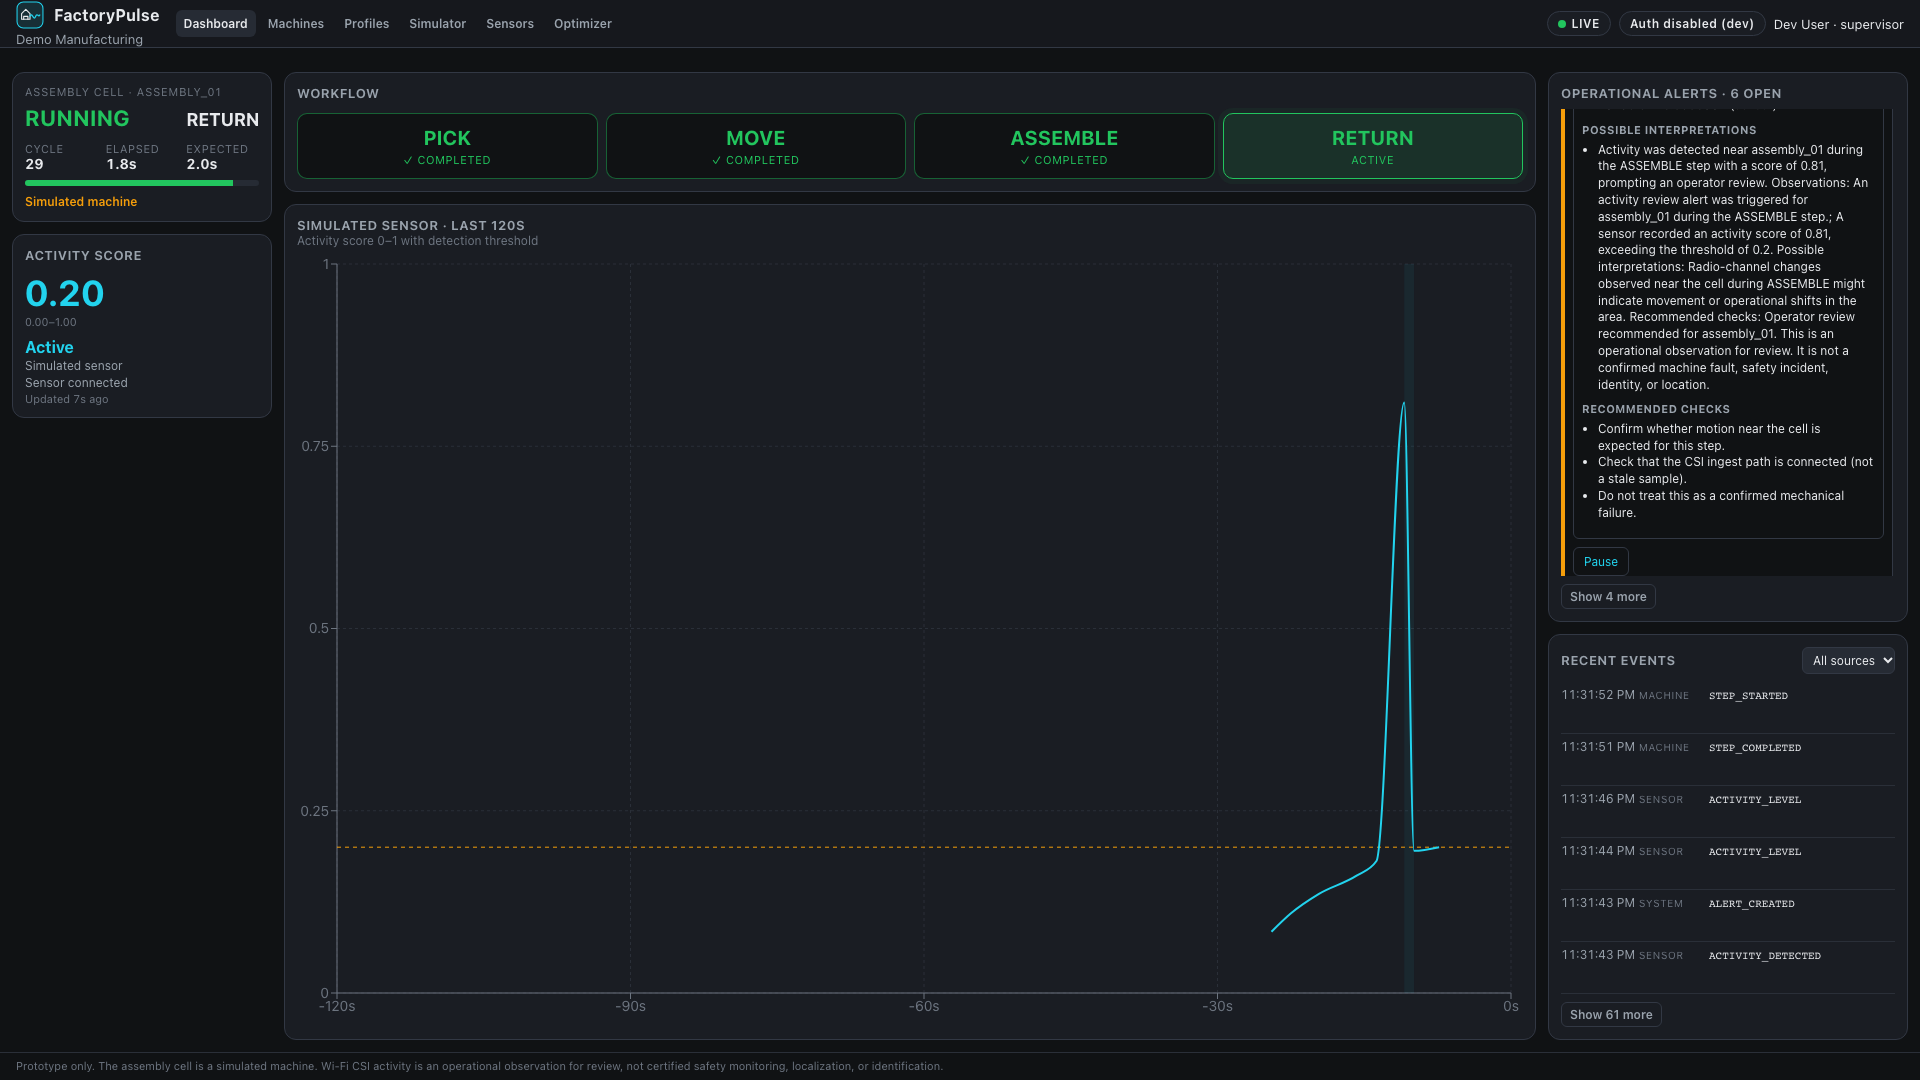
Live assembly-cell dashboard showing a simulated activity event and a rule-based operator review alert.
-
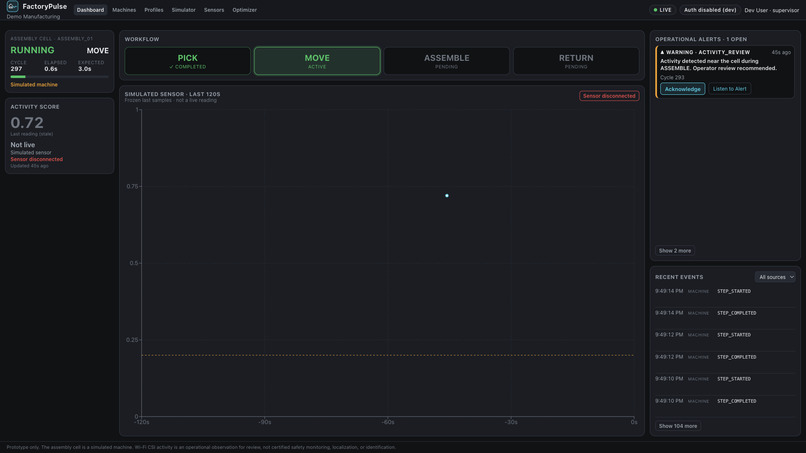
Real-time workflow tracking across PICK, MOVE, ASSEMBLE, and RETURN, with an activity timeline and sensor status.
-
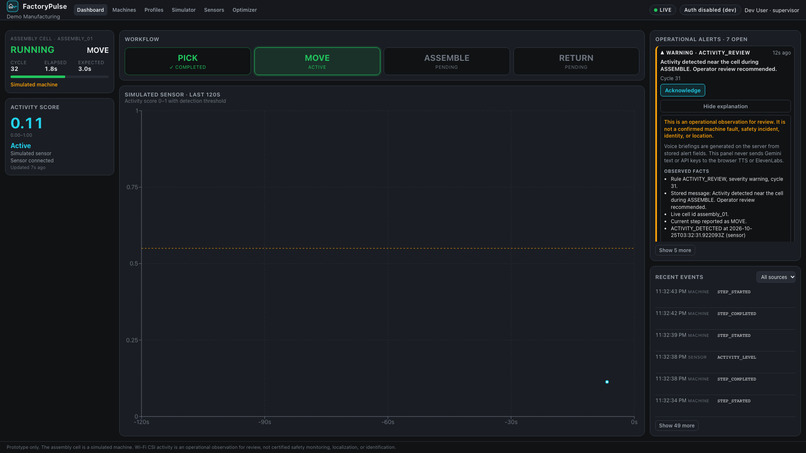
Gemini API explains an activity alert using observed facts, event context, and operational guidance.
-
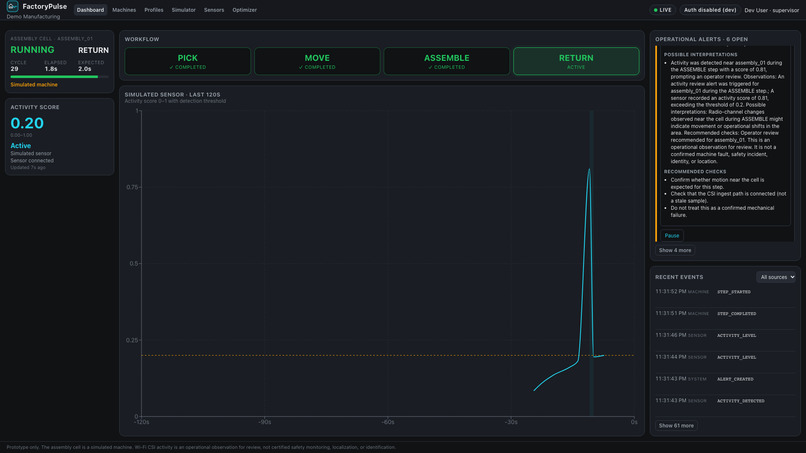
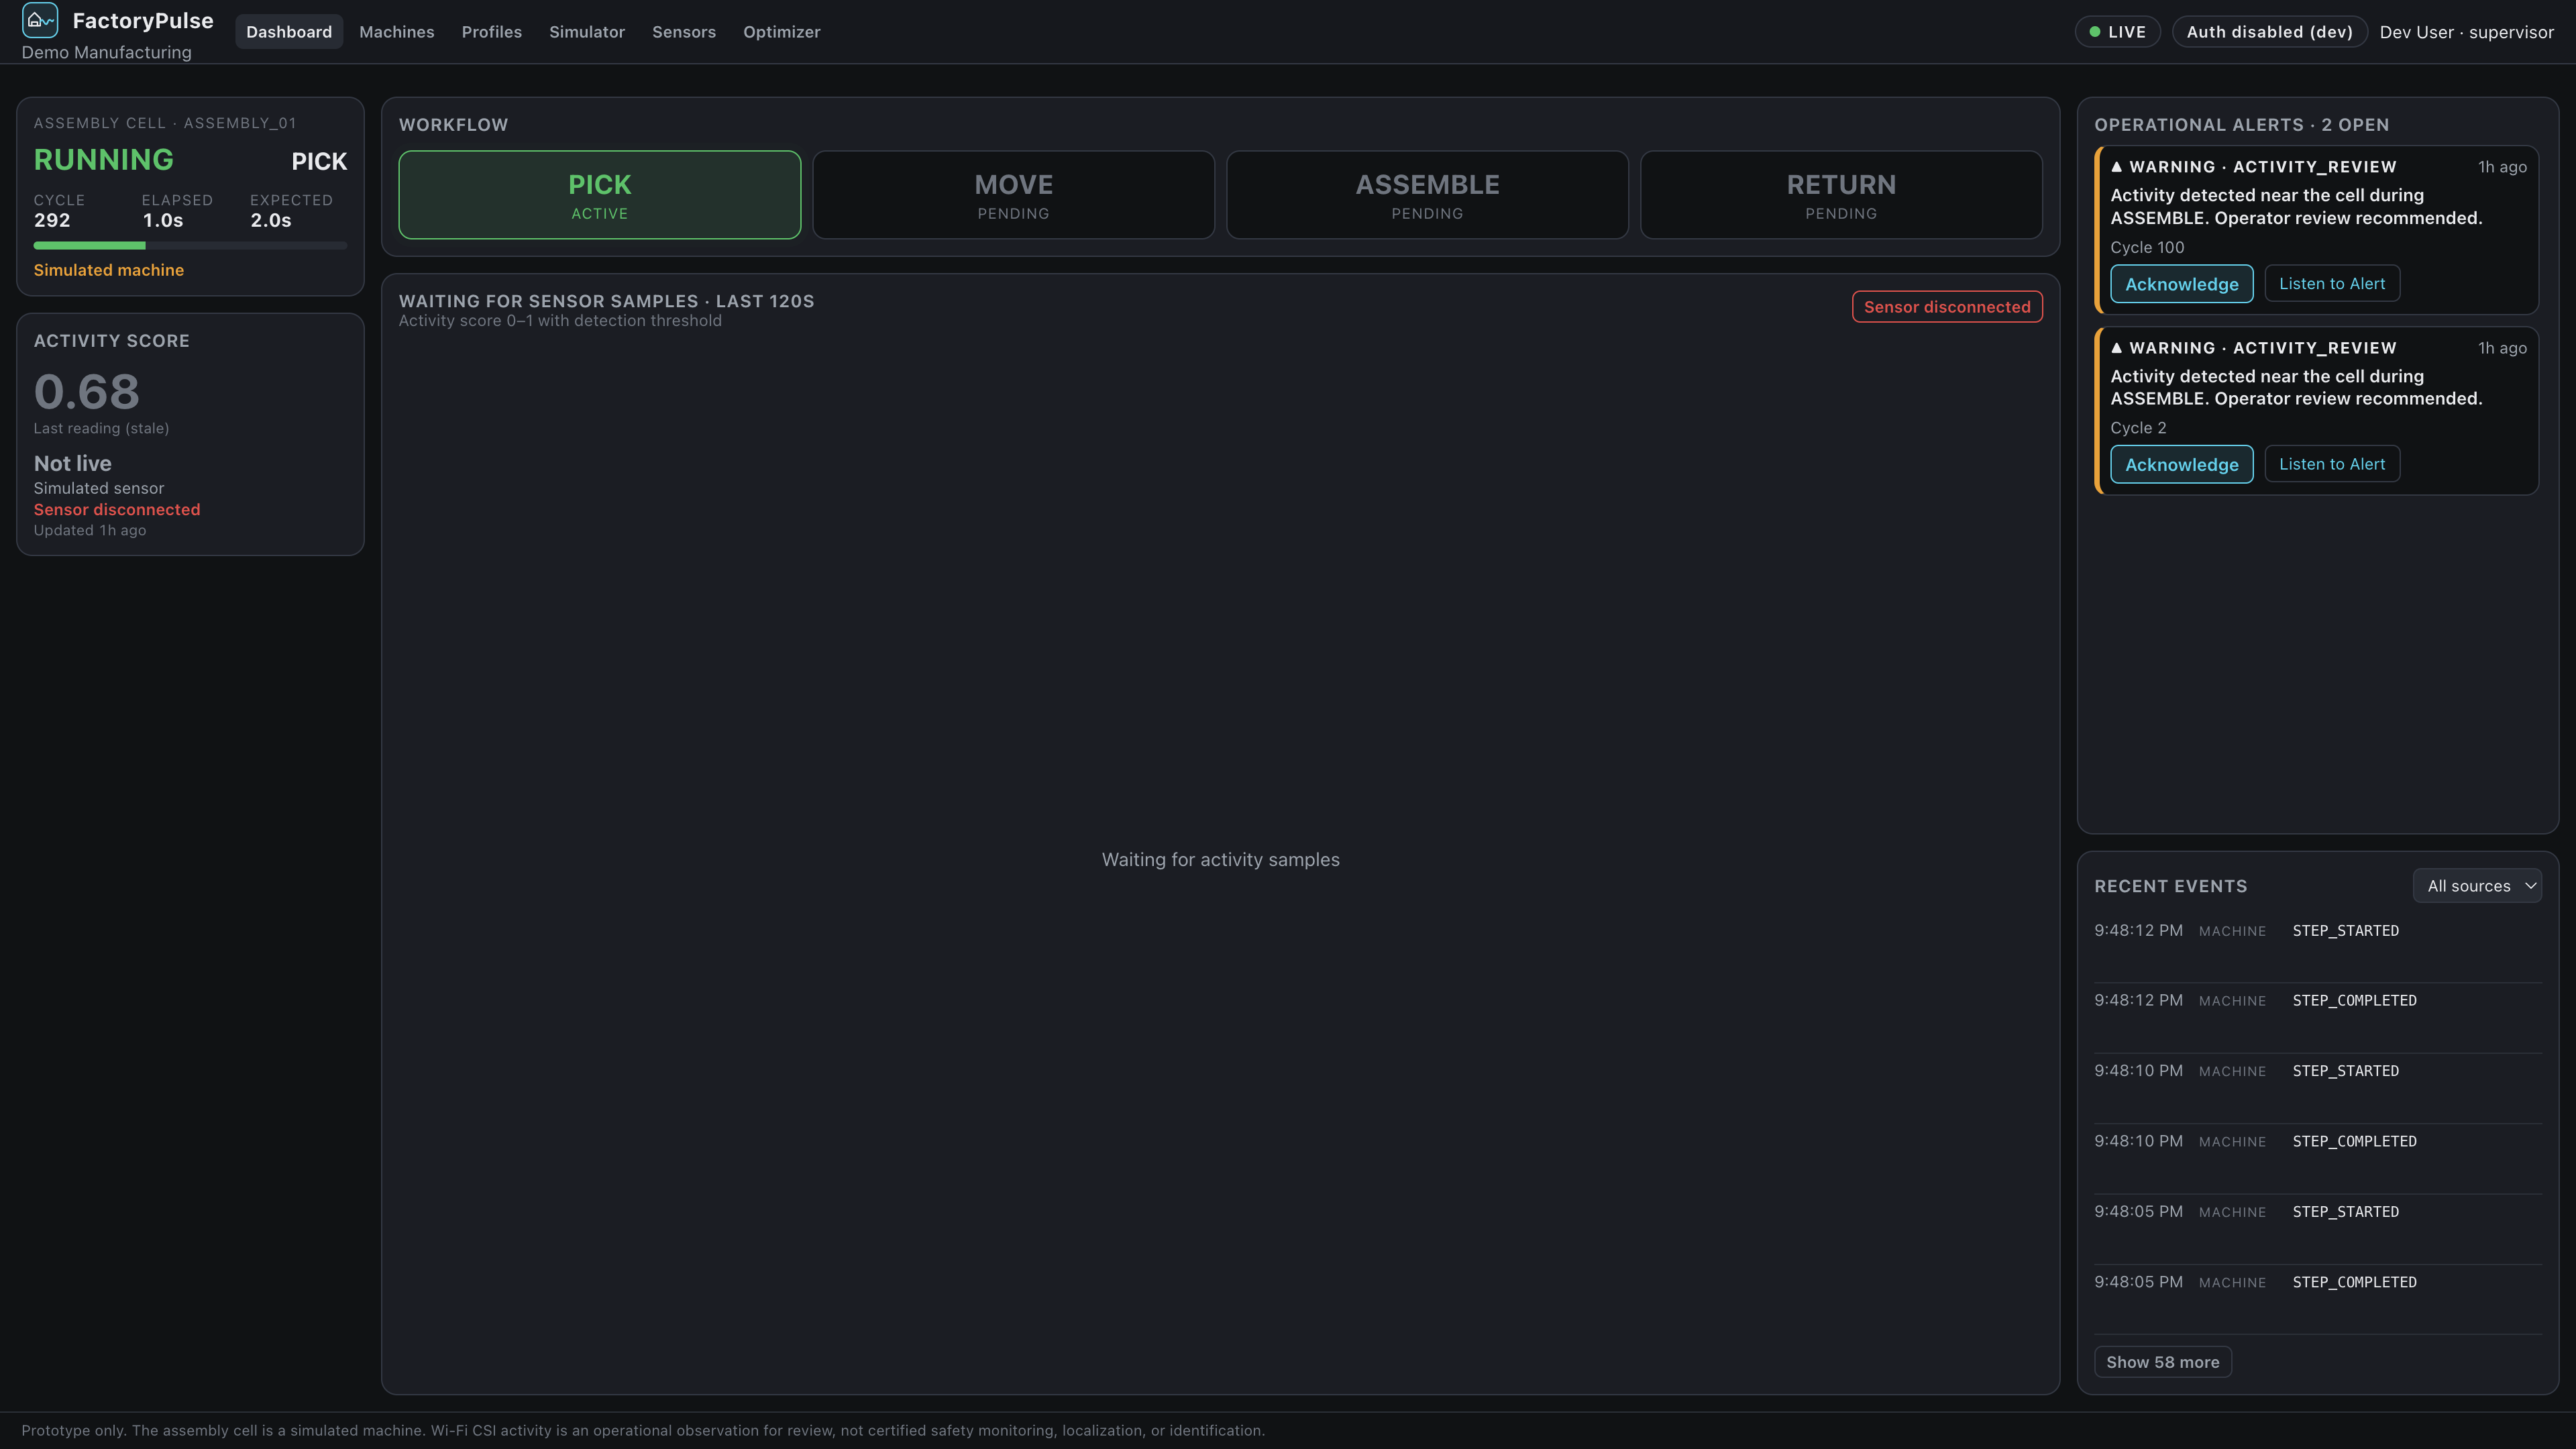
ElevenLabs generates a spoken alert briefing, with audio playback and Gemini's contextual interpretation.
-
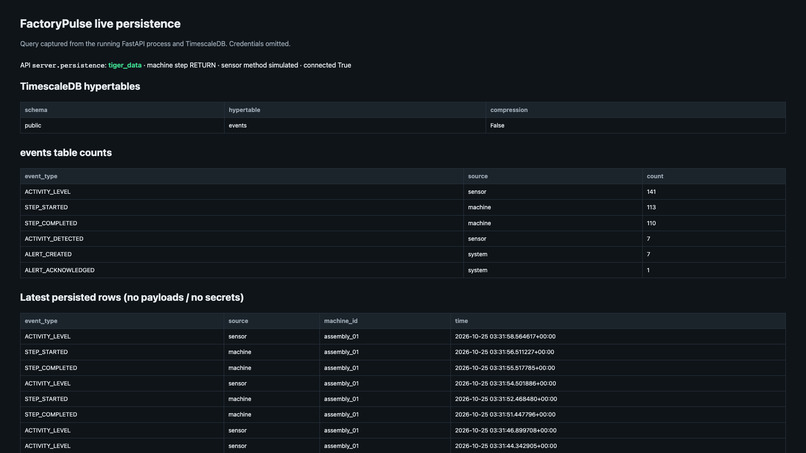
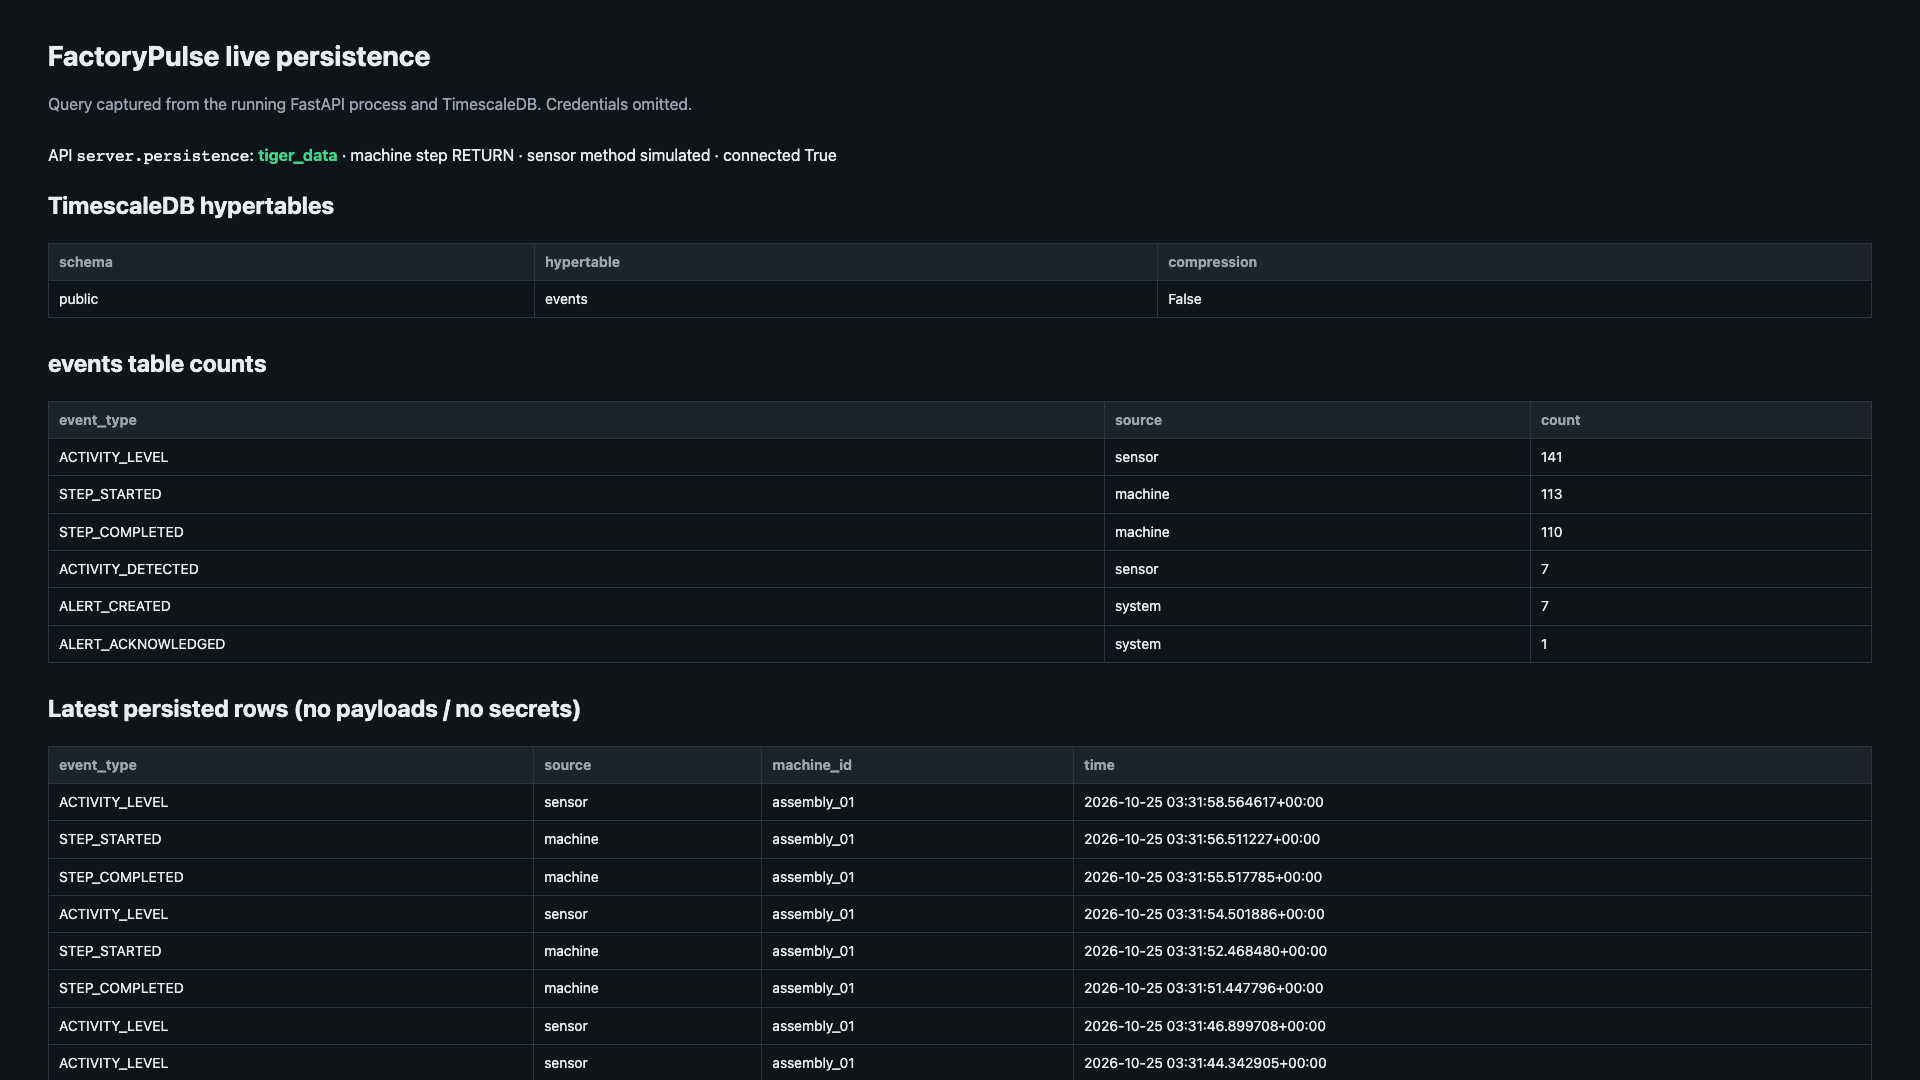
Tiger Data and TimescaleDB persist timestamped machine events and alerts, verified through live API and SQL queries.
-
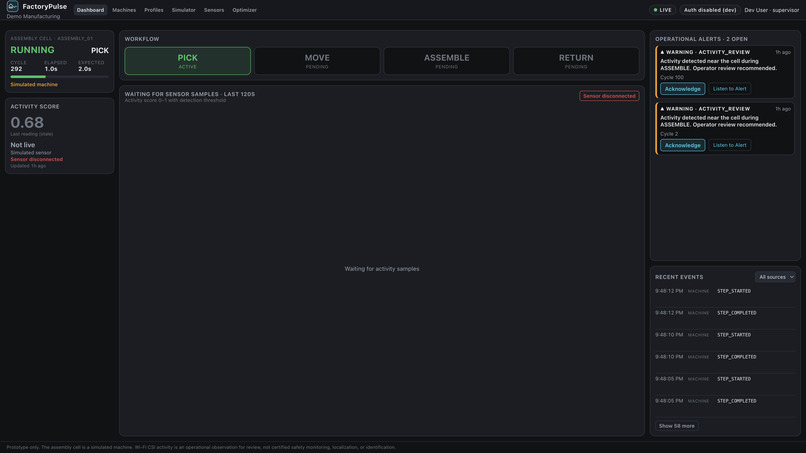
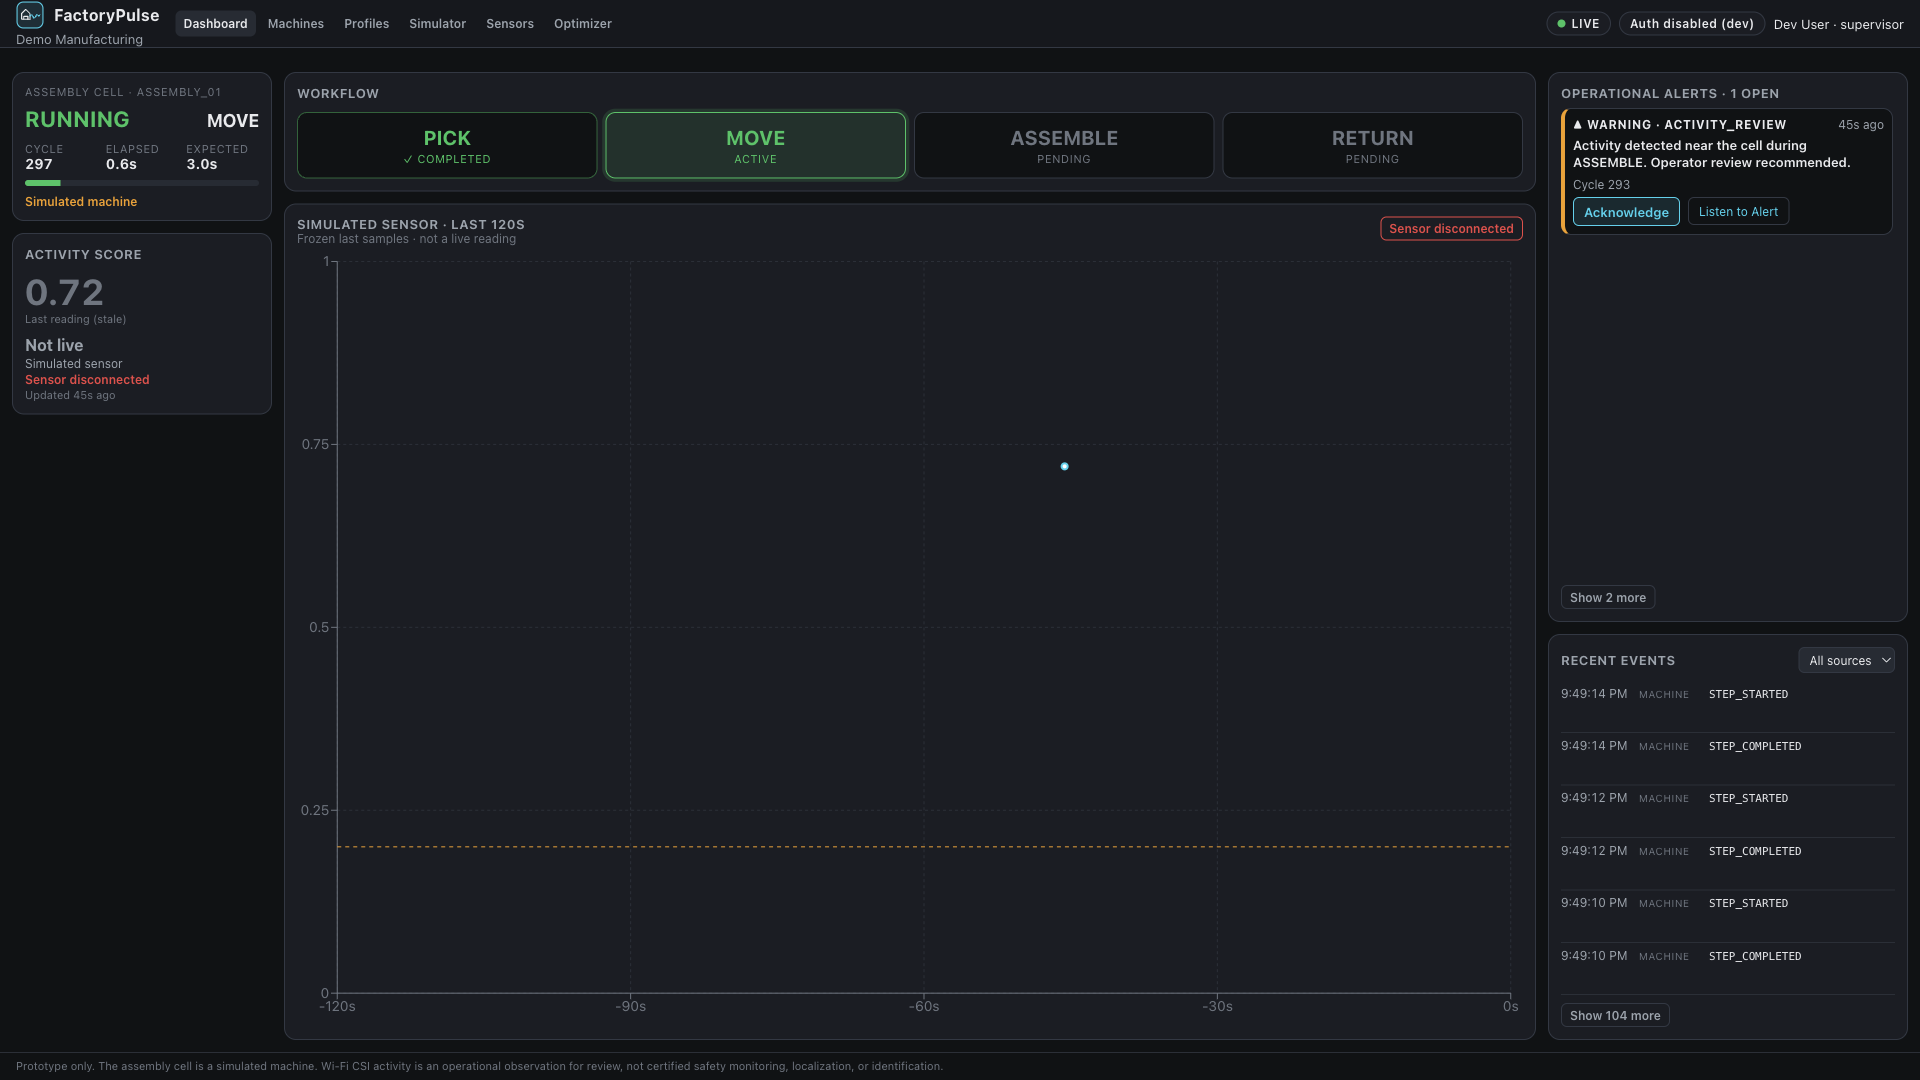
FactoryPulse dashboard overview showing the machine workflow, activity monitoring, and alert controls.
Inspiration
Modern factories are increasingly automated, but machine logs only tell part of the story. They show what a machine is doing, not what is happening in the physical space around it. An assembly machine can be mid-operation while unexpected activity occurs nearby, and neither the machine log nor a standalone sensor explains the full situation on its own.
We wanted to connect those two perspectives using affordable hardware and real-time software. Inspired by industrial automation, digital twins, and Wi-Fi sensing research, we focused on one concrete scenario: a single automated assembly cell. Our goal was to help operators understand not just what happened, but the operational context it happened in, and then use that history to improve the cell itself.
Why ESP32 instead of cameras?
In any environment where humans and machines are working together, privacy is an issue. The use of cameras for monitoring can be a source of concern in terms of worker surveillance.
FactoryPulse uses low cost ESP32 devices and Wi-Fi sensing to detect activity without the need to record any video at all. It's a privacy aware, low cost solution for industrial monitoring.
What it does
FactoryPulse follows a Detect → Alert → Optimize loop for a single assembly cell.
Detect
- Wi-Fi activity sensing (real ESP32 hardware): Two ESP32 boards form a Wi-Fi CSI sensing link. A Python processing client with calibration and sustained-activity detection turns signal changes into activity events. In our prototype experiment, physical movement near the sensing link produced activity events that reached the live dashboard in real time.
- Machine execution tracking (simulated): A software-simulated assembly machine runs a PICK → MOVE → ASSEMBLE → RETURN cycle (about 12 seconds) and emits timestamped events for every step.
- Simulated sensor mode: The same dashboard can also run with clearly labeled simulated sensor events, so the full workflow can be demonstrated reproducibly without hardware.
Alert
- Context-aware rules: Deterministic backend rules evaluate activity against the machine's current step. Real CSI events and simulated sensor events go through the same rules. Activity during ASSEMBLE creates an
ACTIVITY_REVIEWalert recommending operator review, and a step is flagged as delayed when it takes more than 1.5× its expected duration. - Live dashboard: A React dashboard shows machine status, the workflow, activity readings, an event timeline, and alerts, updated in real time over WebSockets. Operators can acknowledge alerts.
- AI explanations (Gemini): An Explain button sends the alert and surrounding events to Gemini on the server, which returns observed facts, possible interpretations, and a disclaimer.
- Voice briefings (ElevenLabs): A Listen button plays a server-generated spoken briefing for the alert, with pause/resume and caching to avoid repeat synthesis.
- Persistent history (Tiger Data): Events, alerts, and acknowledgements are stored in Tiger Data, with events in a TimescaleDB hypertable, so history and alert state survive a backend restart.
Optimize
- Layout optimizer: A planning view that evaluates workstation placement and material flows. It currently runs on example workstation and workflow inputs, not CSI-derived positions.
Alerts are rule-based by design. Gemini and ElevenLabs explain and communicate alerts; they never decide whether one should be raised.
The machine is simulated, and FactoryPulse is a monitoring prototype, not a certified industrial safety system. Wi-Fi CSI detects signal variations associated with activity; it does not identify people, determine precise locations, or confirm hazards. Sensing accuracy, false-positive rates, and reliability across environments have not yet been measured.
How we built it
We are a three-person team. We split the work into three areas connected by a shared event contract, so each of us could build independently and integrate through the backend.
- Hardware and sensing: ESP32 transmitter/receiver firmware and a Python CSI processing client (
csi_stream.py) with baseline calibration, sustained-activity detection, connection recovery, and authenticated event publishing to the backend. In our prototype experiment, the full path from the physical ESP32 link through the Python client and FastAPI to the live dashboard worked in real time. Because sensor events share one event format, real CSI events enter the same pipeline and alert rules as simulated ones. - Backend: FastAPI with event ingestion, an in-process machine simulator, operational state, deterministic alert rules, and WebSocket streaming. Sensor events are authenticated with a sensor API key, and the company each event belongs to is assigned server-side rather than taken from the client.
- Persistence: We chose Tiger Data's PostgreSQL and TimescaleDB to preserve timestamped machine and activity events for historical analysis. The events hypertable supports time-series storage, while separate relational tables retain alert and acknowledgment state. A separate event-ID registry prevents duplicate rows. We verified event retrieval and state restoration across backend restarts. When no database is configured, the backend falls back to in-memory mode.
- AI and voice: Server-side Gemini integration for grounded alert explanations and ElevenLabs text-to-speech for briefings. API keys live only on the backend; the browser never talks to either service directly.
- Authentication: FactoryPulse integrates Auth0 Universal Login for operator authentication. We verified the local end-to-end flow using Google sign-in, Auth0 API access tokens, FastAPI JWT validation, protected REST endpoints, authenticated WebSocket connections, and logout. Unauthenticated API requests and invalid access tokens are rejected. Company membership is resolved server-side, and company-scoped API queries and access restrictions are covered by automated tests. The current live assembly-cell demo operates within a single company, and our presentation demo runs with authentication disabled for simplicity.
- Frontend: React and TypeScript with separate Demo and Live modes, machine and activity visualization, alert actions (acknowledge, Explain, Listen), and the layout optimizer.
- Integration: We integrated all three subsystems into a single main branch, each validated by its own test suite.
- Development tools (Cursor + Grok Bot): We used Cursor Agent with Grok 4.6 as our core AI coding agent for implementation, debugging, code review, and verification. Separately, we installed the Grok Bot desktop app and created FactoryPulse Docs Reviewer, a named Bot with a daily read-only README review routine. We successfully tested the automation on October 25, 2026, against our public GitHub repository without modifying files or accessing secrets. These tools supported our development workflow and are not runtime dependencies of FactoryPulse.
Challenges we ran into
- Combining two kinds of data: CSI readings and machine execution events are fundamentally different signals. A shared event contract let both feed one operational view without either side depending on the other's internals.
- Noisy wireless measurements: CSI varies with the environment and connection quality, so the pipeline needed calibration, sustained-activity logic, and reconnection handling instead of reacting to individual readings.
- From software tests to physical hardware: Moving from tested code to a live ESP32 link meant getting firmware, serial streaming, the Python client, and backend credentials to work together on real hardware, where placement and the surrounding environment directly affect the signal.
- Keeping alerts explainable: We deliberately kept alert decisions in explicit rules rather than an AI model, so behavior stays predictable and testable, and grounded Gemini's output in the actual alert and event history.
- Reliable persistence: TimescaleDB unique indexes must include the time column, so we used a separate event-ID registry to keep deduplication reliable while storing events in a hypertable.
- Parallel development: Three developers building separate subsystems meant protecting interface compatibility and integrating carefully without overwriting anyone's work.
- External API limits: Our first ElevenLabs requests failed with HTTP 402 because the account lacked an eligible plan. After upgrading, voice generation worked end to end.
Accomplishments that we're proud of
- Real-time physical sensing: We successfully demonstrated real-time physical Wi-Fi CSI sensing using ESP32 devices, with movement-related activity events flowing through our Python processing client and FastAPI backend to the live dashboard. The machine execution cycle remains software-simulated, and we are continuing experiments to evaluate sensing reliability.
- Live Tiger Data persistence: Connected to a real Tiger Data instance with TimescaleDB, initialized the full schema, and verified that events written through the API matched the database. An alert acknowledgement was persisted, and after a backend restart the event history and acknowledged alert state were restored.
- Gemini explanations verified end to end: A live request returned an explanation that rendered in the dashboard.
- ElevenLabs verified end to end: Real MP3 generation, dashboard playback with pause/resume, and cached repeat requests.
- Auth0 verified end to end (locally): Google sign-in through Auth0 Universal Login redirected to the dashboard with the operator's identity and role, authenticated REST and WebSocket requests succeeded with a proper API access token, missing or malformed tokens were rejected with HTTP 401, and logout returned protected pages to the login screen.
- Rule-based alerting verified: A simulated activity event during ASSEMBLE produced an
ACTIVITY_REVIEWalert. - Automated tests: 27 backend tests passing (5 persistence unit tests skipped without a dedicated test database), 122 frontend tests passing, and 18 sensing pipeline tests passing (1 skipped).
- Integrated three independently built subsystems into one working prototype, from physical sensors to the operator dashboard.
Together, these components turn machine events and real or simulated activity signals into a unified operational timeline, with actionable alerts, AI-assisted explanations, and persistent history.
What we learned
- Physical signals need context. A change in wireless activity means little until it's paired with what the machine is doing.
- Calibration matters. Activity sensing needs a baseline for normal conditions and a strategy for noise and dropped connections.
- Rules and generative AI serve different roles. Deterministic rules make alerts consistent; AI is better suited to explaining and communicating them.
- Time-series databases shape your design. Working with hypertables changed how we approached uniqueness and deduplication.
- Shared contracts make parallel work possible. Agreeing on event formats early let us integrate three codebases with few conflicts, and let real sensor data plug into a pipeline first built and tested with simulated events.
- Tests are necessary but not sufficient. Automated tests built confidence in the software, but connecting the physical sensors showed us how much real-world behavior depends on placement, calibration, and the surrounding environment.
What's next for FactoryPulse
- Sensing repeatability and calibration: run repeated trials across different rooms, sensor placements, and movement patterns, and make calibration faster and more robust.
- False positives and detection reliability: measure false alerts and missed detections so we can report sensing accuracy instead of only demonstrating it.
- Link recovery in the field: stress-test serial disconnects, Wi-Fi interference, and reconnection during long-running sessions.
- Physical sensing history: run the physical sensing pipeline with Tiger Data persistence enabled, so real activity history can be reviewed and analyzed.
- Production authentication and multi-company support: deploy the Auth0 flow beyond local development, verify isolation with real accounts from separate companies, and support independent live cells per company.
- Historical analytics: expand existing step-duration metrics into historical trend dashboards and TimescaleDB continuous aggregates.
- Data-driven optimization: feed real operational history into the layout optimizer instead of example inputs.
- Real machine integration: connect to actual controllers or robotic systems instead of a simulator.
- Multi-cell monitoring and new sensing modalities such as acoustic anomaly detection.
Our long-term vision is an extensible operations intelligence platform that connects physical observations with machine execution data.
Built With
- auth0
- cursor
- elevenlabs
- esp-idf
- esp32
- fastapi
- gemini-api
- github
- grok
- numpy
- postgresql
- pytest
- python
- react
- tiger-data
- timescaledb
- typescript
- vite
- vitest
- websocket
- wi-fi-csi

Log in or sign up for Devpost to join the conversation.