Factory Guardian — Project Story
The alert fires on a symptom. Factory Guardian finds the cause — then proves the fix worked.
Inspiration
Every incident starts the same way: an alert fires on a symptom. "API latency > 5 seconds." Nobody pages on "the motor is running hot" — that's four layers upstream of anything a dashboard threshold ever checks. So an engineer opens three Grafana tabs, clicks between metrics, logs, and traces, and spends the first ten minutes of an outage doing correlation by hand before they've even started fixing anything.
That gap — between what the alert says and what actually broke — is where I wanted to put an agent. Not a chatbot that guesses "it looks like the database might be overloaded," but something that does what a good SRE does: reads the alert, queries the data, works out which signal moved first, and only then names a cause.
The Grafana MCP track was a natural fit, since it hands an agent exactly the tools — Prometheus, Loki, Tempo, alerting — that a human uses for this same job.
What it does
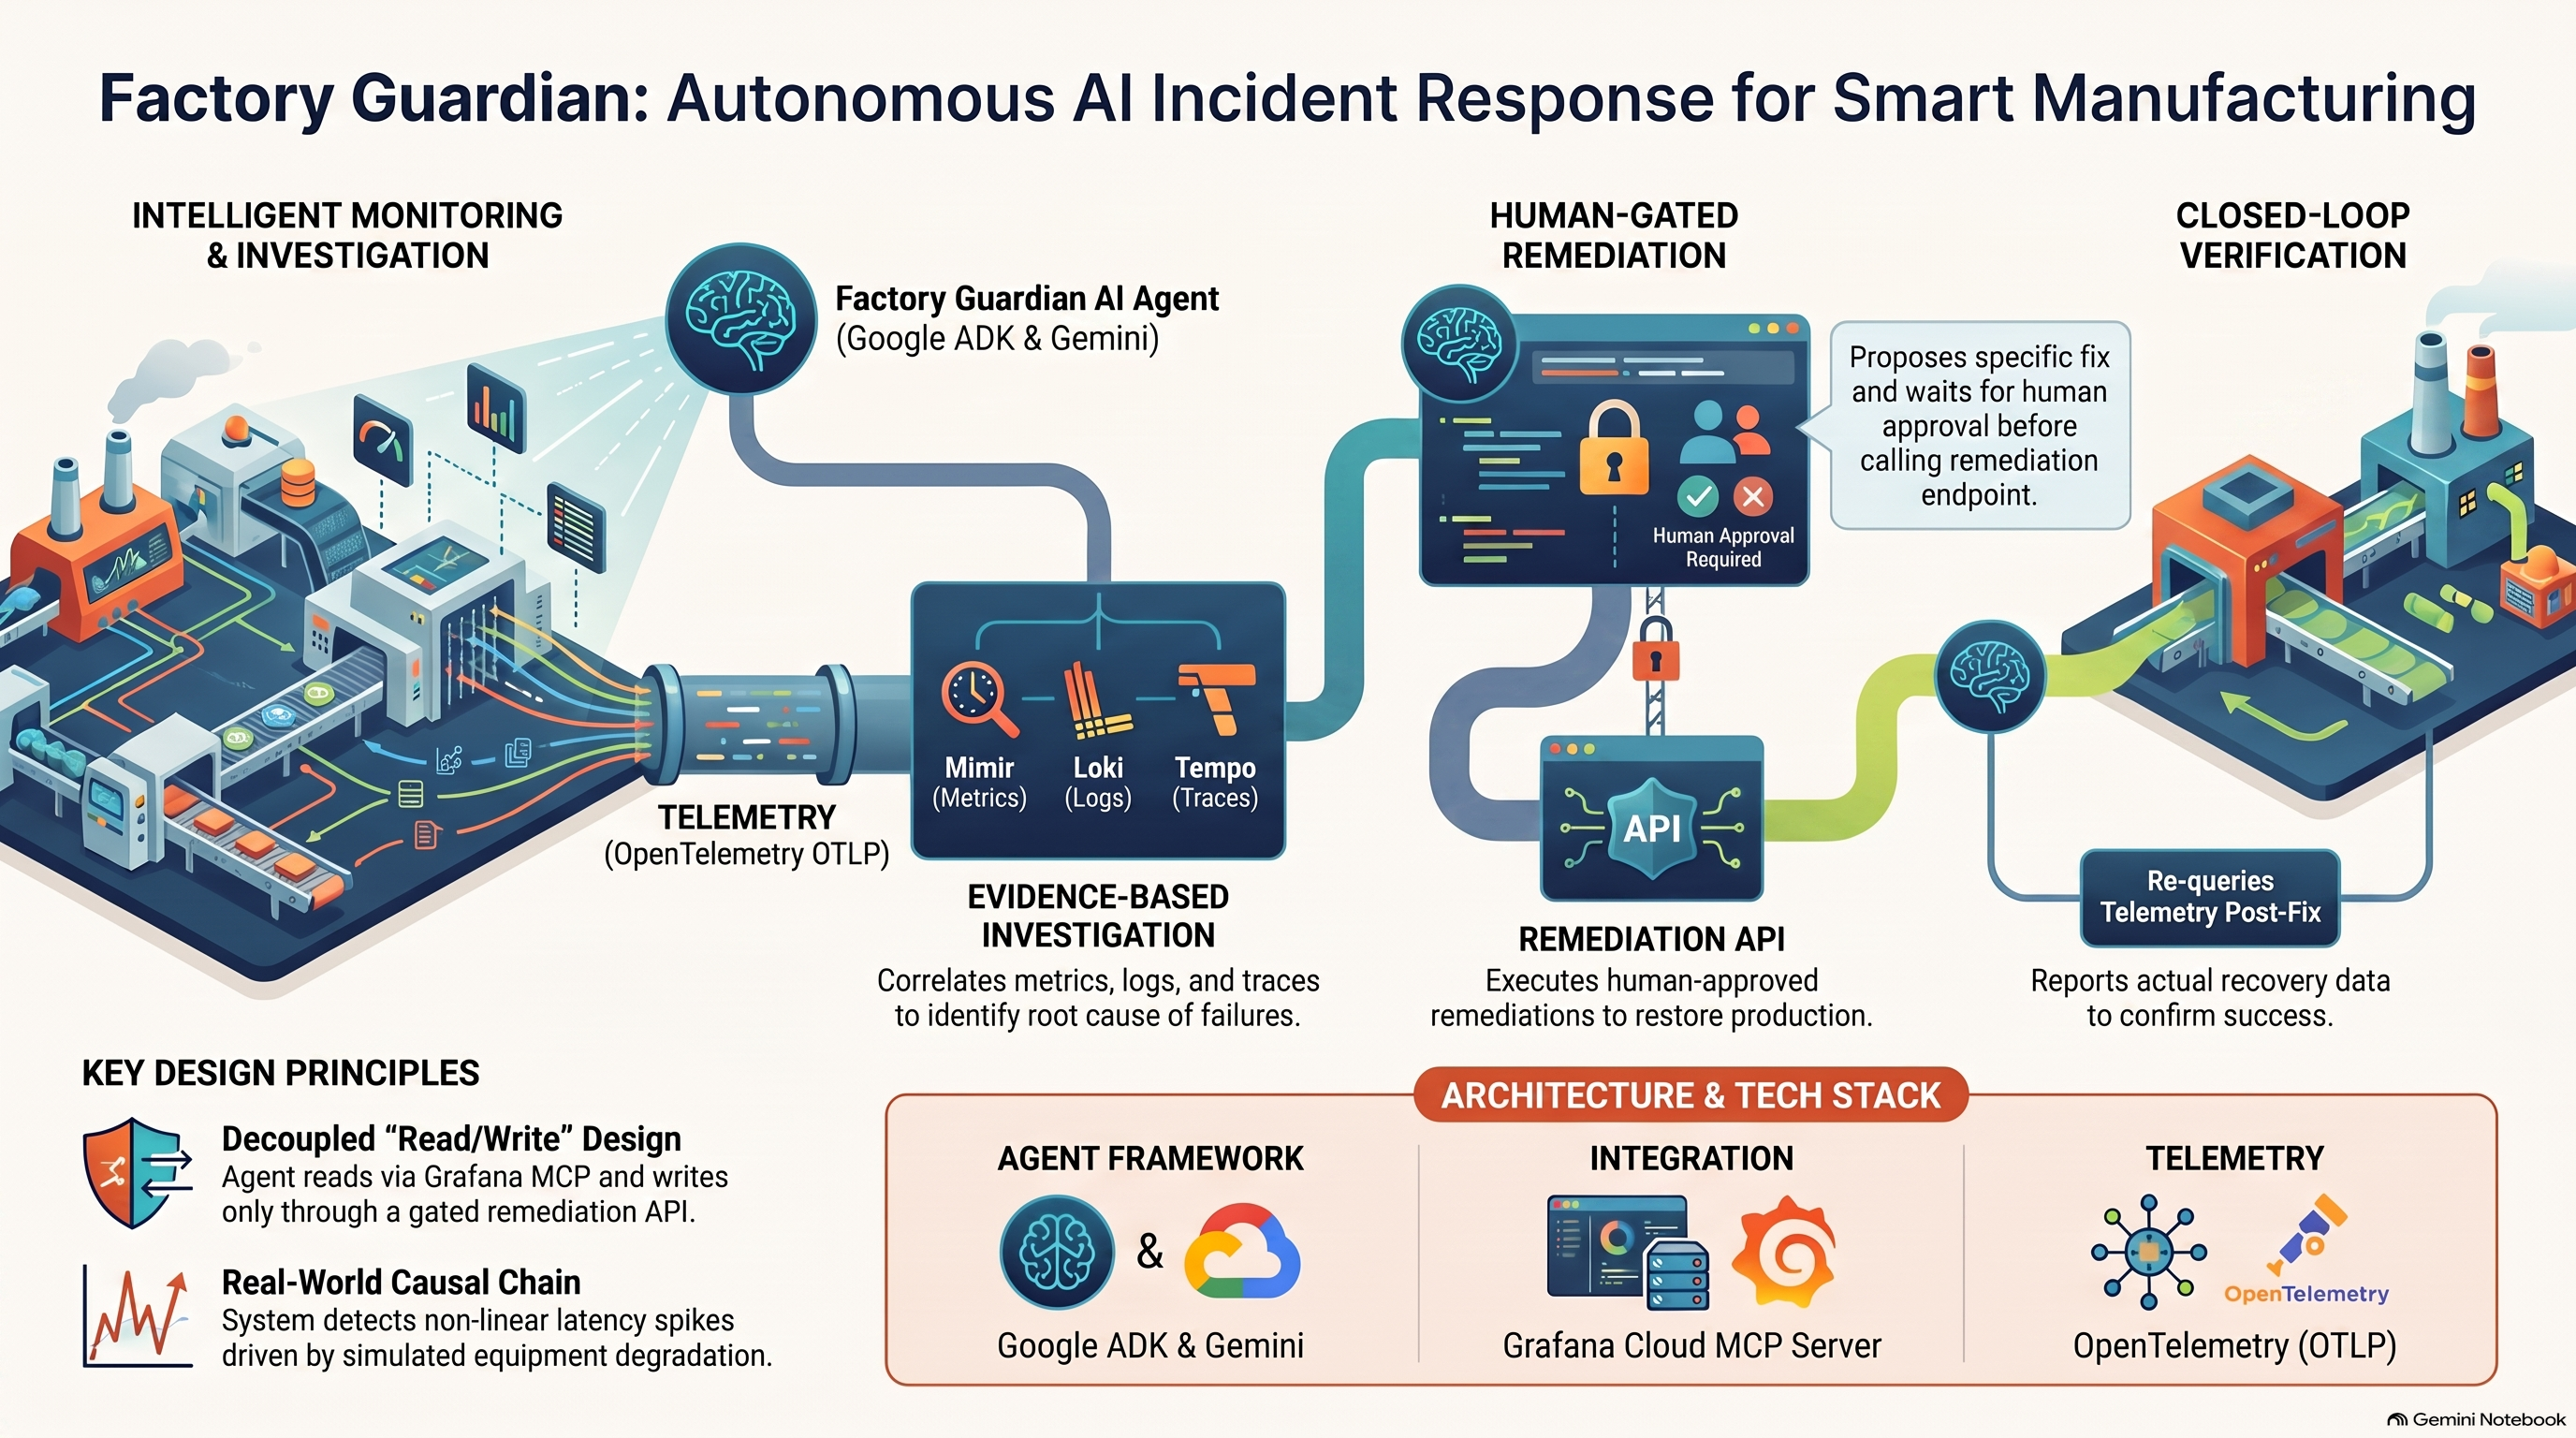
Factory Guardian is an autonomous investigation agent for a simulated factory production line. When a latency alert fires:
- It reads the alert rule and confirms the symptom against baseline.
- It queries metrics across the stack in one pass to find which signal moved first.
- It reads logs for corroborating evidence — timestamps, warnings, error messages.
- It pulls a trace and compares span durations to see where the time actually went.
- It reports a root cause with a confidence level and cited evidence — every number in the report is one it queried, not one it inferred.
- If asked to fix it, it proposes a remediation and waits for a human to approve it — the gate is enforced structurally, inside the tool call itself, not by asking nicely in a prompt.
- Only after approval does it act, and only then does it re-query Grafana and report before/after numbers to prove recovery, rather than declaring victory.
The simulated factory itself is built so the causal chain is real rather than scripted: one hidden variable — equipment degradation, 0 to 1 — drives every visible signal. Motor temperature and unit processing time both rise as degradation increases; processing delay causes request retries; retries saturate the database connection pool; latency spikes non-linearly once the pool nears capacity. Nothing is hardcoded per-metric, so if the agent reports the chain in the wrong order, that's a real failure and it would be visible.
How I built it
I built the world before I built the agent, on purpose — an agent has nothing to investigate without a believable incident to investigate.
The factory simulator (Python/FastAPI) derives seven telemetry signals from one degradation variable, with a deliberately non-linear latency curve so there's a window where the equipment is already unhealthy but the API still looks fine — giving the agent something to actually correlate rather than just reading a single spike.
Telemetry goes out over OpenTelemetry/OTLP to Grafana Cloud: metrics to Mimir, logs to Loki, and one synthetic trace per tick to Tempo, with span durations pulled from the live simulator state so the waterfall reflects reality.
The agent is built on Google's Agent Development Kit with Gemini, connected to Grafana through the MCP protocol. Its instruction routes between a quick-answer mode for simple questions and a full nine-step investigation procedure for incidents, ending in a structured findings report rather than a paragraph buried in chat.
The approval gate is the part I'm most careful to get right: the remediation function is registered with require_confirmation=True, and the check happens inside ADK's tool-execution path before the function runs — so a human has to click approve before anything in the simulated factory changes. I tested this both ways: calling it without confirmation during a live incident returns a rejection and the incident state is untouched.
The operator console puts live telemetry panels next to the agent chat, with a pinned findings panel, a trace waterfall, and a before/after recovery table, so the conclusion doesn't require scrolling through a transcript to find.
Challenges I ran into
None of the hard parts were the ones I expected going in.
- The Gemini free tier isn't built for agentic loops. An agent resends its whole transcript every turn, and raw trace JSON runs 10–30k tokens per tool call — enough to blow through a 250k-tokens-per-minute cap in a handful of turns. I fixed this with a tool-result truncation callback and a trimmed toolset, and handled the free tier's transient capacity errors with retry backoff rather than upgrading to a paid tier.
Every one of these was reproduced before I fixed it — watching the alert actually go to firing, reproducing the 503 with repeated requests, calling the remediation tool without confirmation to confirm the gate held. Nothing here was fixed on a hunch.
Accomplishments that I'm proud of
- It finds the root cause unaided, four causal layers upstream of where the alert actually fired, and cites the specific query and timestamp behind every claim in its report.
- The approval gate is real, not decorative — verified both by reading the code path and by testing the rejection case directly.
- It proves recovery with numbers instead of asserting it: API latency from 6,834ms to 199ms, error rate from 14.8% to 0.20%, database pool utilization from 100% to 39%, motor temperature from 97.8°C to 66.7°C.
- All three signals the track asks for — metrics, logs, and traces — are not just queried but visibly on screen at once, including a trace waterfall where a single database query span consumes over 80% of the request duration.
- The whole investigation loop runs comfortably inside Gemini's free tier.
What I learned
The interesting engineering in an agent project isn't usually the model call — it's everything around it. Making the simulated world honest enough that the agent's "discovery" is a real discovery. Making the approval boundary a structural guarantee instead of a prompt-level suggestion, because a boundary you can talk your way past isn't a boundary. And learning to distrust my own assumption that a strange failure must be an AI failure — the two most confusing bugs in this project were, respectively, eight lines of frontend JavaScript and a missing URL-encoded space.
What's next for Factory Guardian
- Surface a deep link back to the relevant Grafana dashboard and time range as part of the agent's findings report.
- Use Grafana's incident (IRM) tooling to open and resolve a real incident record alongside the investigation, rather than only reading the alert rule.
- Test the agent against a scenario that doesn't match its current causal prior, to see whether it verifies rather than assumes.
- Extend from a single production line to a small fleet, where the interesting problem becomes distinguishing a shared upstream cause from several independent ones.

Log in or sign up for Devpost to join the conversation.