-
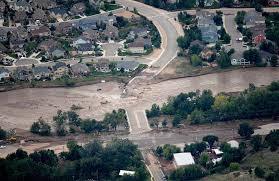
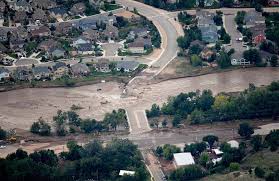
Figure 1: Floods In Boulder, Colorado
-
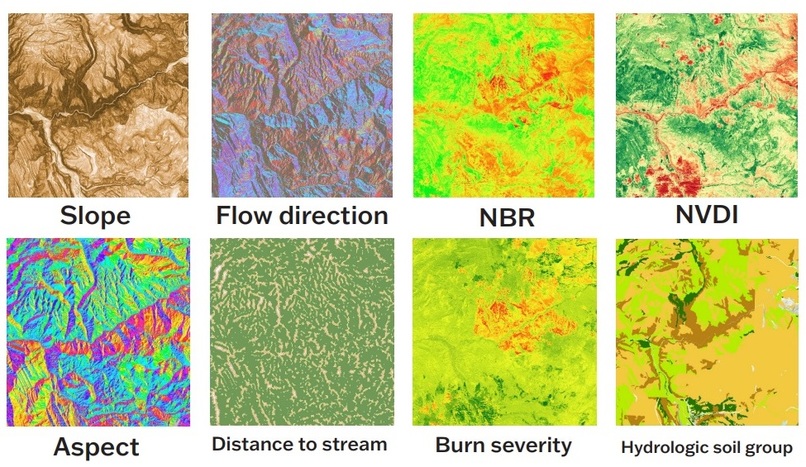
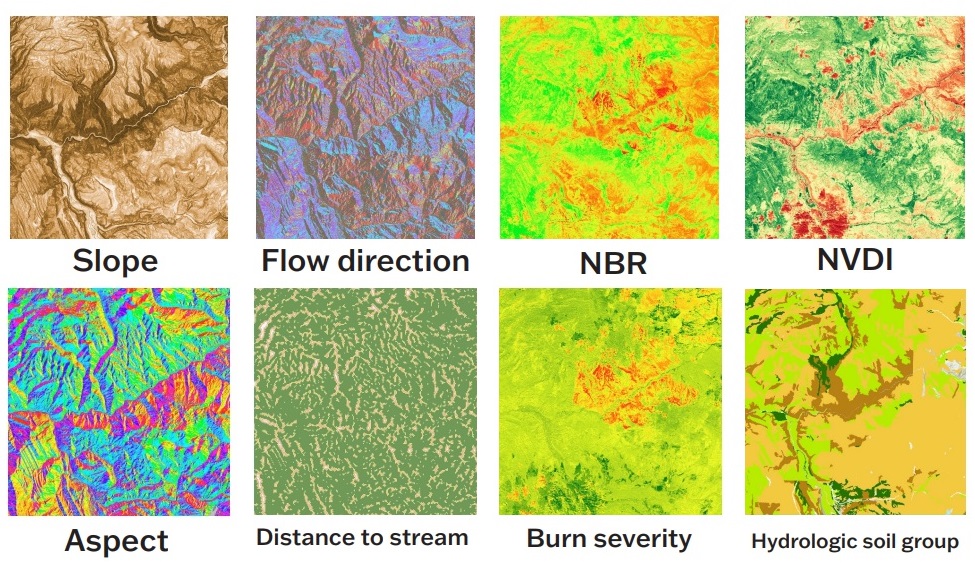
Figure 2: 8 LULC and Hydrological Features
-
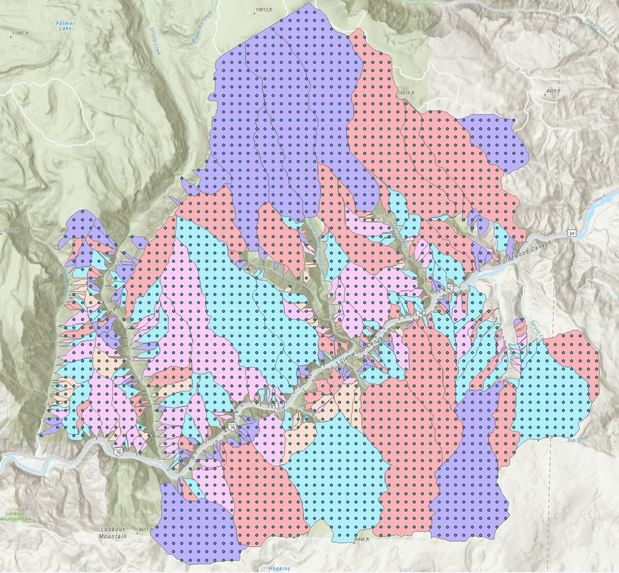
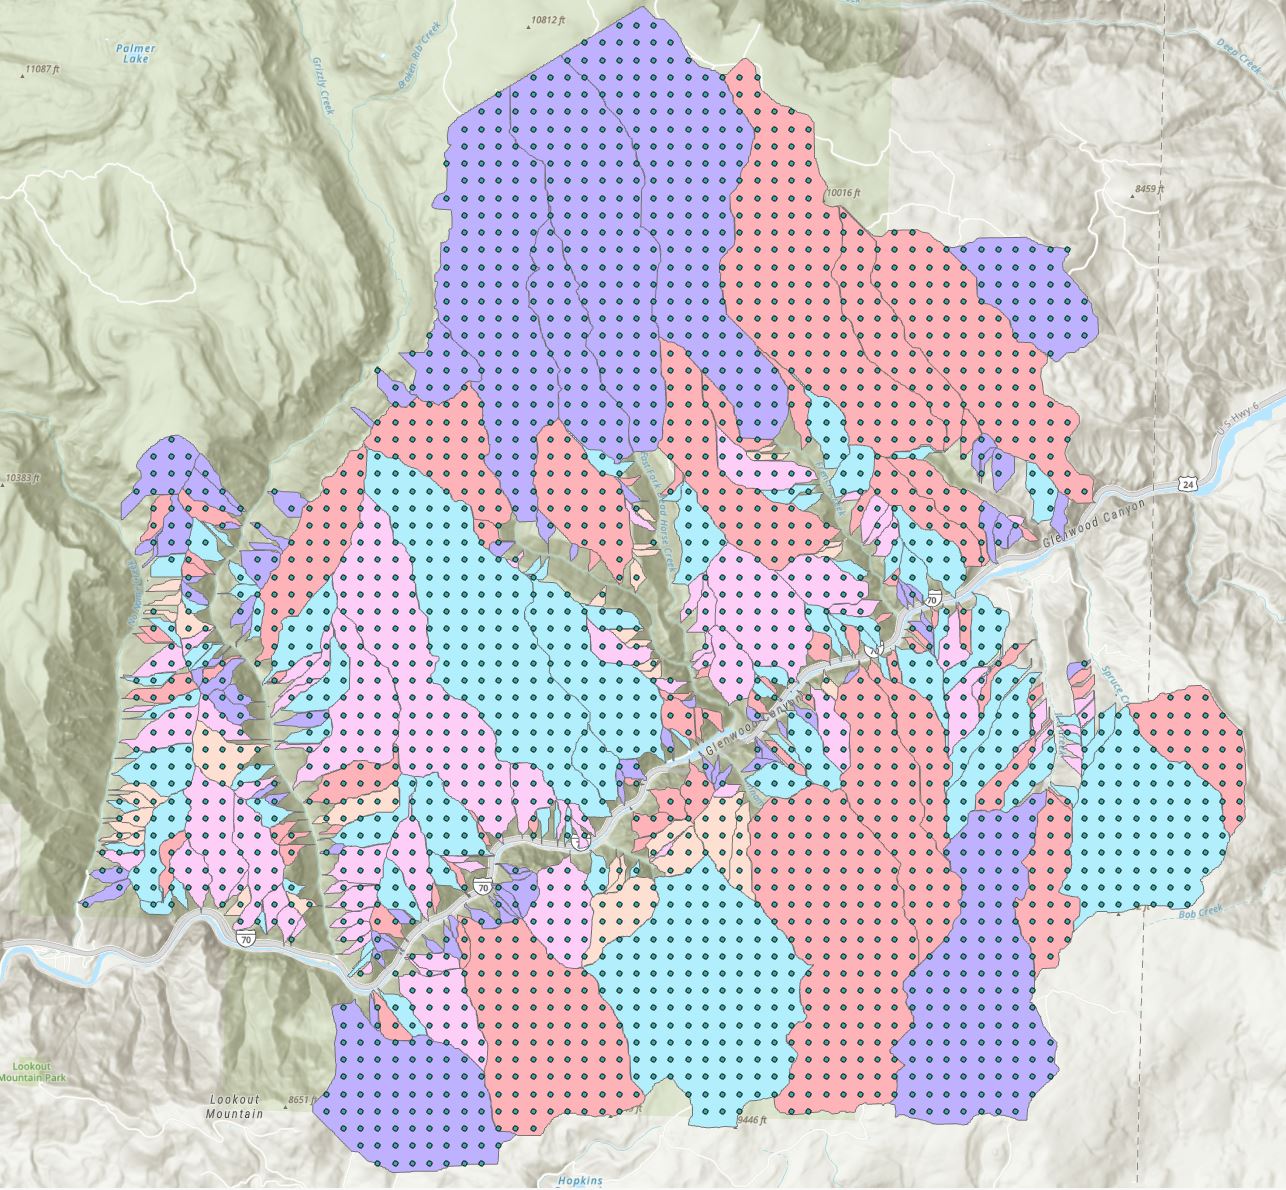
Figure 3: Training Samples Obtained from USGS Debris Flow Hazard Map
-
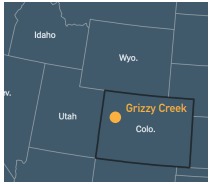
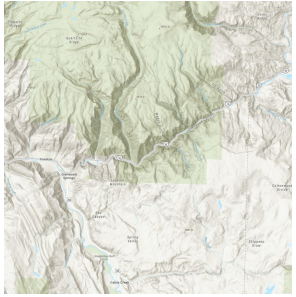
Figure 4: Location of 2020 Grizzly Creek Fire
-
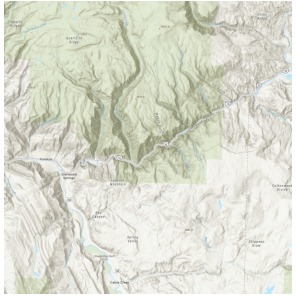
Figure 5: Area of Interest in Project
-
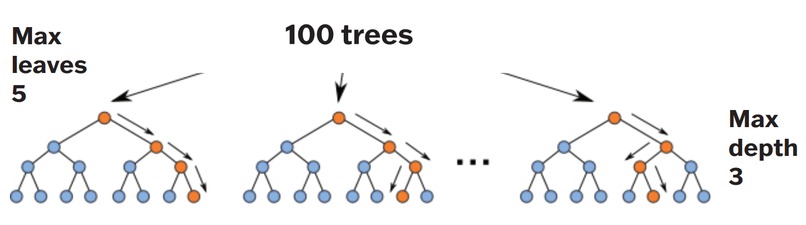
Figure 6: Random-Model Implemented in Project
-
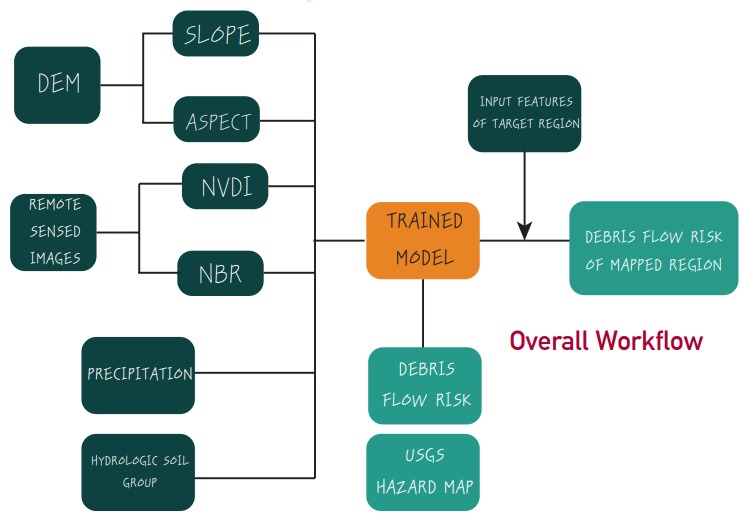
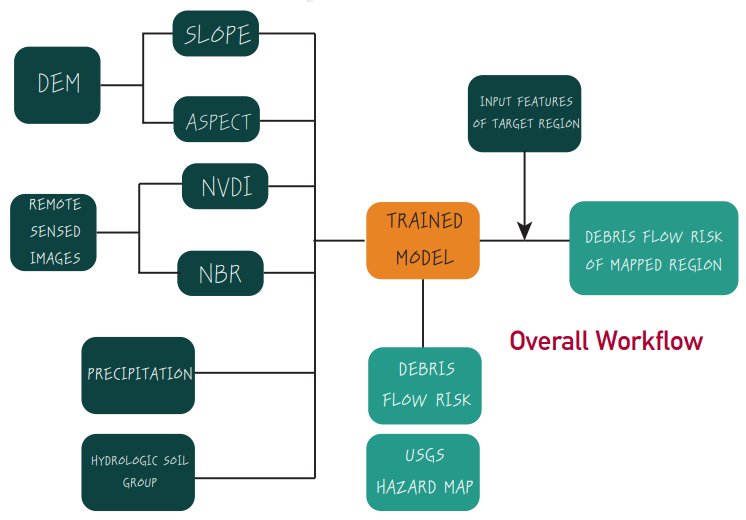
Figure 7: Overall Workflow Used in Project
-
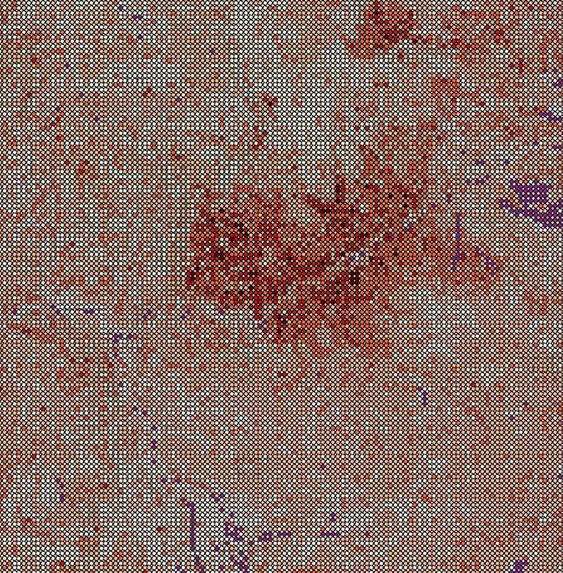
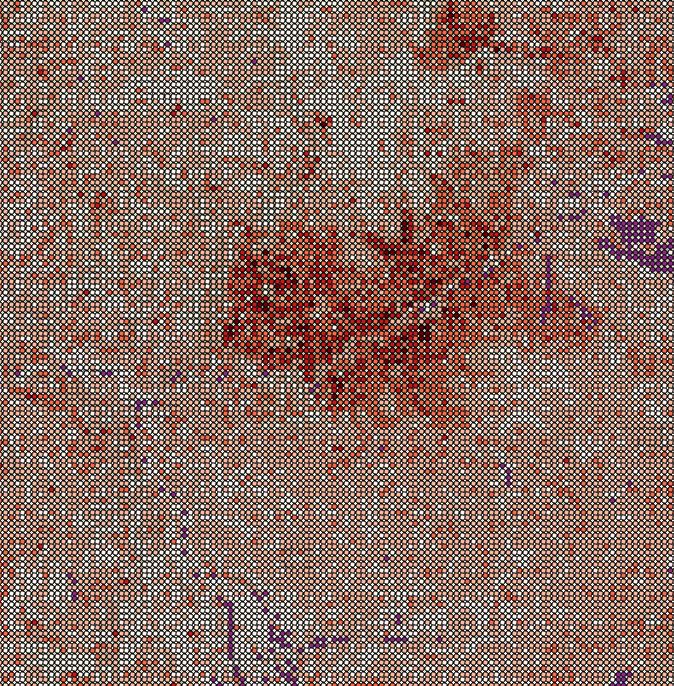
Figure 8: Predicted Debris Flow Risk


Inspiration
The escalating climate crisis and rapid urbanization have been driving a global increase in extreme wildfires. In addition to the immense amount of social and economic losses stemming directly from the fire, large-scale wildfires also dramatically alter the terrain and ground condition. This is a major challenge for watershed management, as the ground is left charred, barren, and unable to absorb water, creating conditions ripe for flash floods, debris flow, and mudslides (FEMA, 2012). Figure 1 shows the devastating results of the indirect impacts of floods in a local community, which are compounded after a Wildfire.
In addition, as all of our group members are Engineers we are keen in being involved in projects that are directly affecting the communities we are living in, and finding solutions that would mitigate economic and societal losses after a disaster. This project represented an opportunity that balances both the expertise we gained at Stanford regarding Multi-Hazard Risk & Resiliency, and the duties that we have to the general public.
What it does
The goal is to train the model to categorize the mapped area into these risk zones using topological features. The rise in the capabilities of remote sensing (RS) and geographic information system (GIS) was leveraged to extract these relevant parameters regarding the land-use/land-cover (LULC) and hydrological characteristics of the study area. Sentinel 2 remote sensing images were used for identifying the LULC data. To generate the training dataset, the area of interest is` first discretized into roughly 10,000 grid points with a general spacing of 250m. For each grid point, there is an associated degree of debris-flow risk that was developed by the USGS. Please refer to Figures 2 and 3, which shows the 8 LULC & Hydrological features and the Training Sample Grid Points respectively.
A review of the current literature revealed that the assessment of debris flow after a wildfire event requires a litany of information that is not always readily available or easy to acquire. Even after all the necessary information is obtained, there is no agreement among the scientific community on the weighting to apply to each variable. Therefore, our project examined non-parametric machine learning techniques that eliminates the use of weights to fit a more flexible functional form and reduce the use of assumptions regarding the underlying model. Additionally, this project will look at a reduced set of features as compared to traditional models on debris flow, using features that are readily accessible through public sources. The ability to quickly quantify or identify potentially heightened debris flow risk immediately after a wildfire event will allow policymakers to anticipate and prepare for future events in the area with more effective city planning and policymaking. More importantly, it will help homeowners understand their exposure to the hazard, so that they can remain informed and plan accordingly.
How we built it
This project involves the use of topological parameters to identify the degree of debris-flow risk. Grizzly Creek, Colorado was selected as the study area due to its high exposure to both wildfire and debris flow risk, which is attributable to the region’s dry climate and mountainous terrain with dense forestry. In addition, the area has the precedence of having such an event in the past, where the wildfire was coupled with severe debris flow following the event, thereby providing a solid foundation for data collection. For this study, the 2020 Grizzly Creek Fire was chosen as the event of interest. Please refer to Figure 4 and 5 to see the location of the Grizzly Creek fire and the area of interest.
One unique characteristic of geospatial phenomenon and environmental data is its nonlinearity – meaning that linear models have limited applicability due to the data’s spatial non-stationarity. To allow for non-parametric learning, we employed a random-forest model to prevent overfitting, a maximum depth of 3 is used; the amount of data available to the tree is kept to 100%. Please refer to Figure 6, which shows the Random- Forest model that was implemented to solve this problem. For the overall process implemented in the project please refer to Figure 7.
Roughly ten thousand grid points were generated within the Grizzly Creek burn region. These ten thousand observations were split into 70% training data and 30% test data, and the model was trained using the 70% training data, and the remaining 30% test data was used to assess the quality of the model.
Challenges we ran into
One prominent issue that we ran into was during the Data acquisition, particularly in terms of the resolution of the remote sensing images. For instance some of the layers that were extracted had too much cloud cover, which directly effected the quality of the data obtained through this modality. Another challenge that was tackled during this project was that there were some uncertainties in relationships with the parameters/ features of interest. However, this issue was addressed through the use of non-parametric modeling.
Accomplishments that we're proud of
Our trained model was able to achieve a reasonable accuracy of 71.3% in predicting the debris flow risk. Although this accuracy might be on the low end in terms of acceptable prediction accuracy. The complexity of our problem and the uncertainty regarding the relationship between the features in our model make it significantly difficult to obtain a high accuracy. In addition, as this project is one of the first in solving this particular problem, this accuracy is still deemed to be a success as it demonstrates promise in the methods we have implemented in this project. Please refer to Figure 8 for the predicted Debris Flow risk.
What we learned
During this project we were able to successfully learn the different software's and methods that were implemented during the data acquisition process of the project. We were also able to experiment with different combinations of ML models, and found one that was able to achieve our objective of predicting debris flow risk following a wildfire.
What's next for f3: Flood Following Wildfires
For our current project we have only quantified/ predicted the debris flow risk following a wildfire. Due to the promising results obtained from this project, we are planning to implement a similar approach to predict and classify the flood risk for a given area after a wildfire. The quantification of flood risks following a wildfire will be essential information for local residents and first responders, as areas that have been recently effected by a wildfire are particularly vulnerable to floods. Additionally, we are planning on implementing some potential improvements to the ML methods implemented in the project. For instance the relative simplicity of random forest model makes it not as competitive as other supervised learning approaches. Therefore, to improve upon the results of this baseline model produced for the Hackathon, it would be wise to investigate the other non-parametric machine learning techniques.

Log in or sign up for Devpost to join the conversation.