-
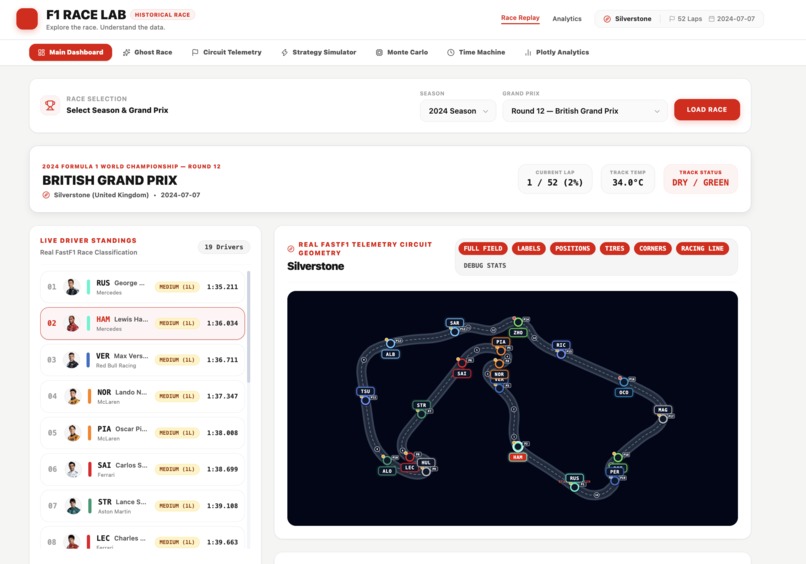
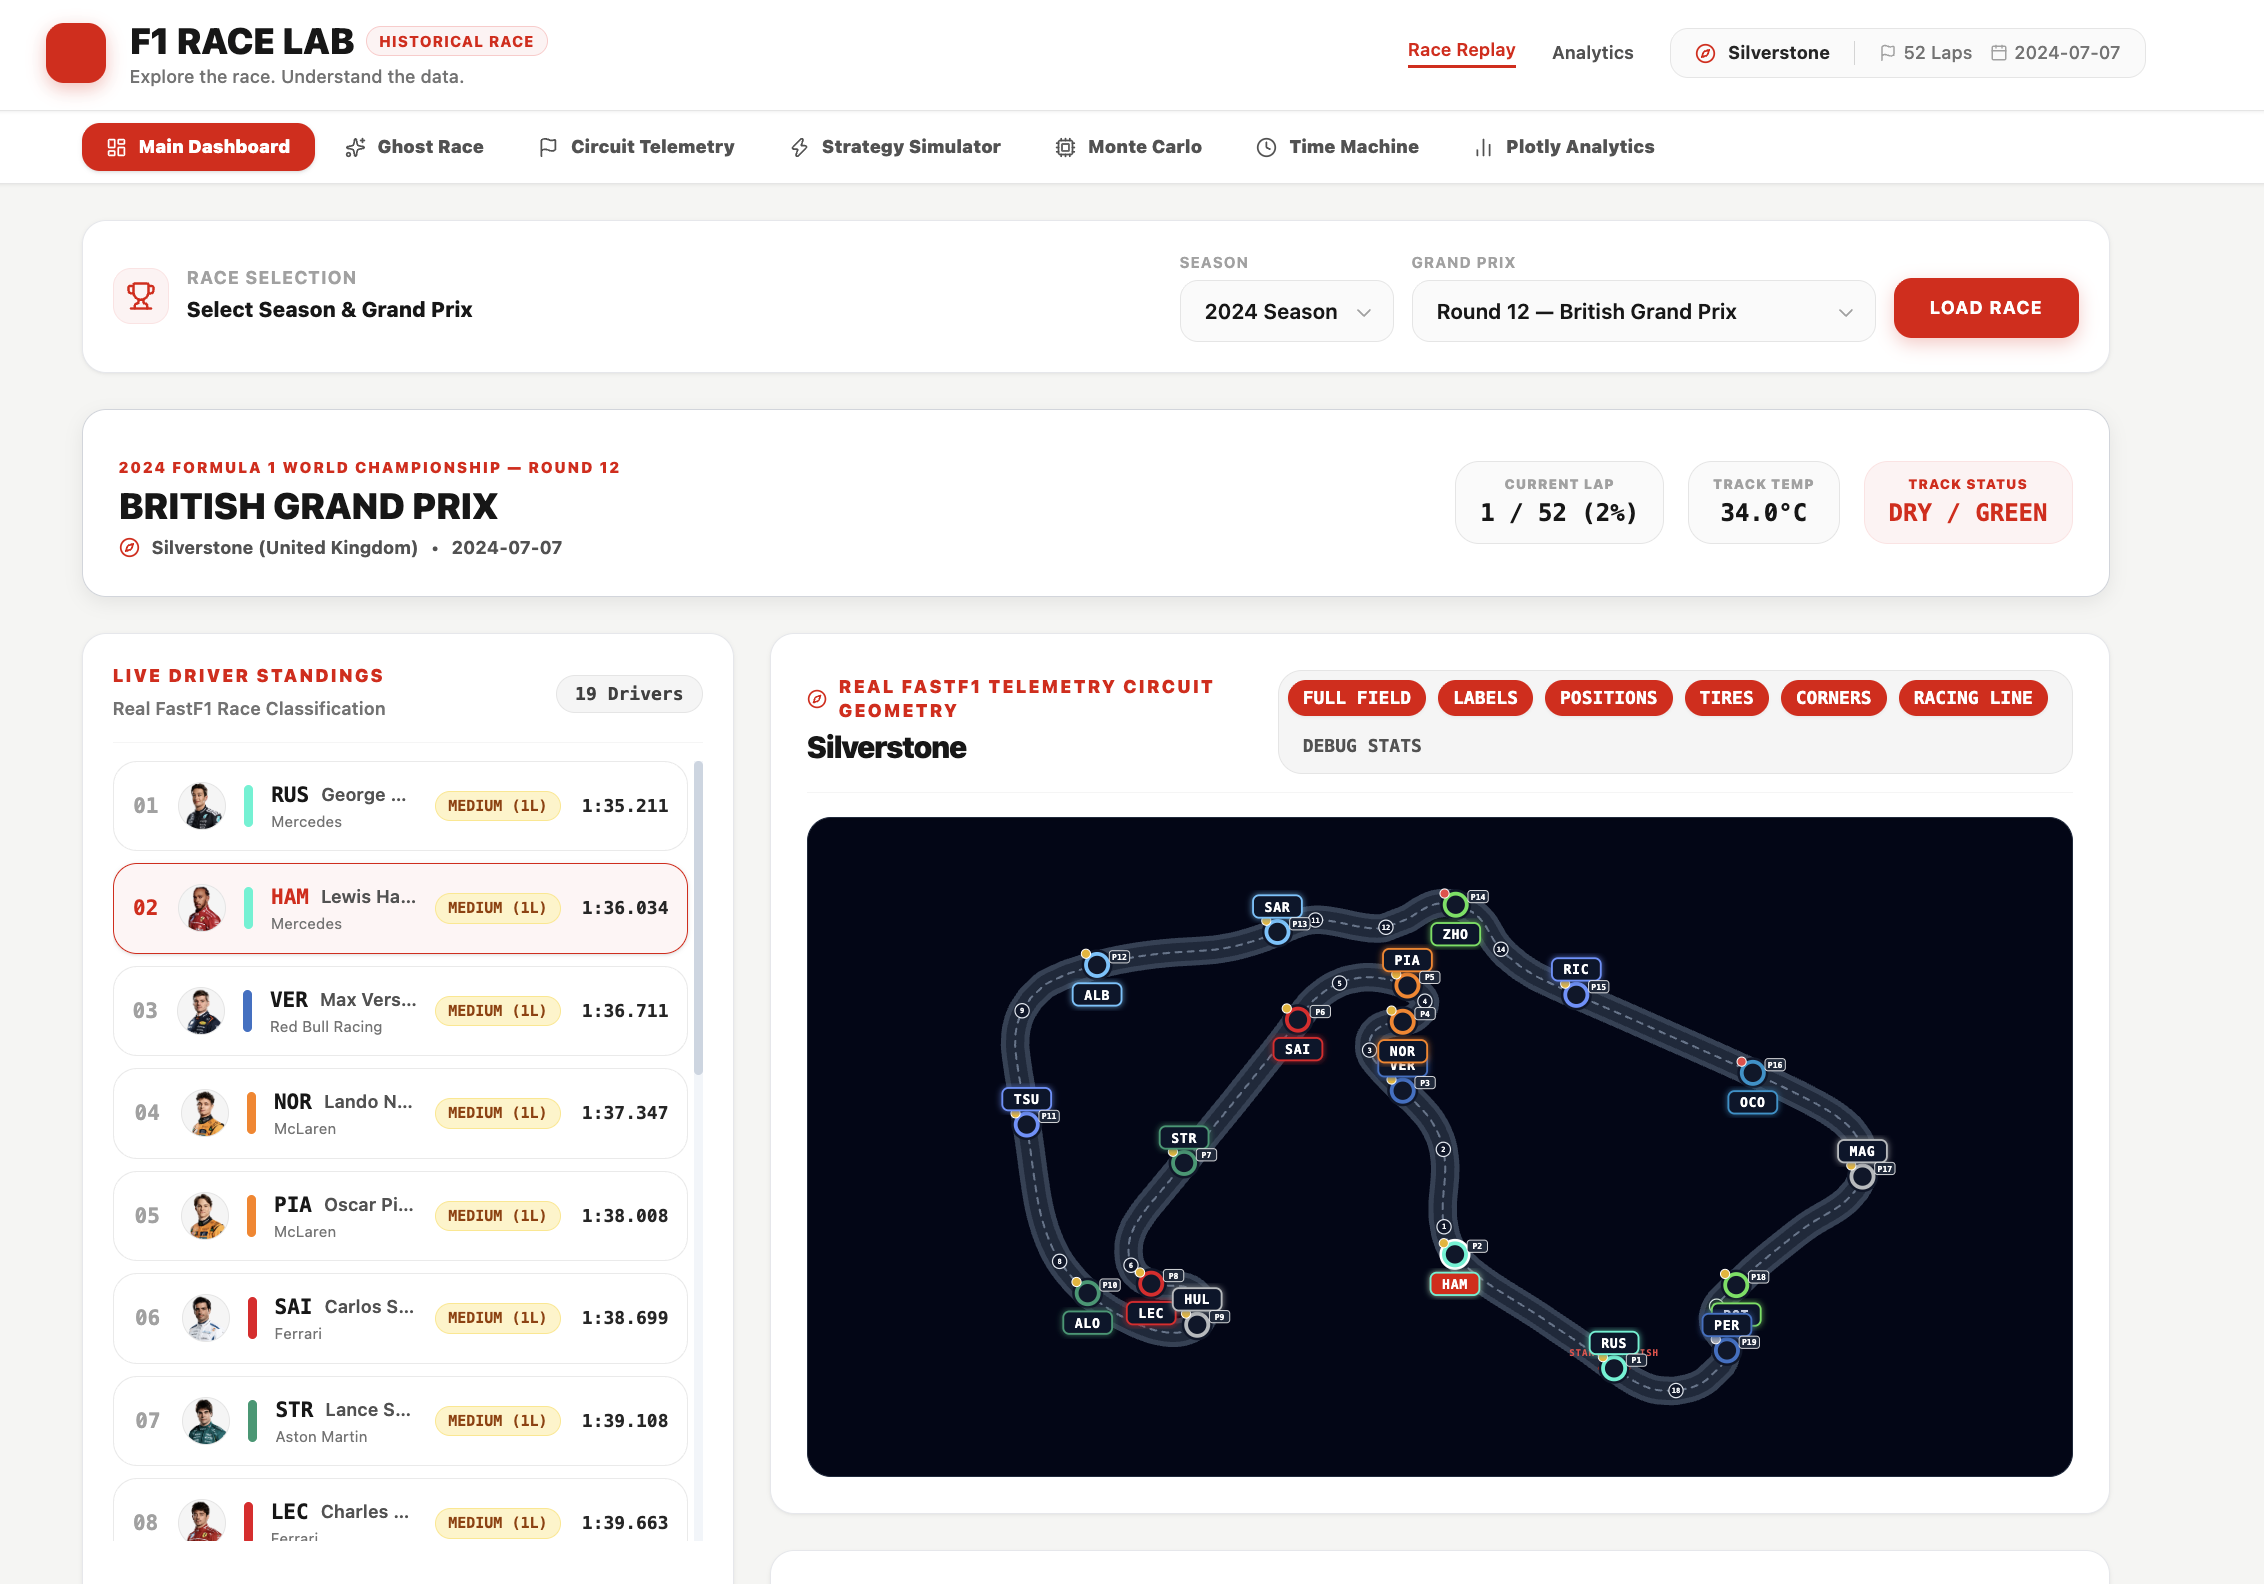
Load and compare multiple historical F1 races, with lap-by-lap timings, driver positions, tires, and race progression for every driver.
-
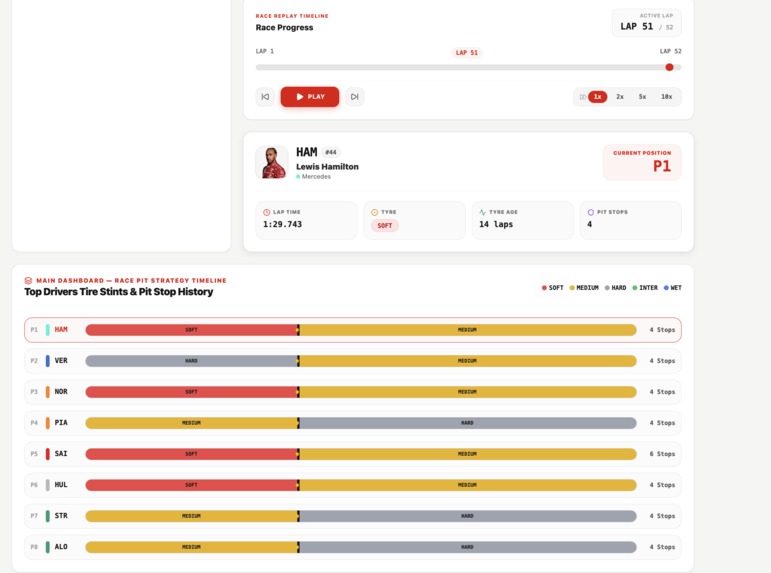
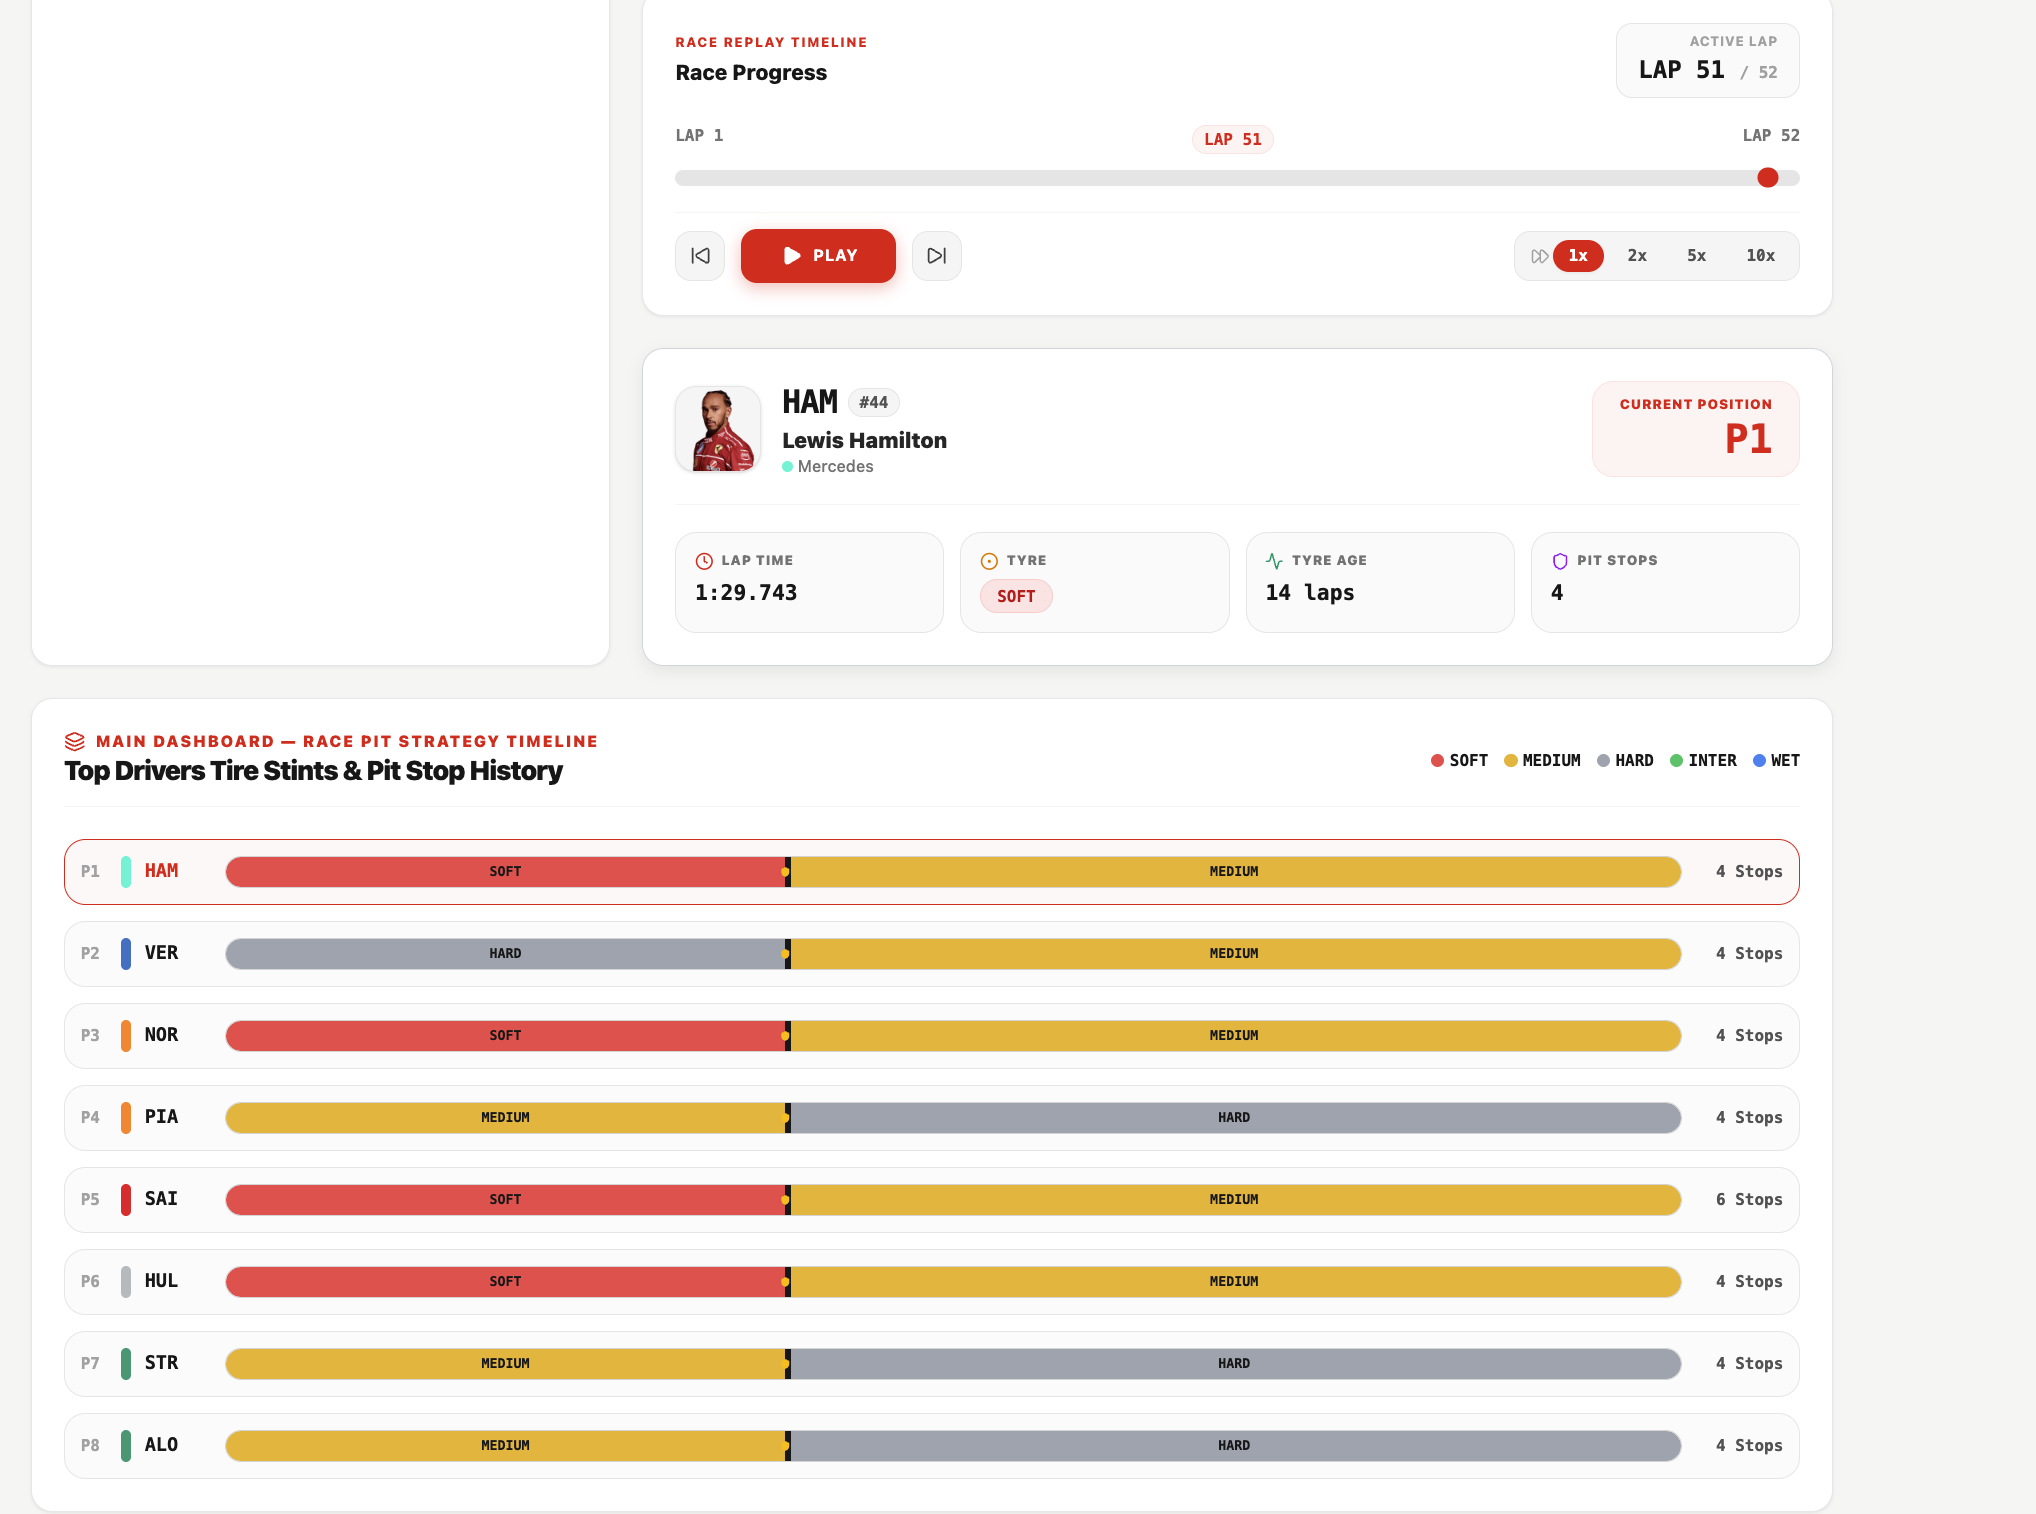
Compare multiple historical F1 races, viewing each driver’s lap times, positions, tire compounds, and the tire type used at every pit stop.
-
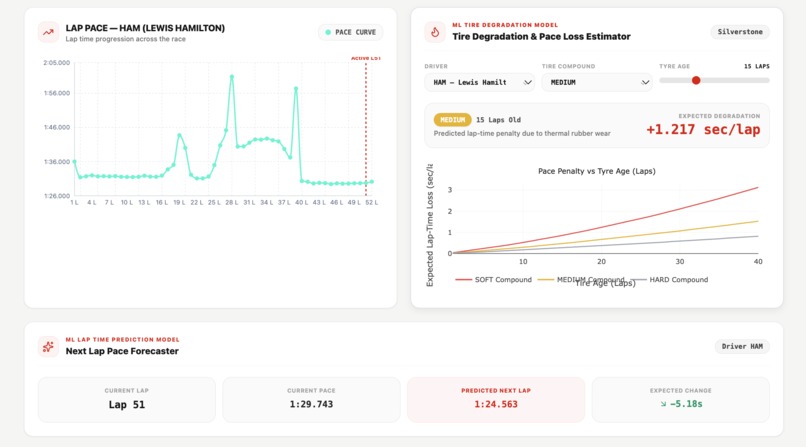
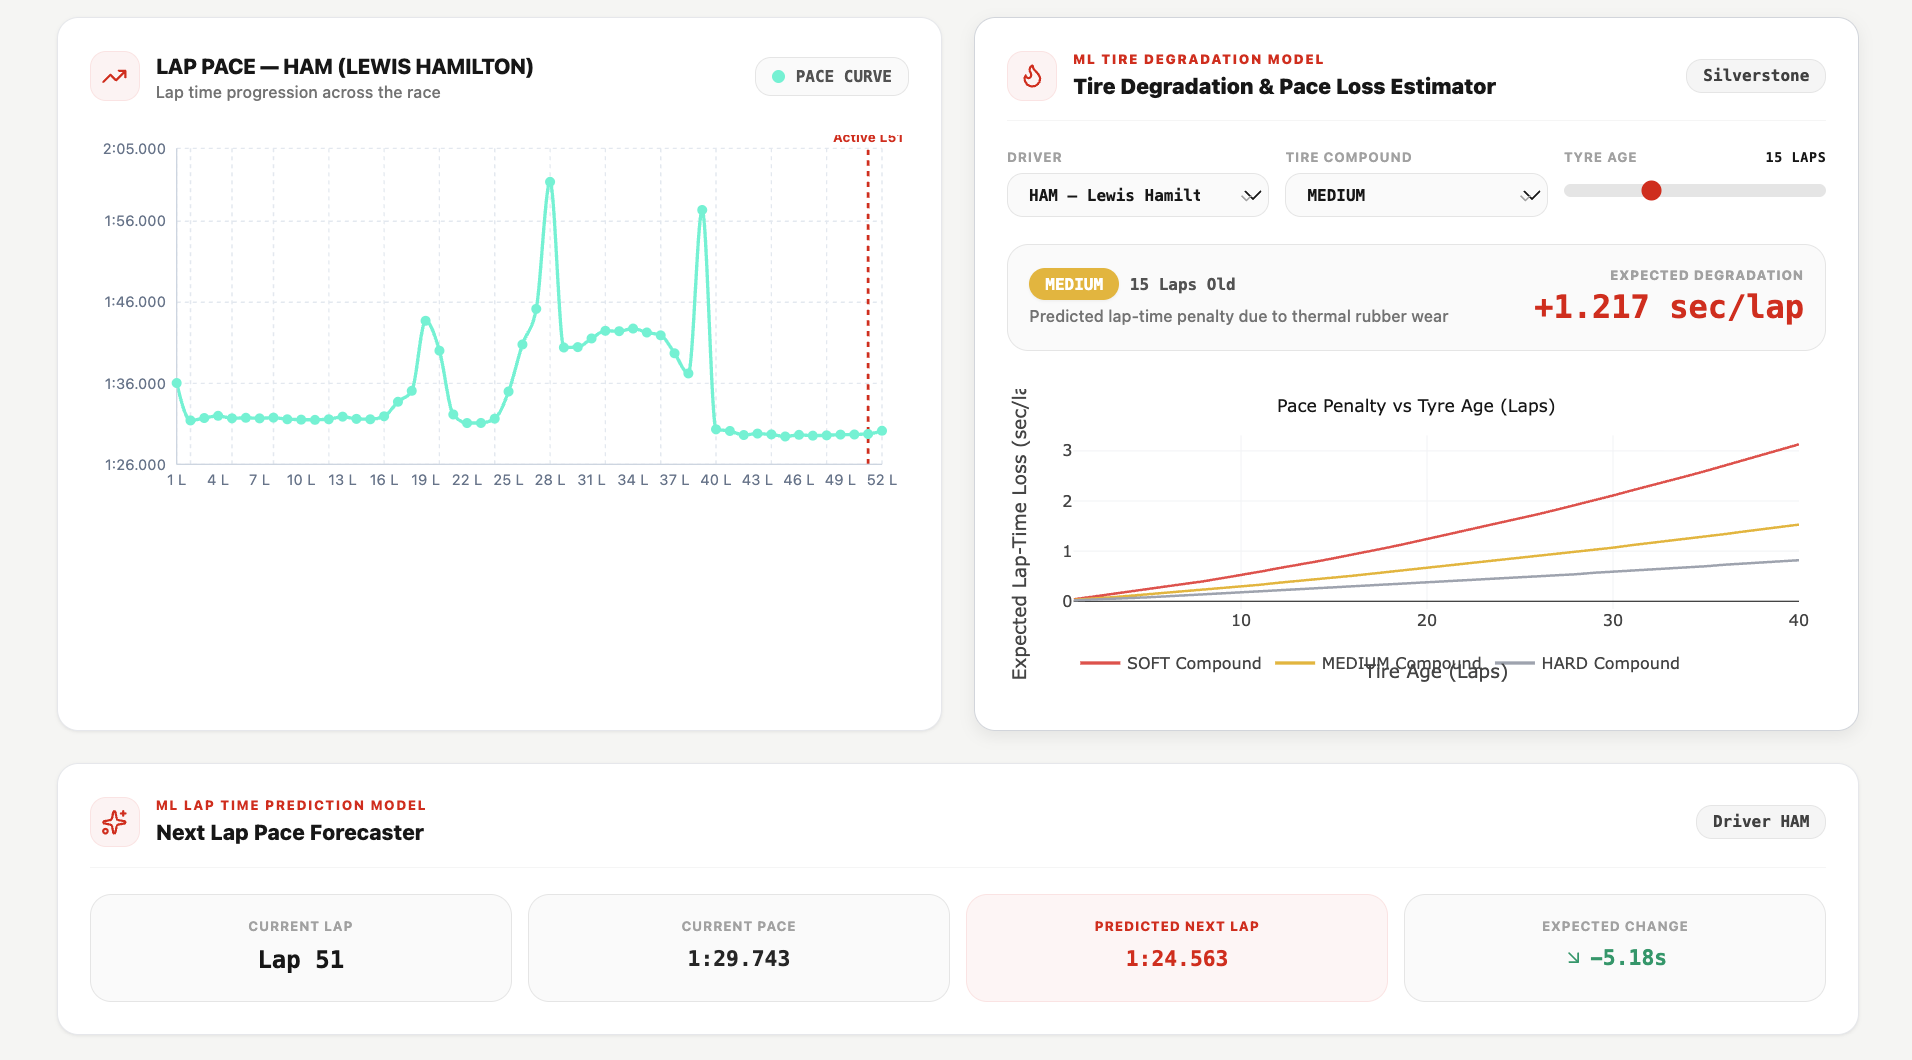
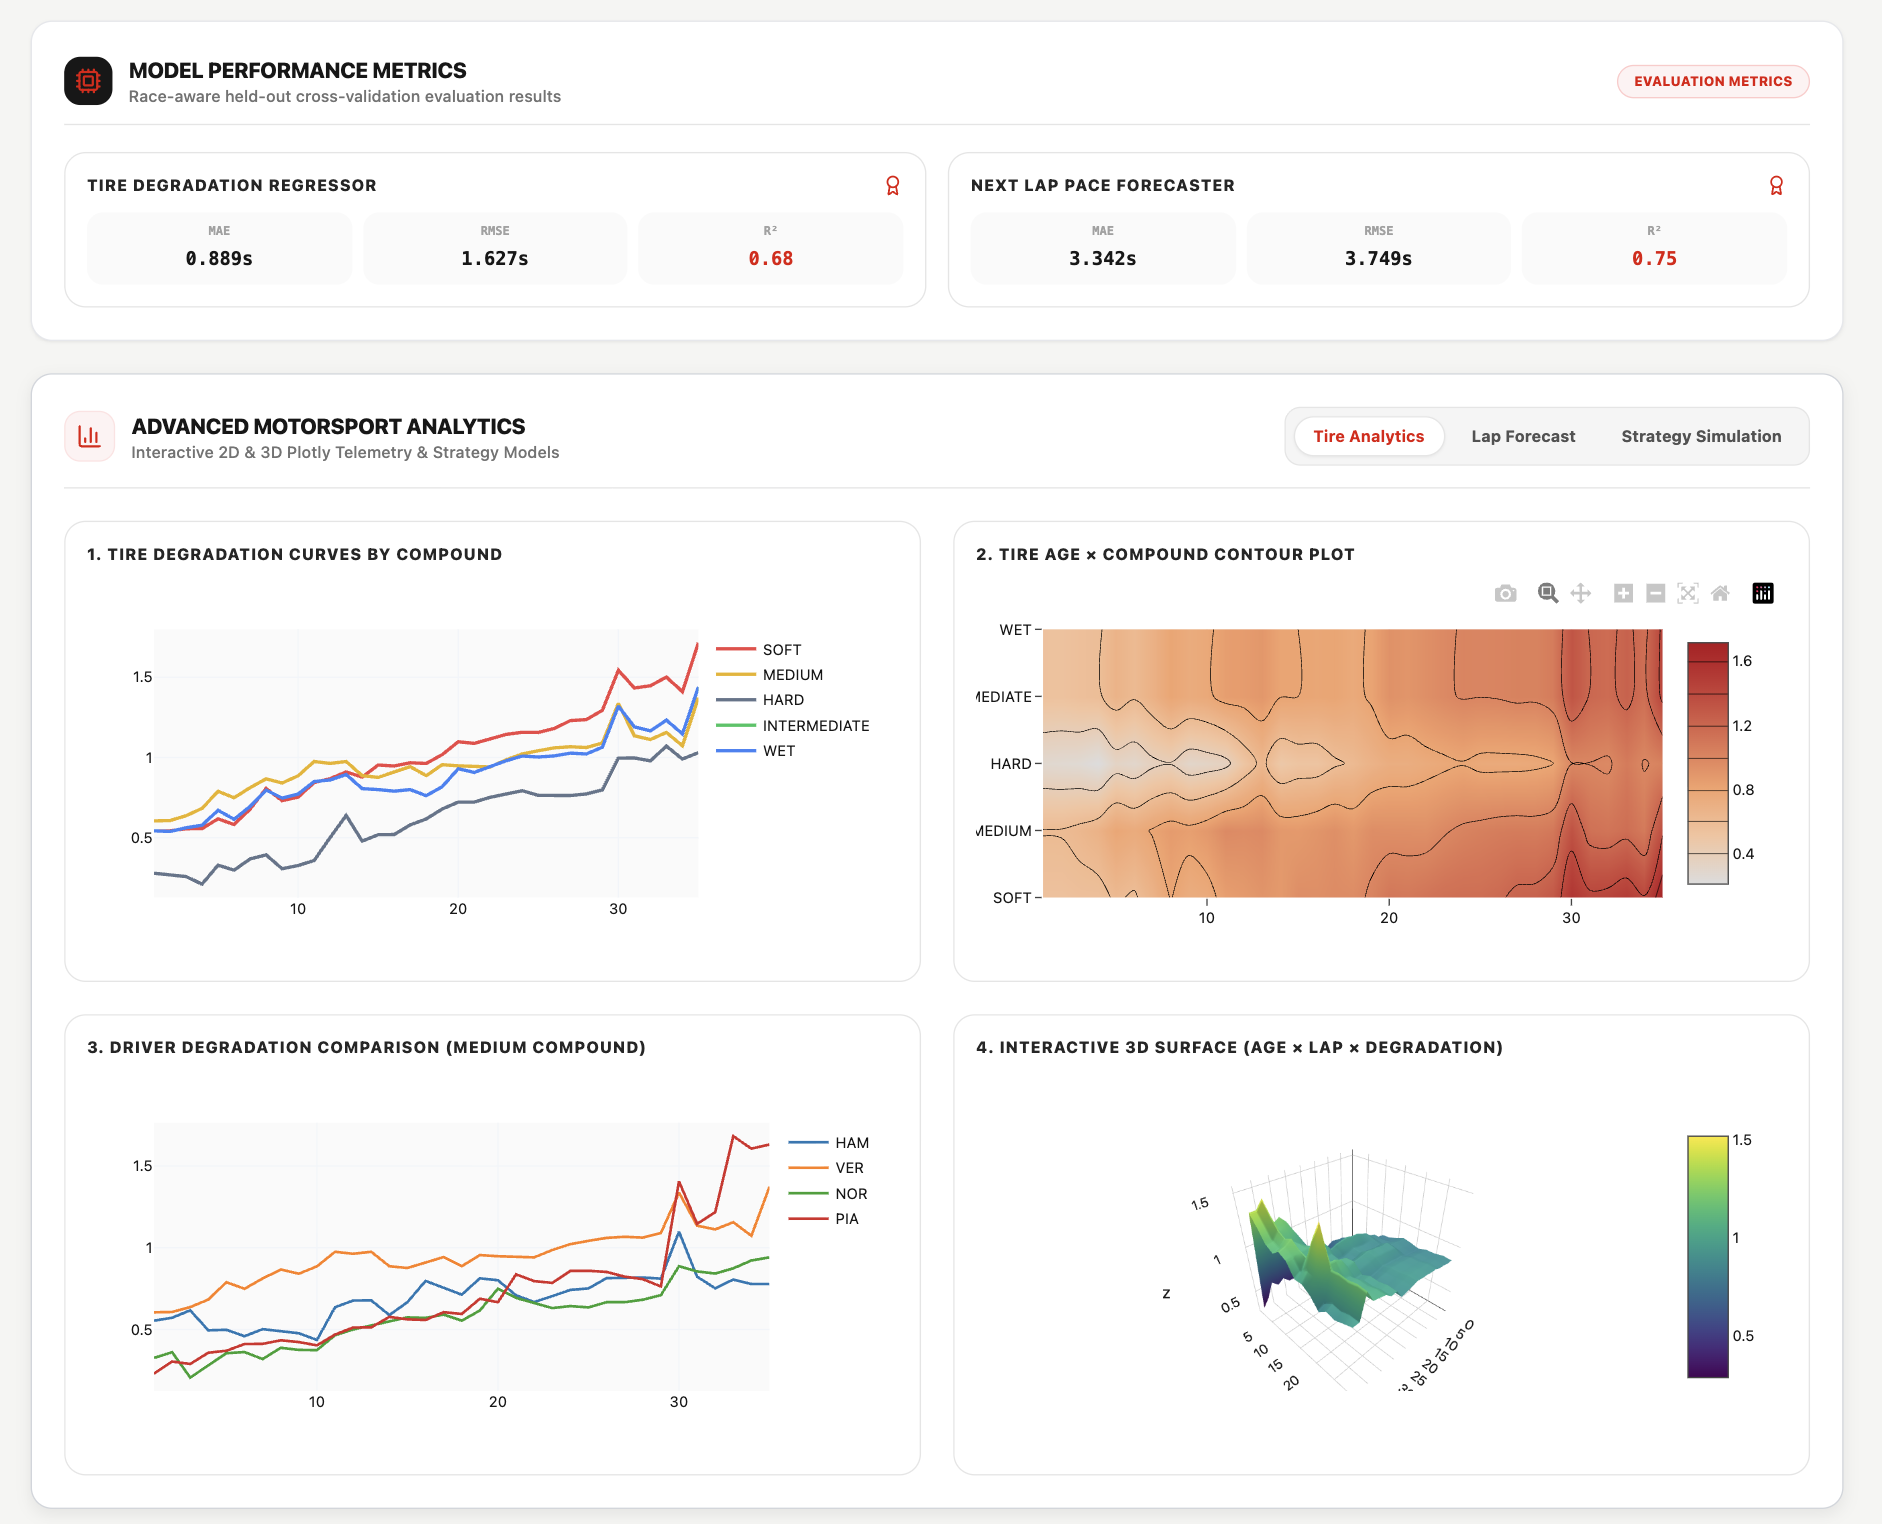
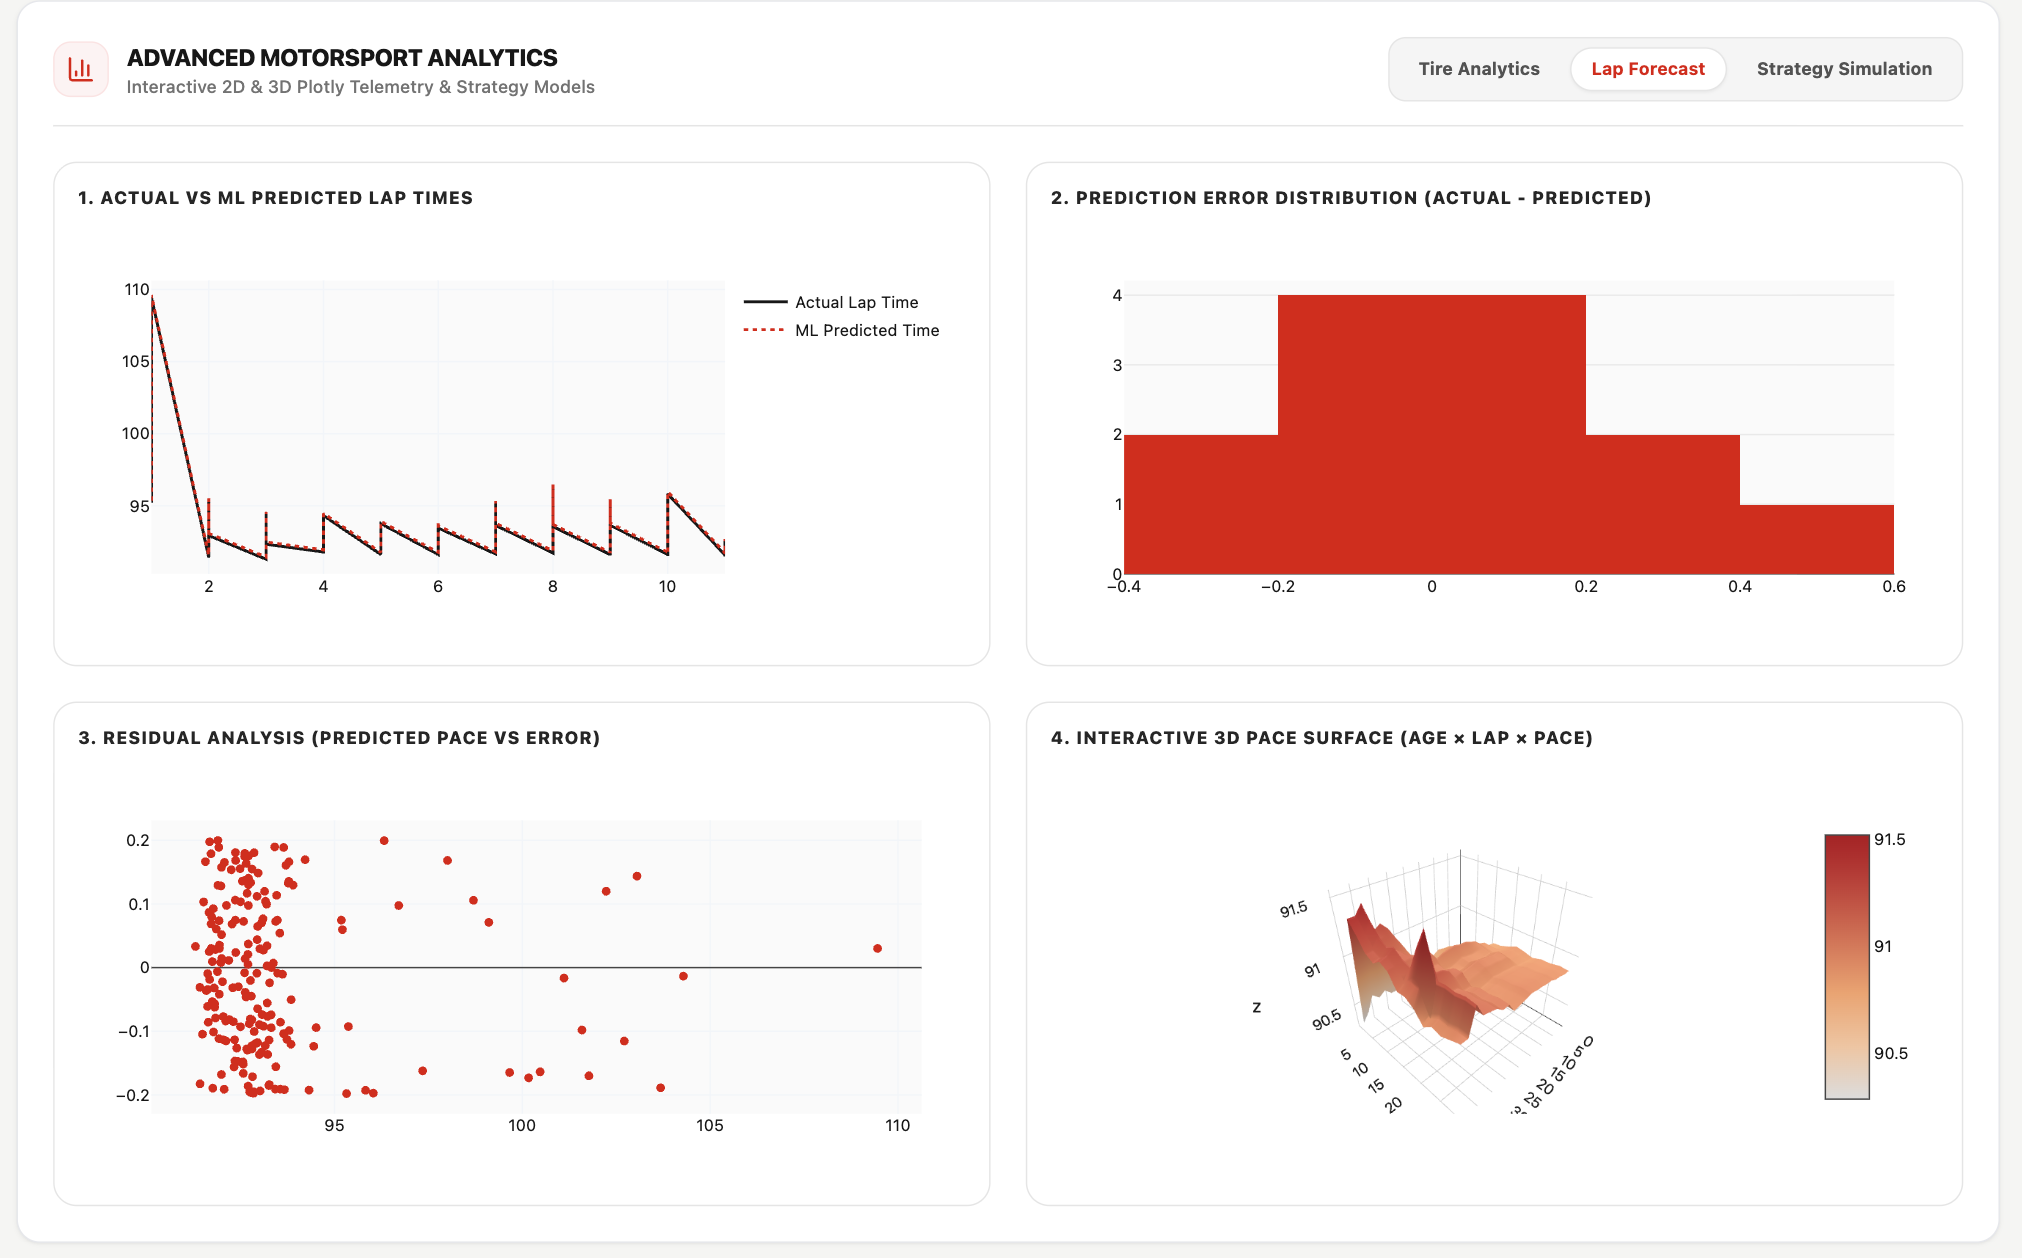
Interactive graphs showing each driver's lap times, tire degradation trends, and predicted next-lap performance across the race.
-
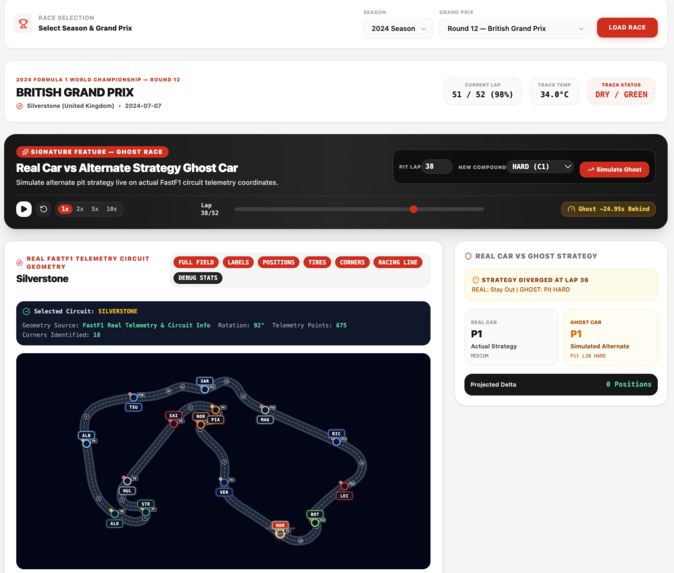
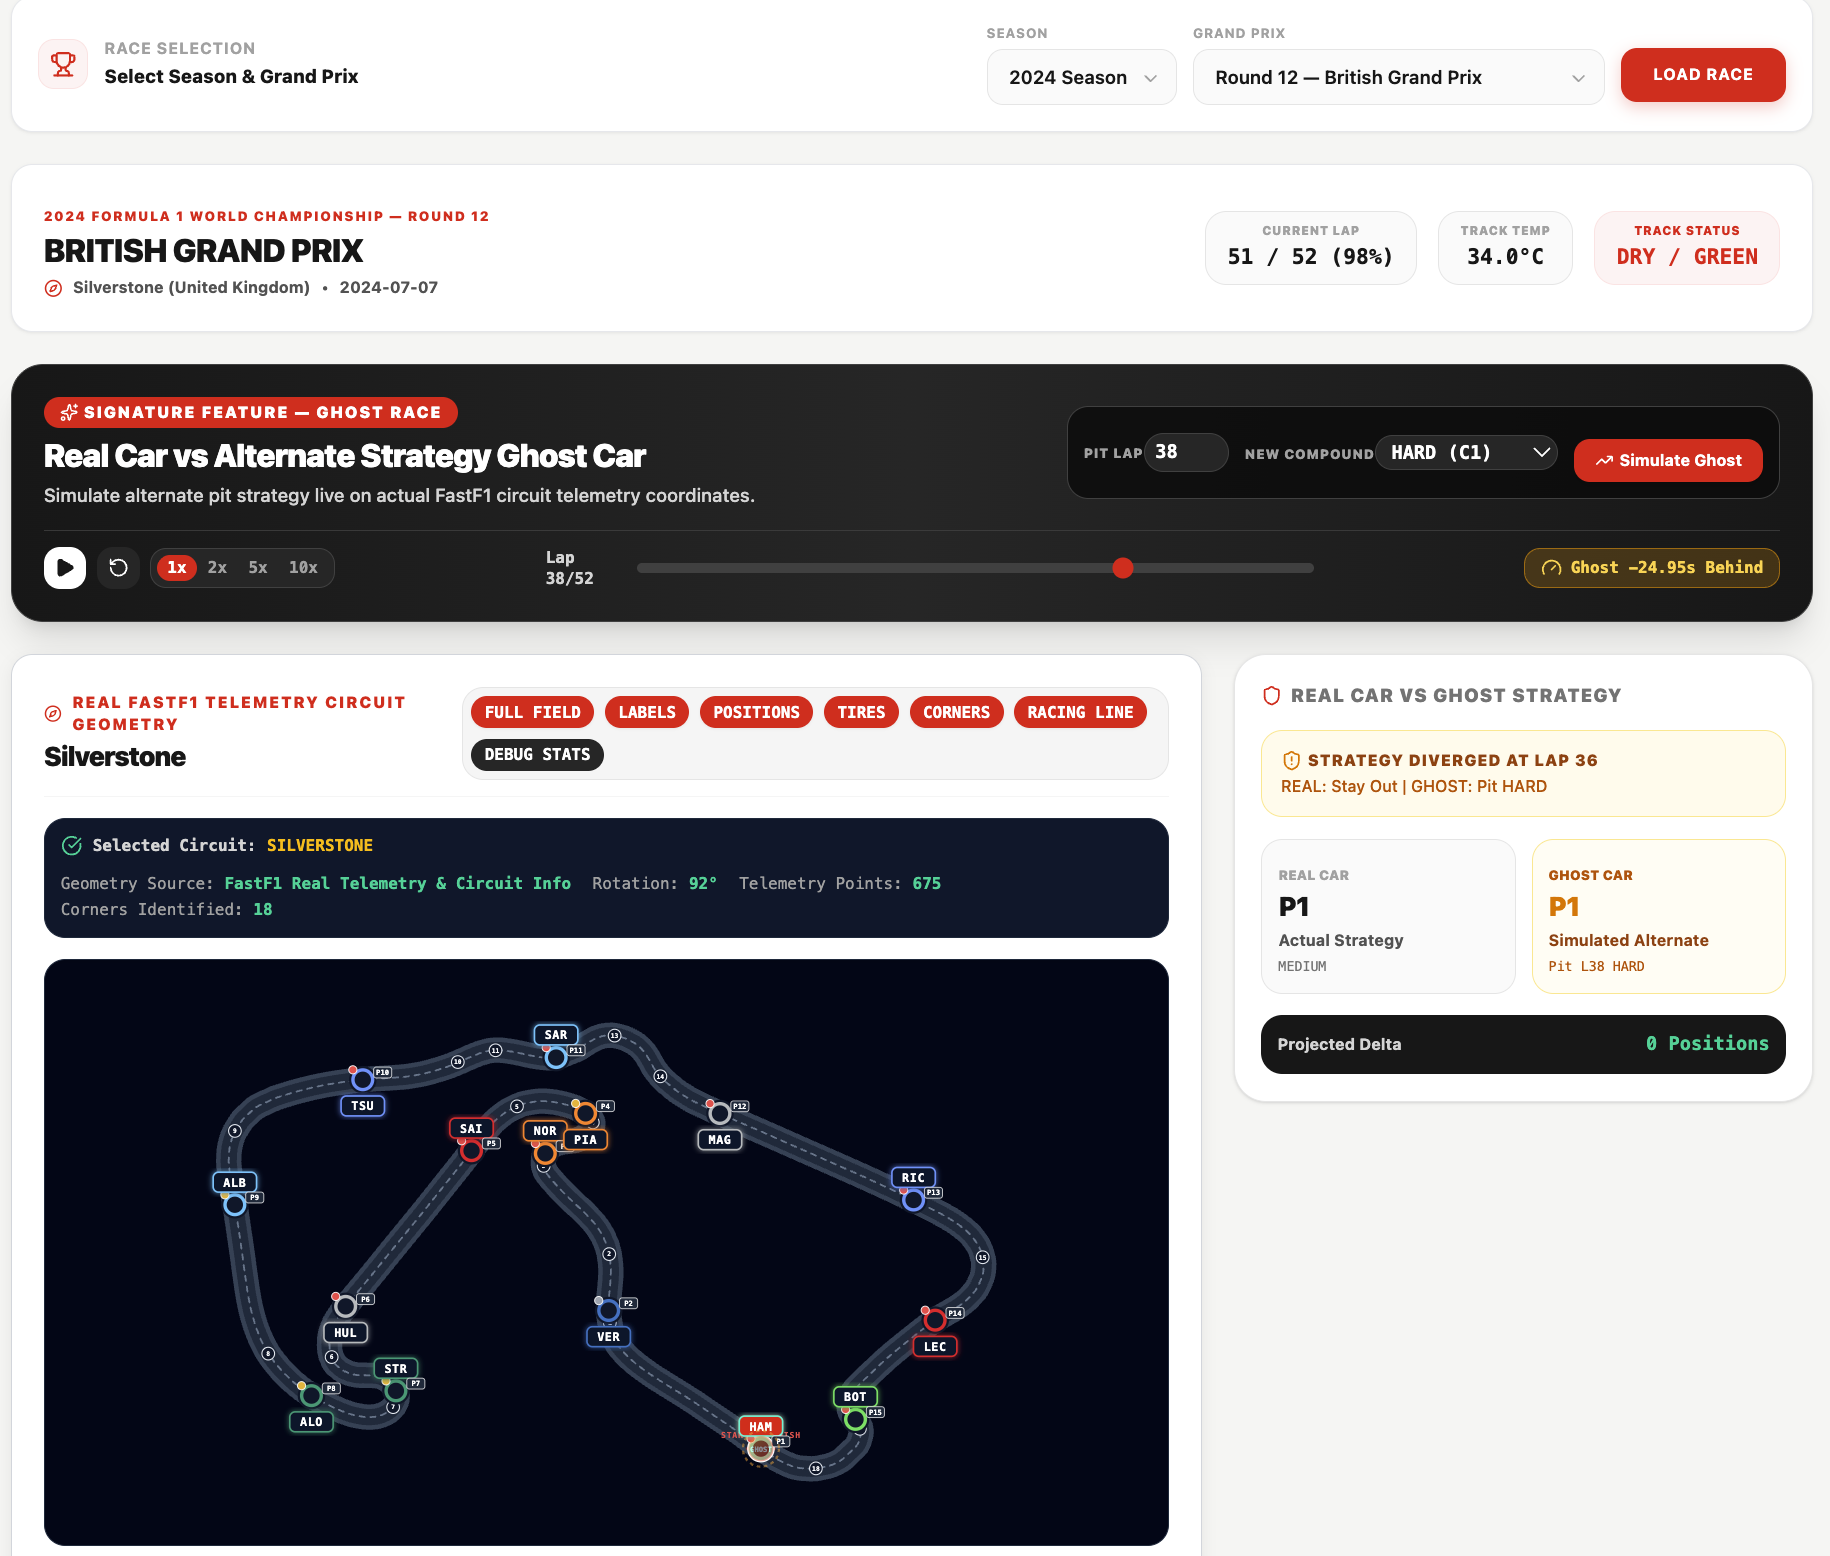
Ghost Car compares the real race with an alternative strategy, showing how pit decisions change pace, position, tires, and final results.
-
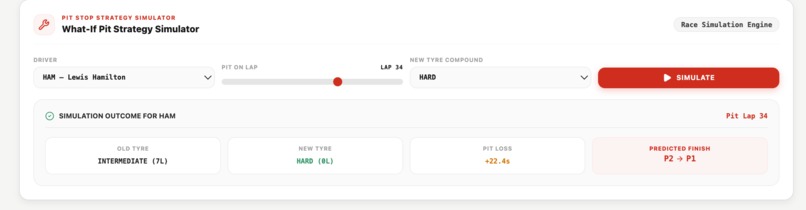
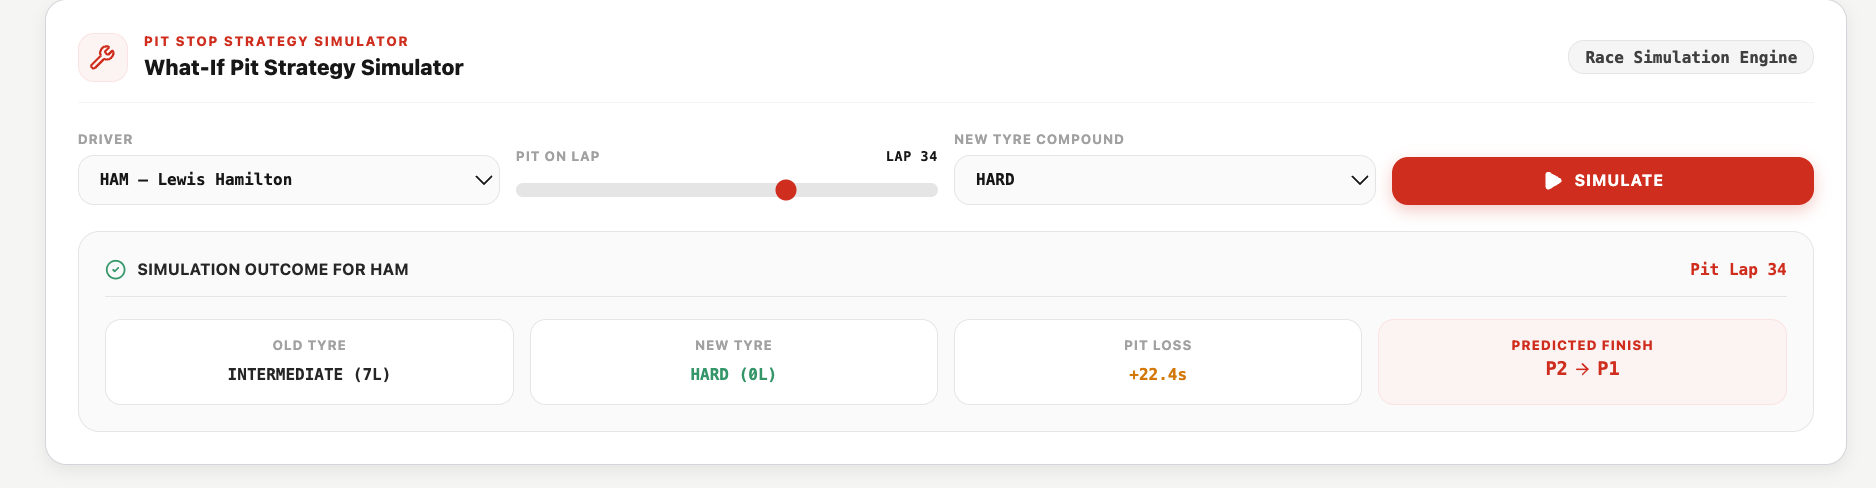
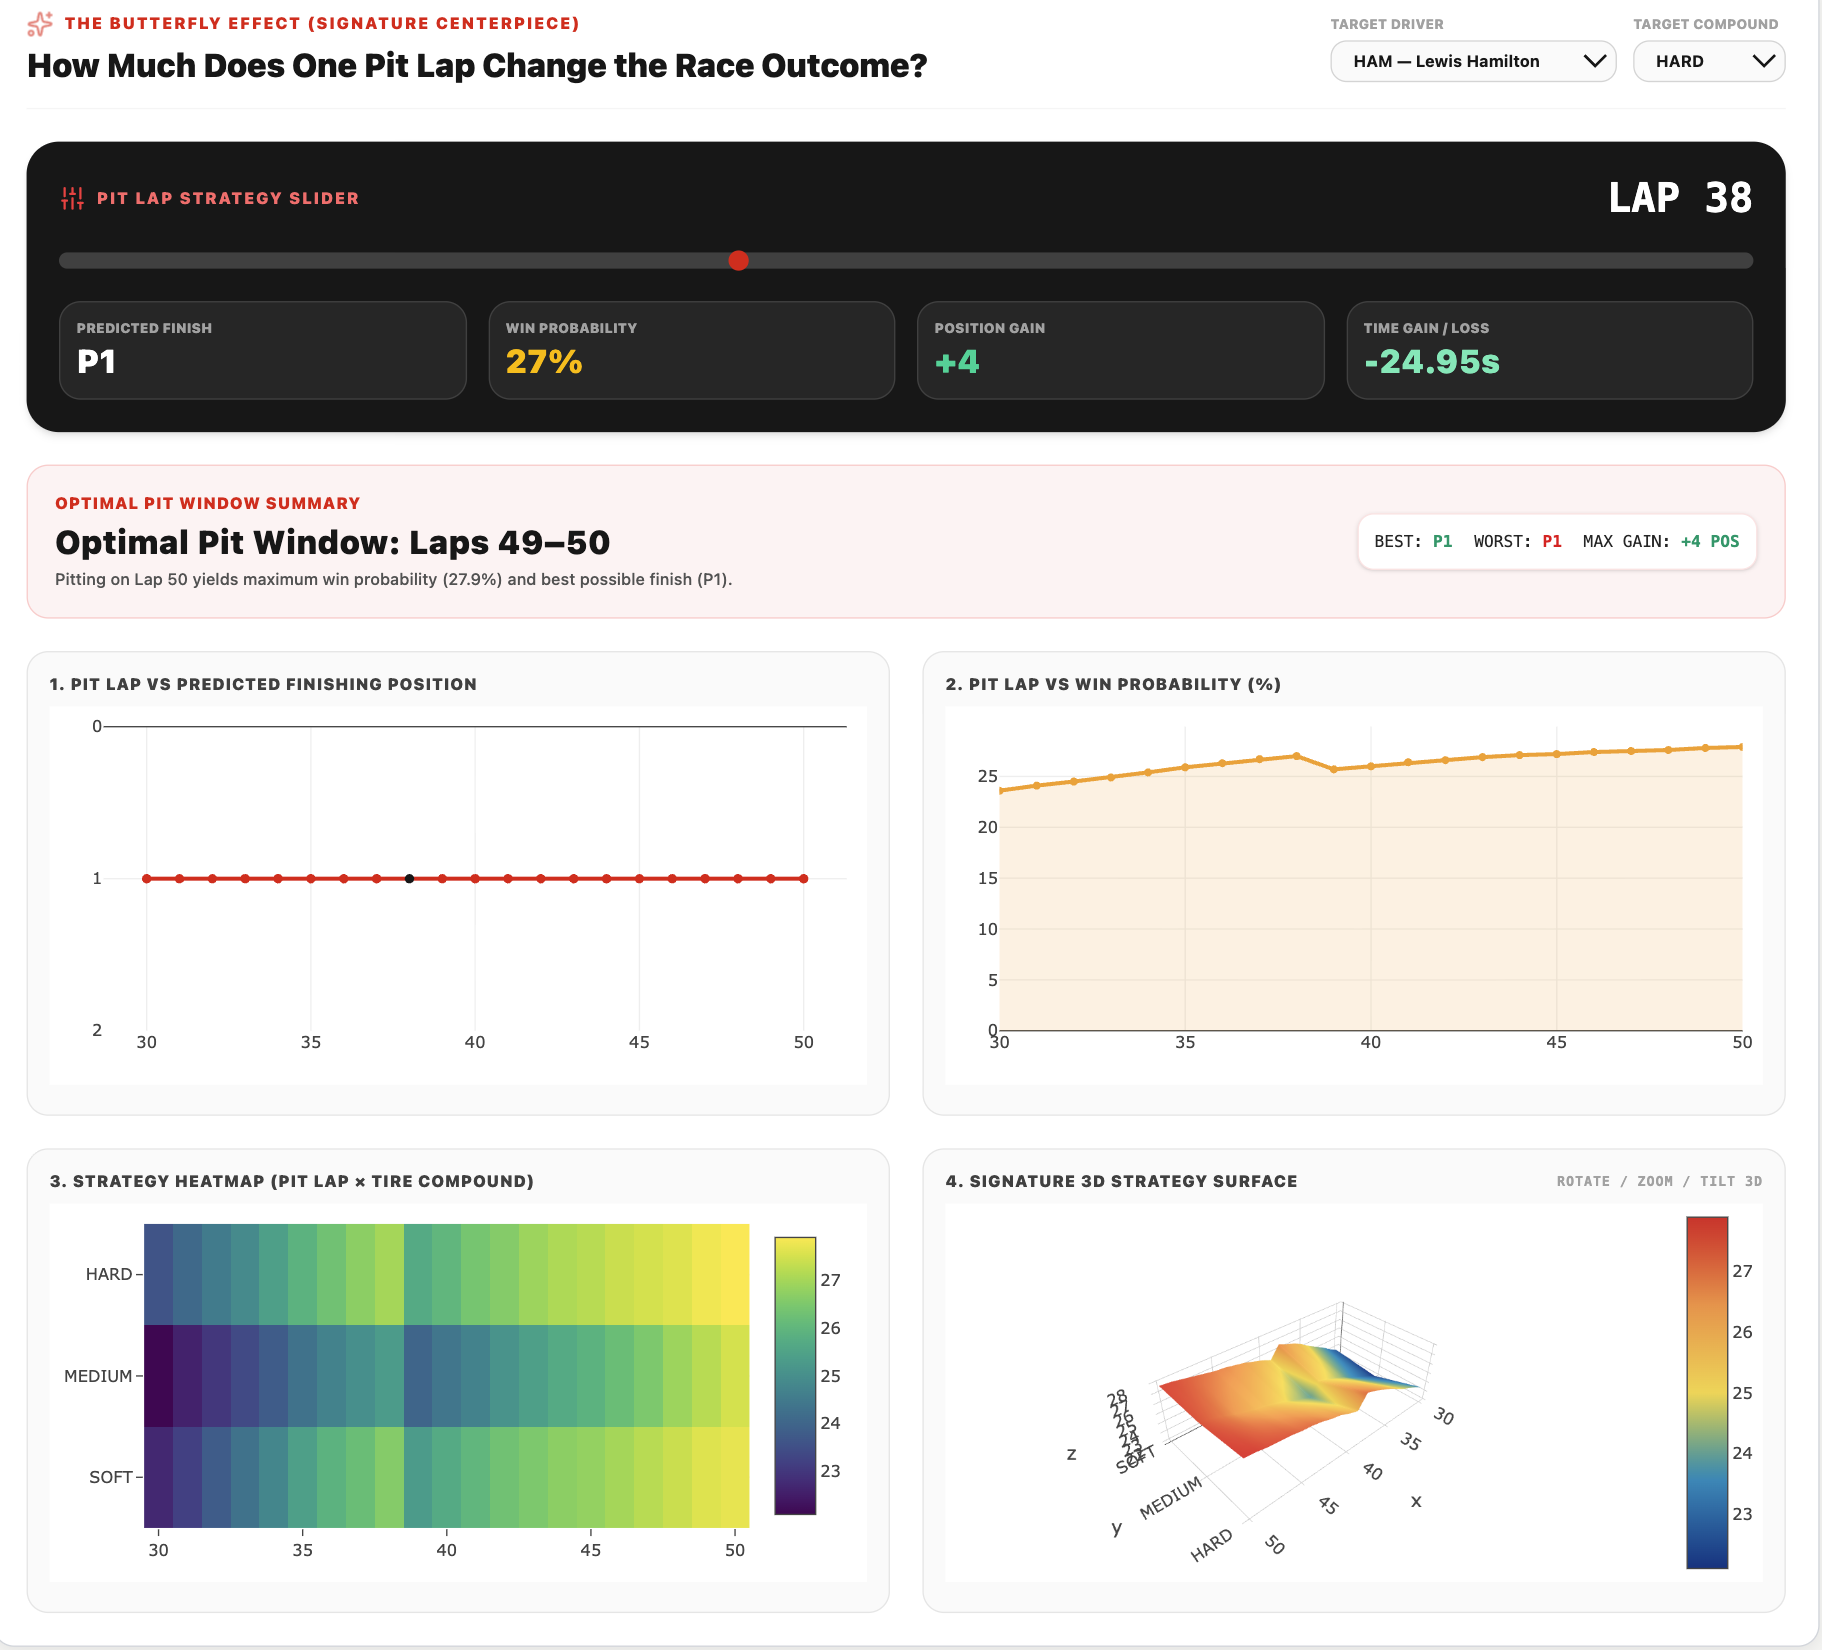
Change the pit lap and tire compound to simulate how different decisions affect lap times, position,tire performance,and final race outcome.
-
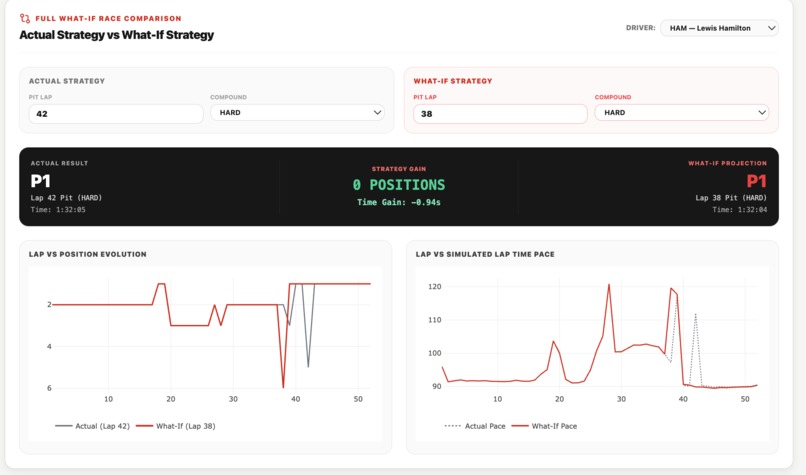
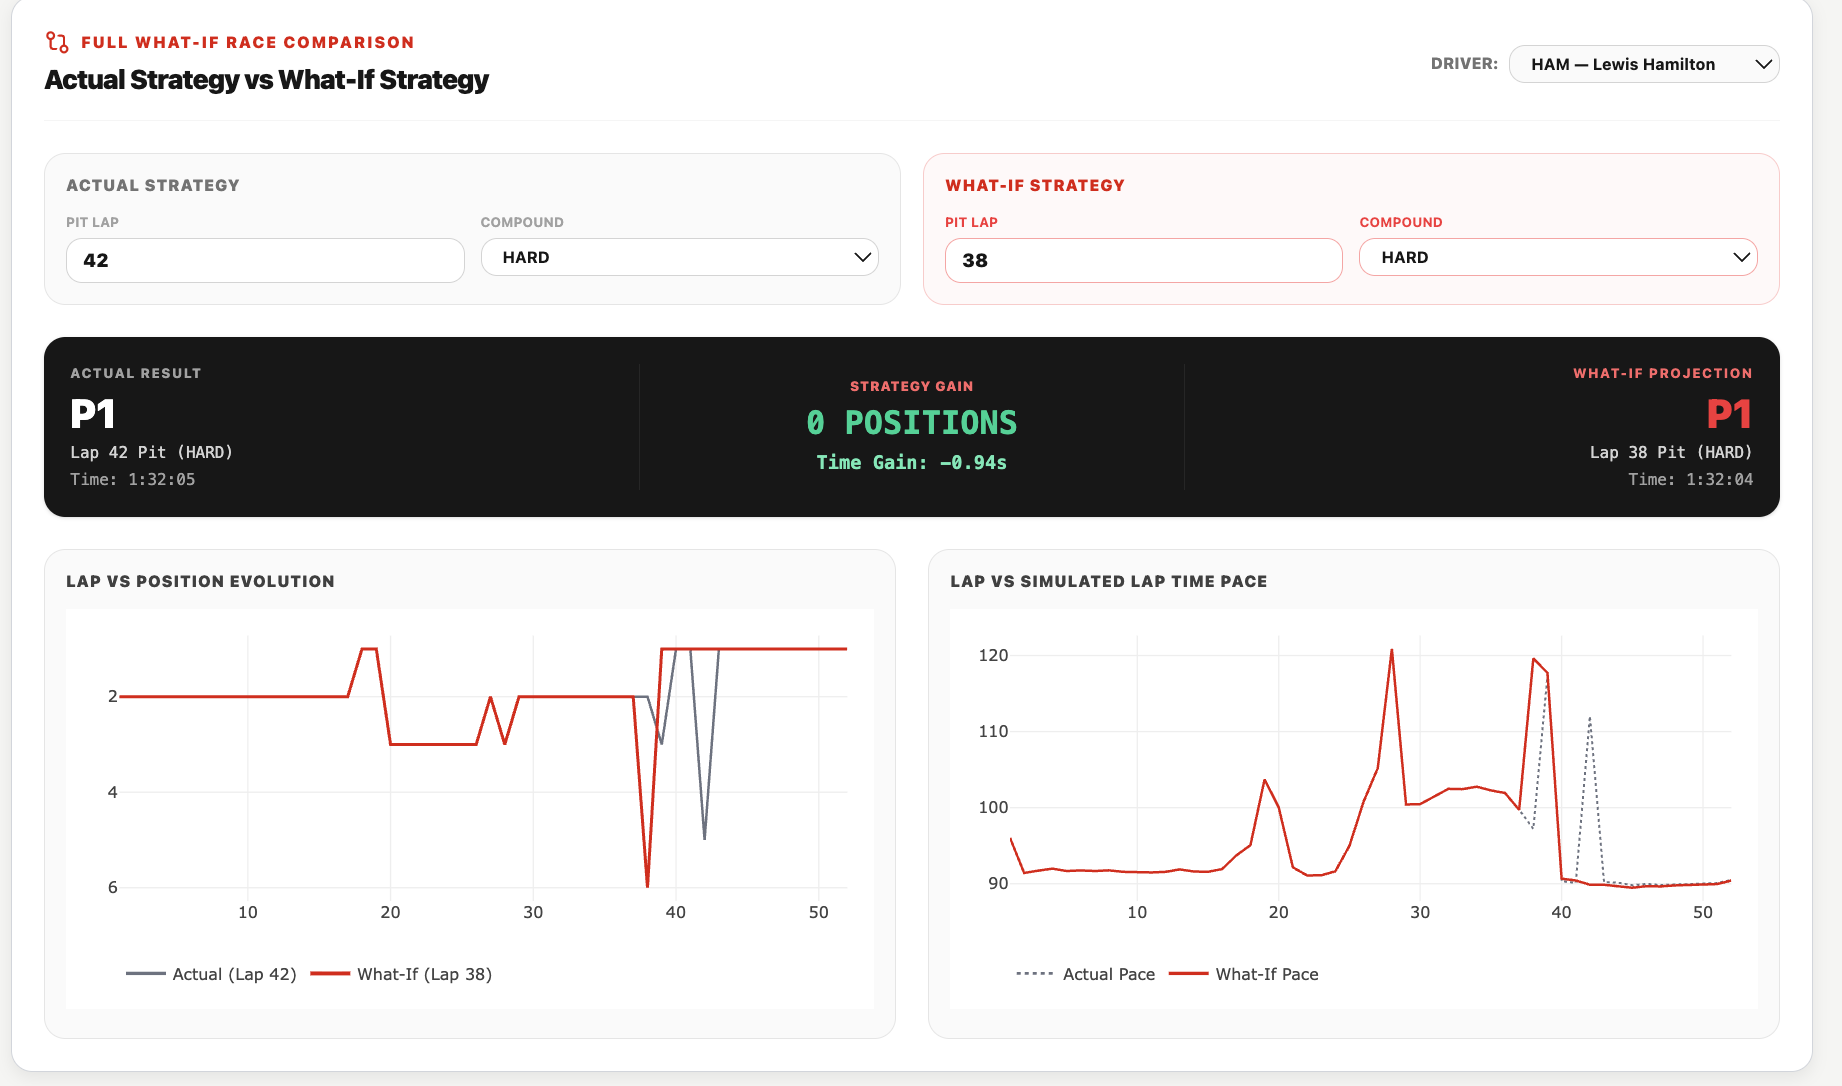
Compare the actual and what-if strategies,showing how different pit stops and tire choices affect lap time, position,and final race results.
-
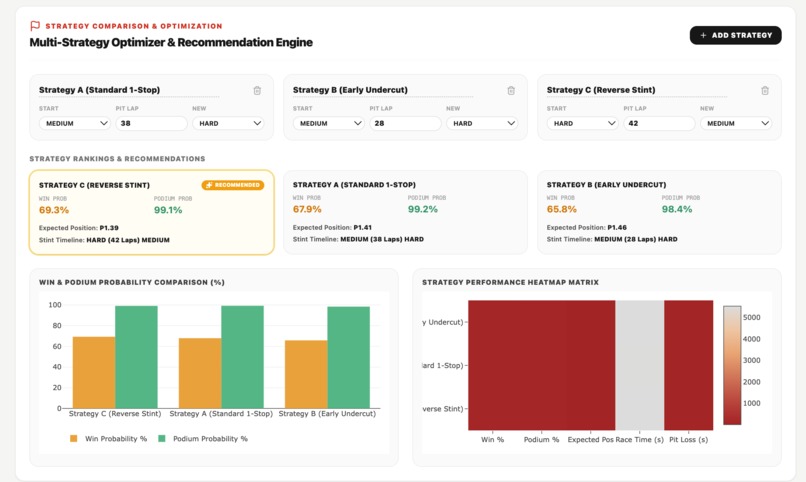
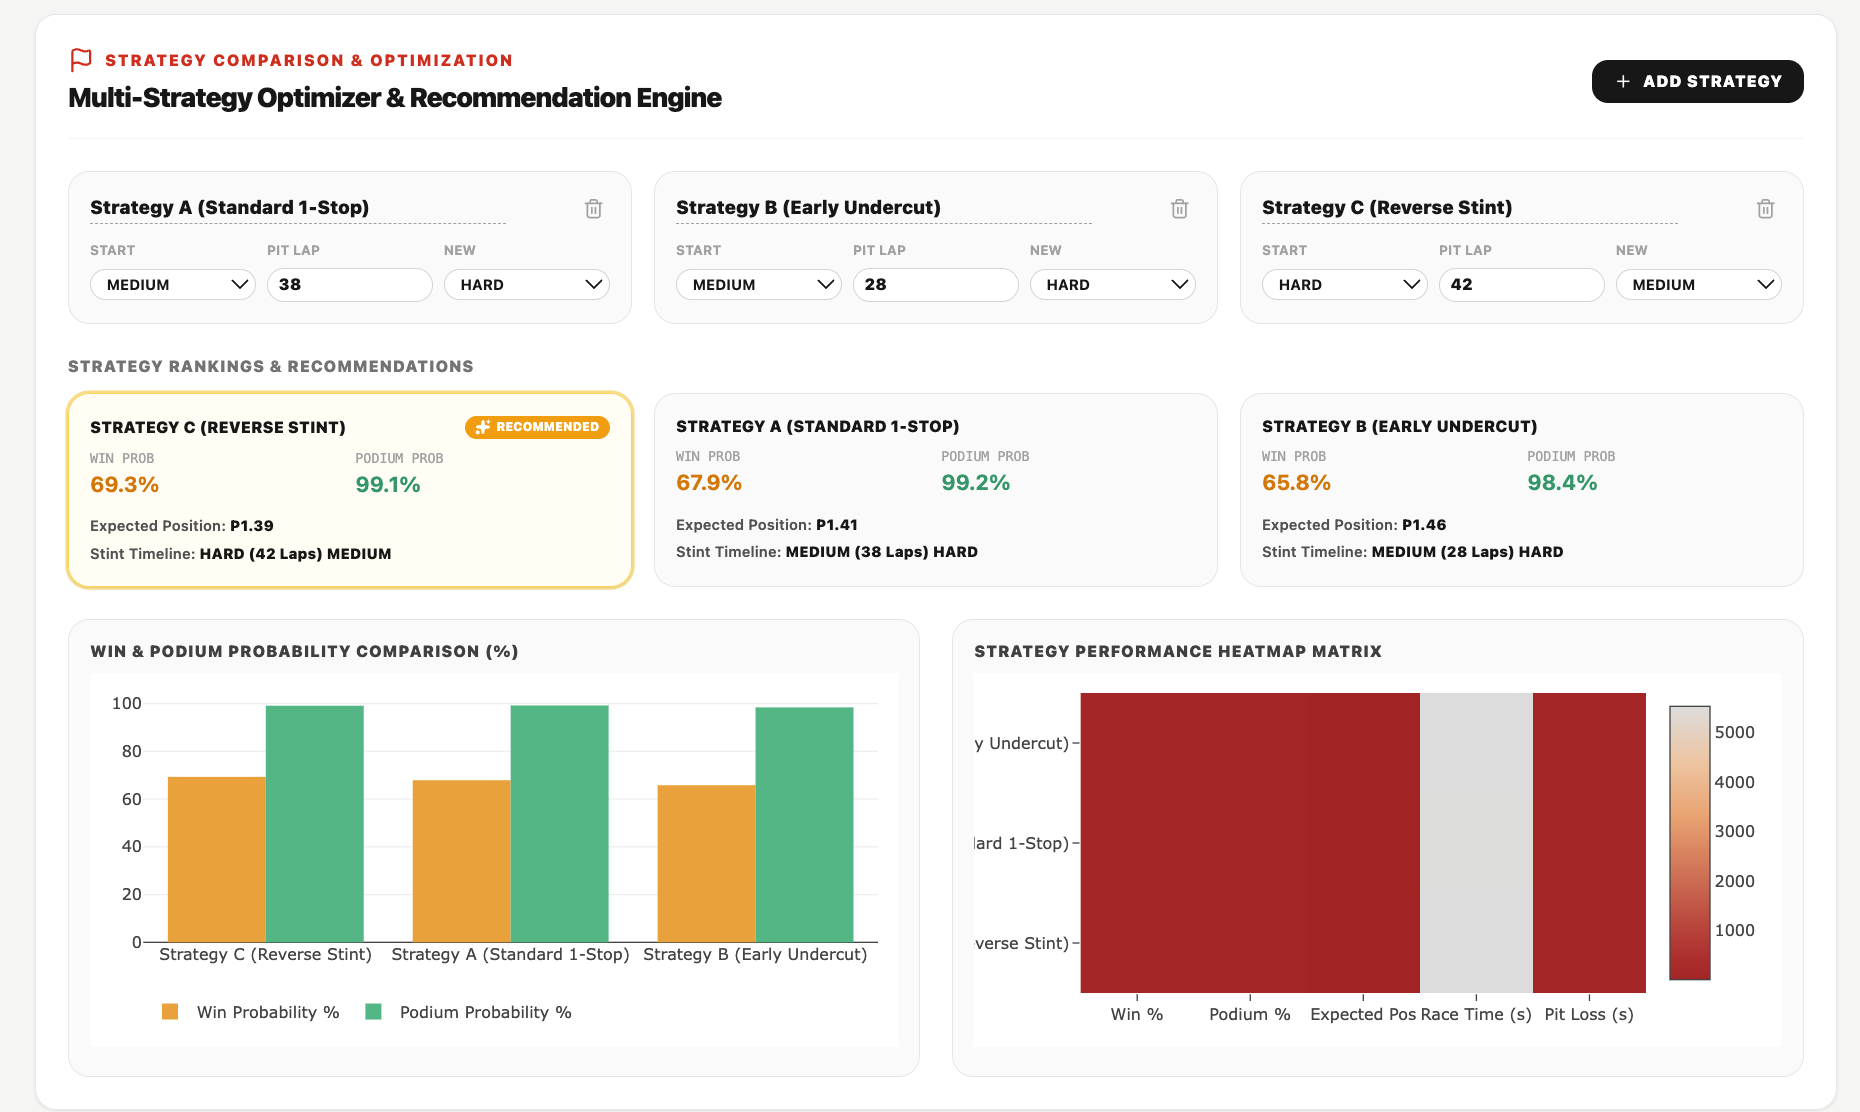
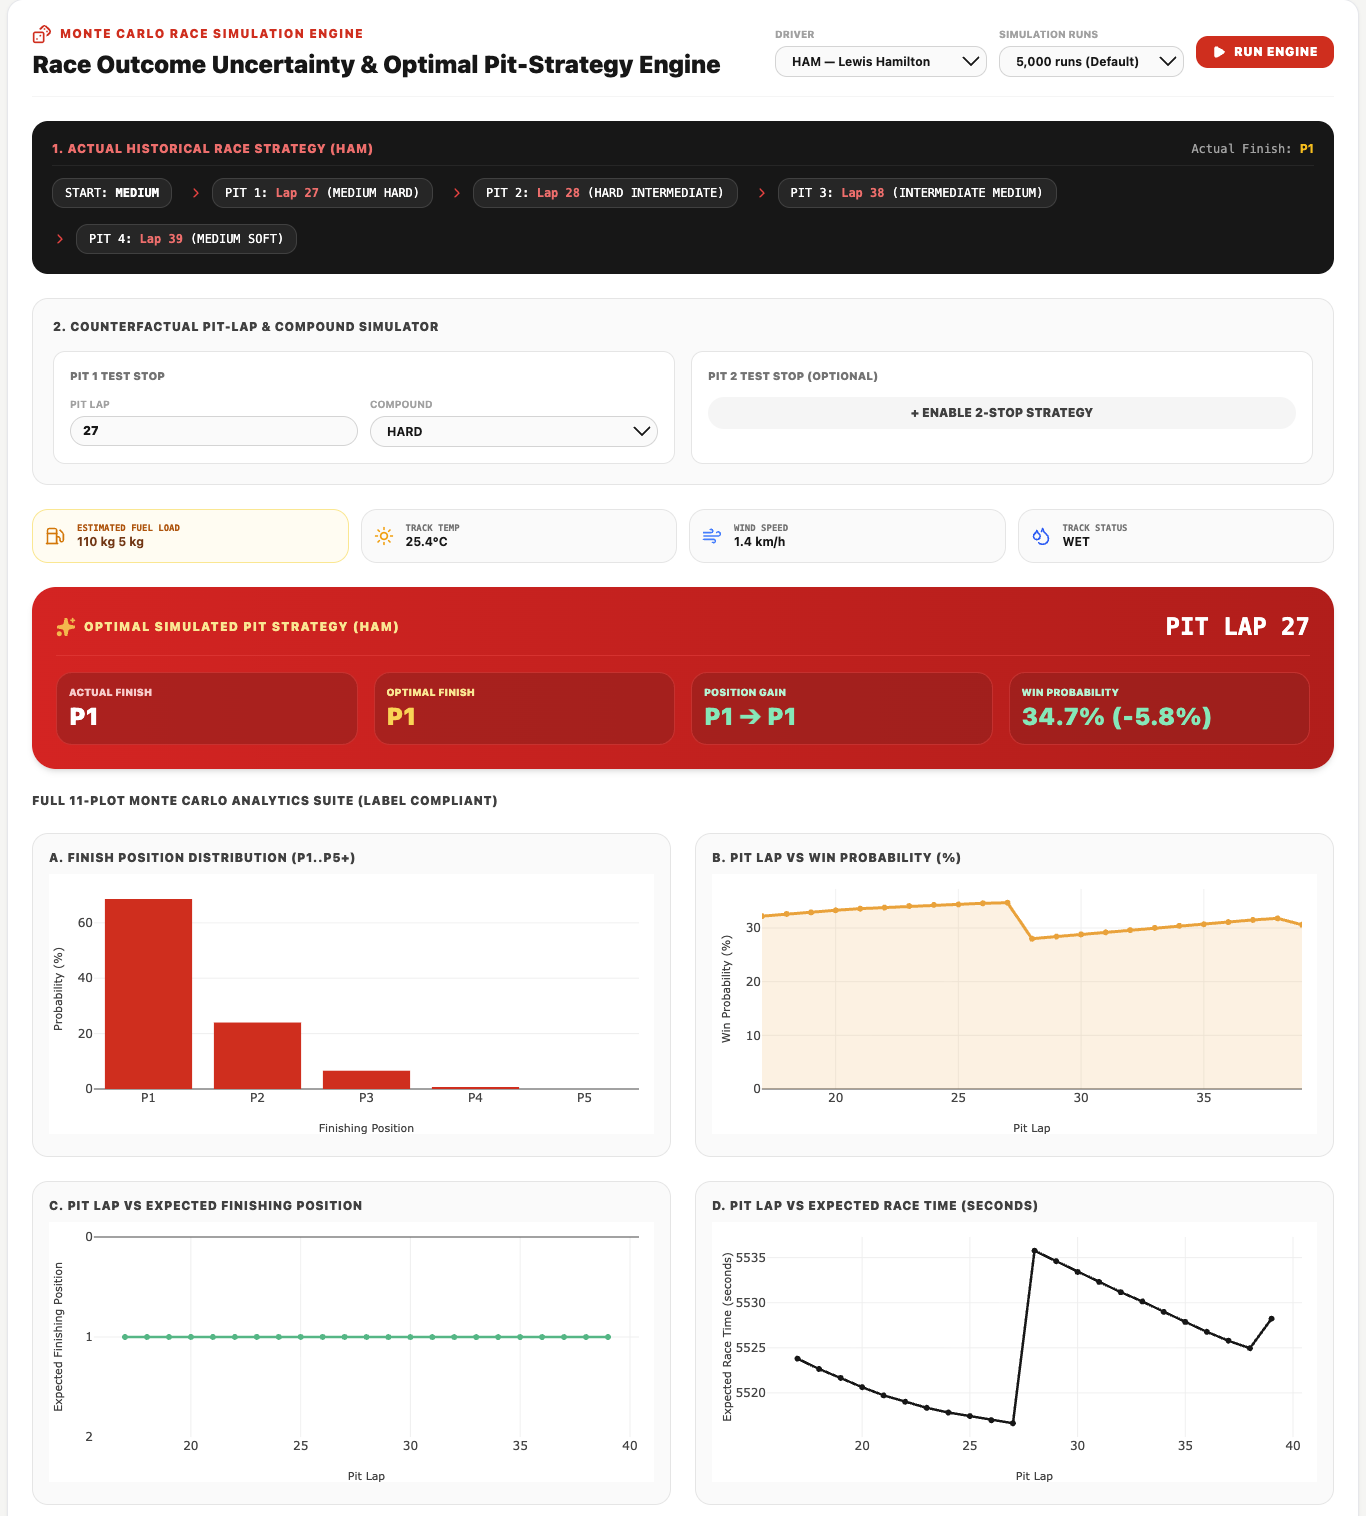
Compare multiple pit-stop and tire strategies, simulate outcomes, and recommend the strategy with the best predicted race result.
-
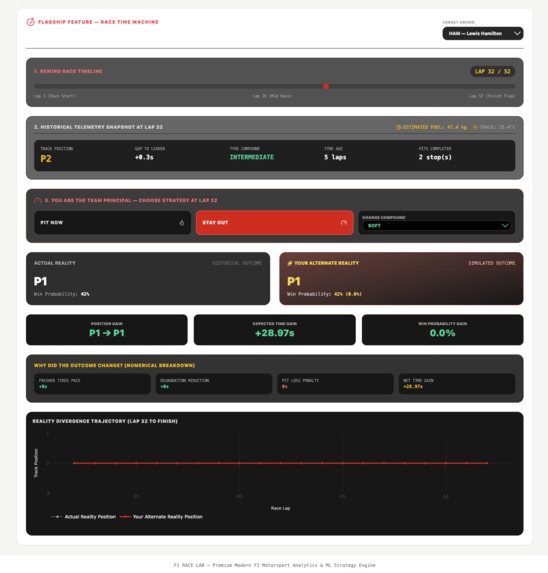
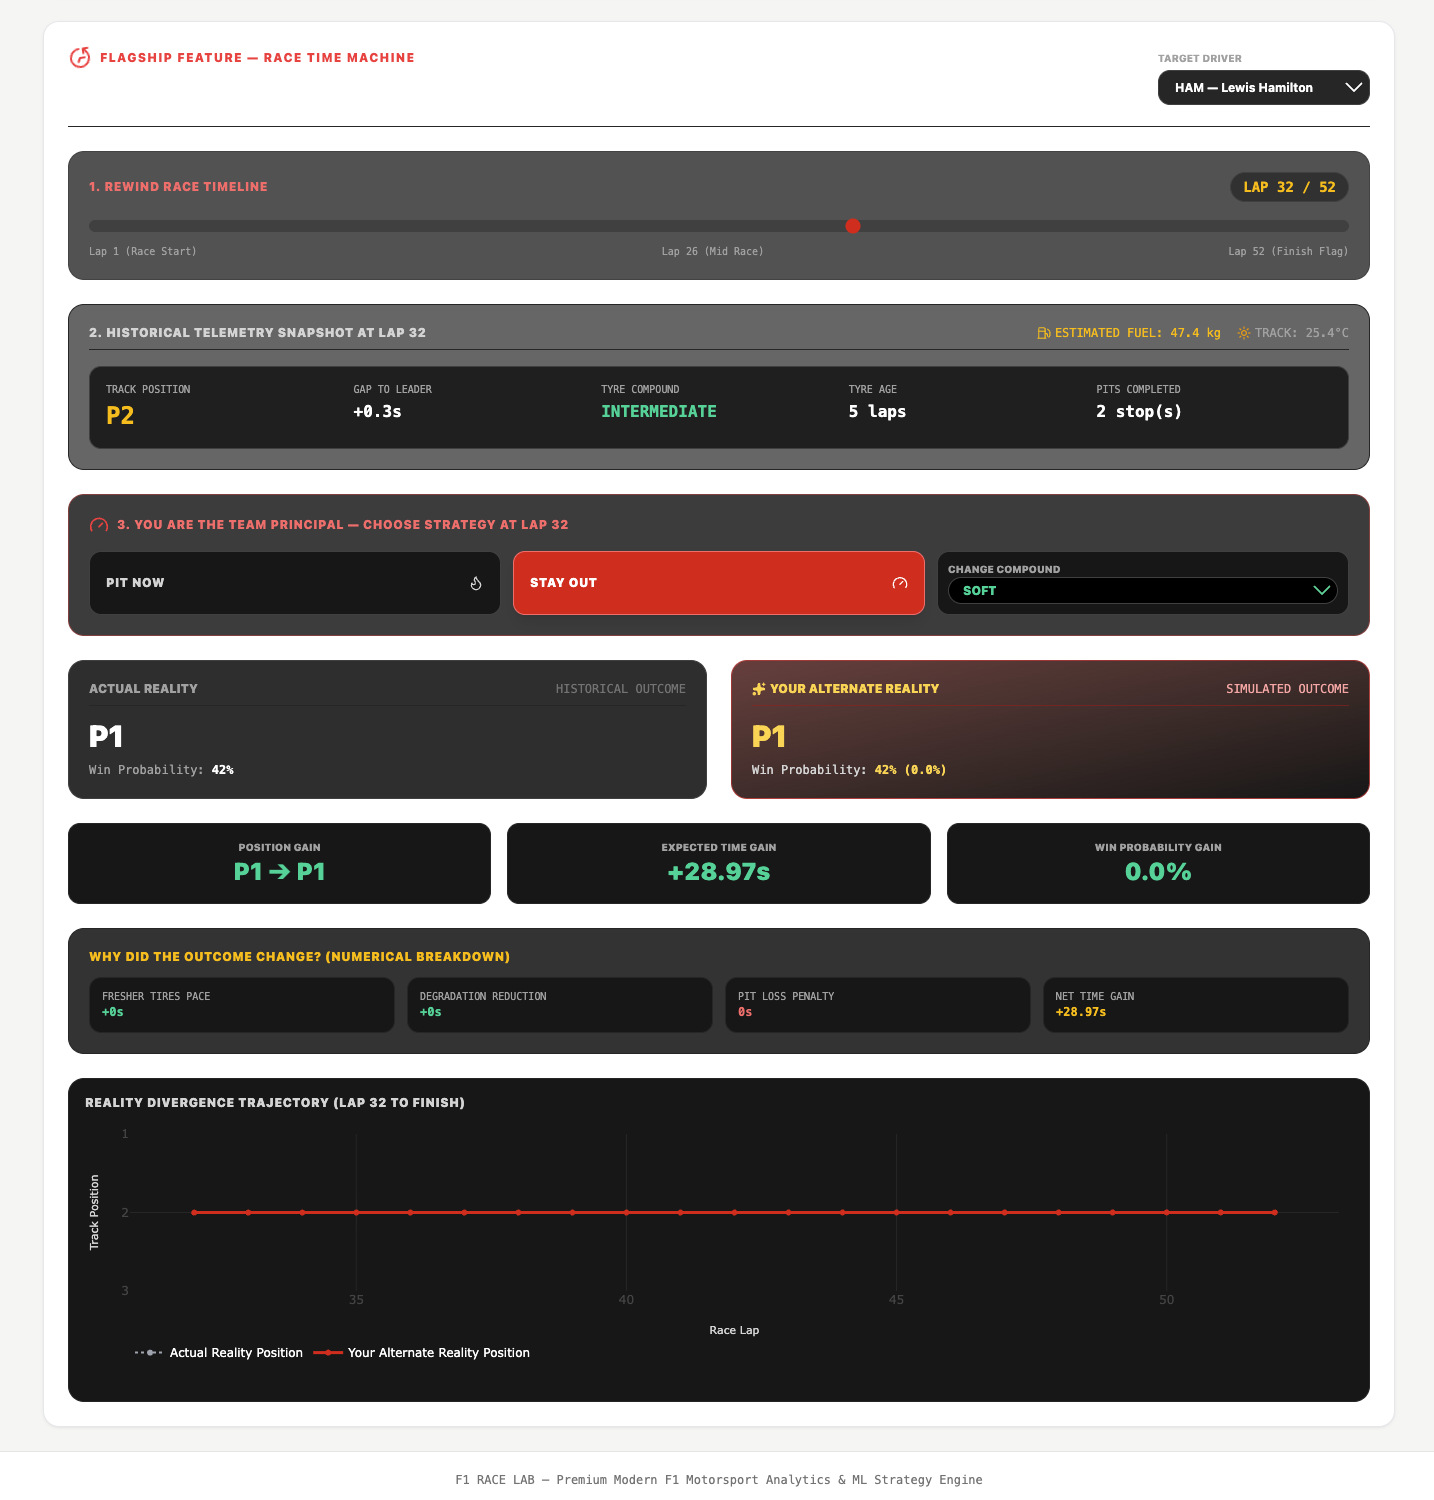
Rewind to any lap, choose Stay In or Pit Now, select tires, and simulate how the decision changes lap pace, position, and final result.
-
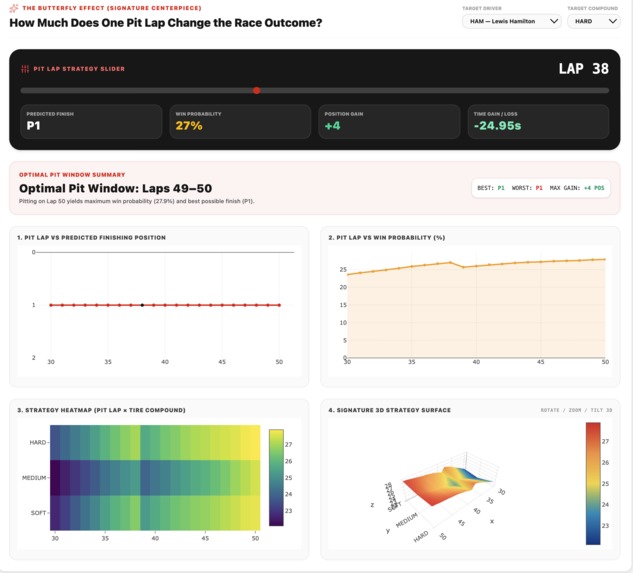
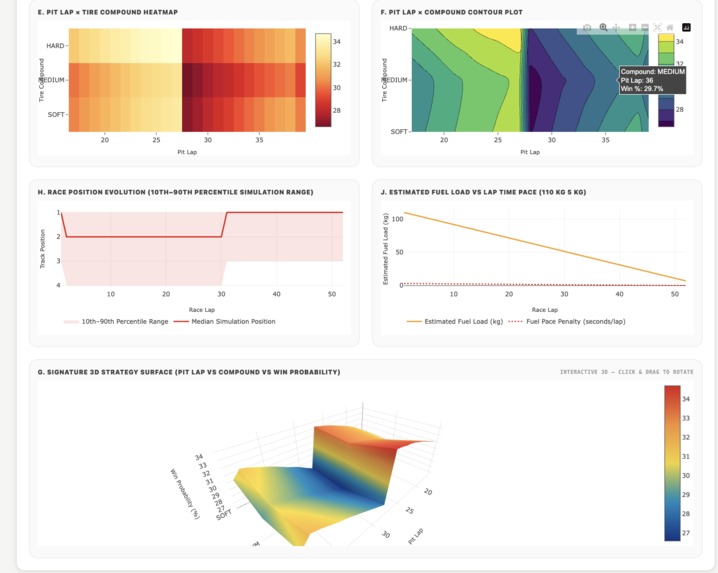
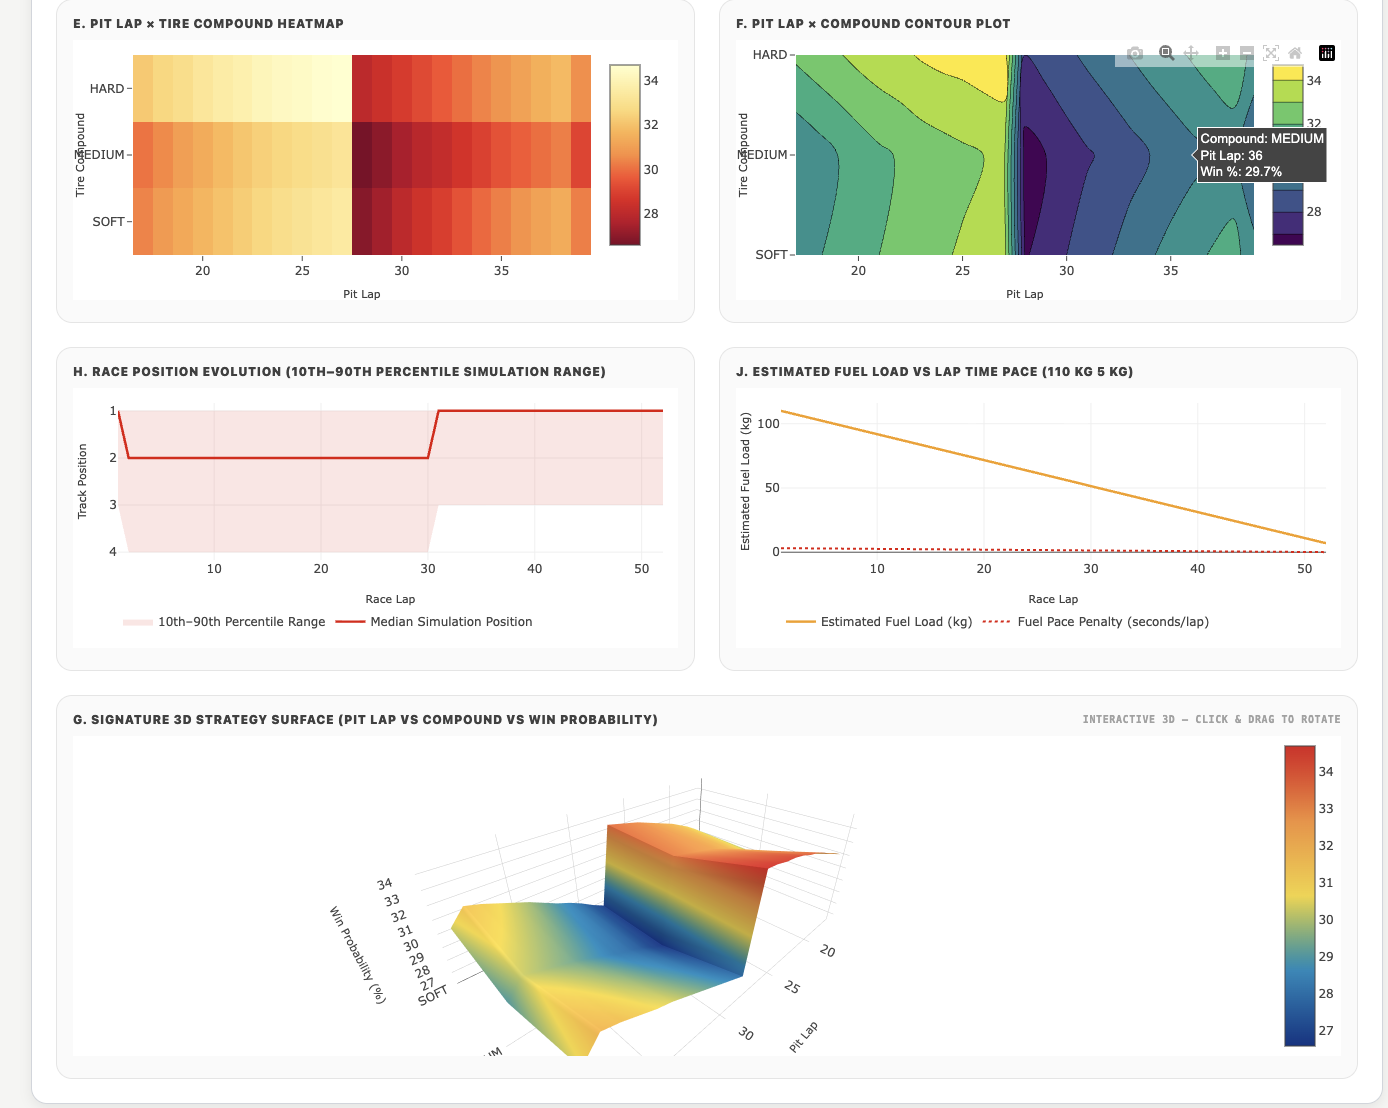
Analyze every pit lap using heatmaps, contour plots, and 3D surfaces to reveal its impact on finish position, race time and win probability.
-
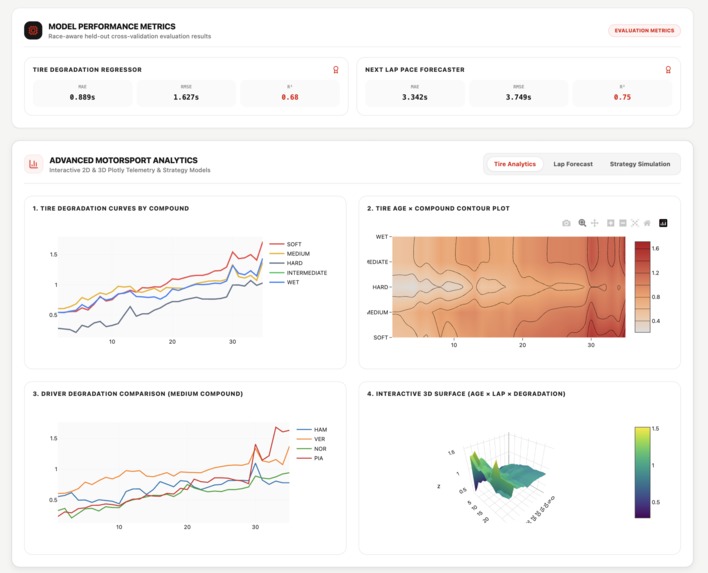
Interactive 2D & 3D Plotly visualizations for tire degradation, lap pace, tire age, compound performance, and race strategy analysis.
-
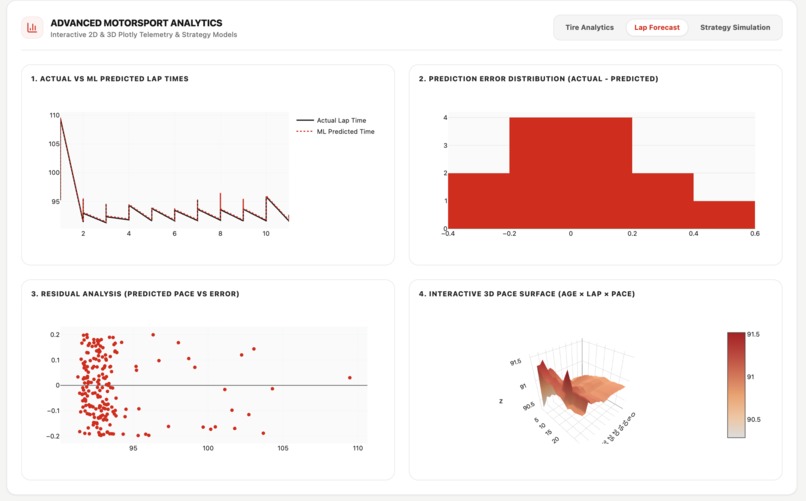
Interactive Plotly telemetry and strategy models for lap-time forecasting, tire degradation, driver performance, and race strategy analysis.
-
-
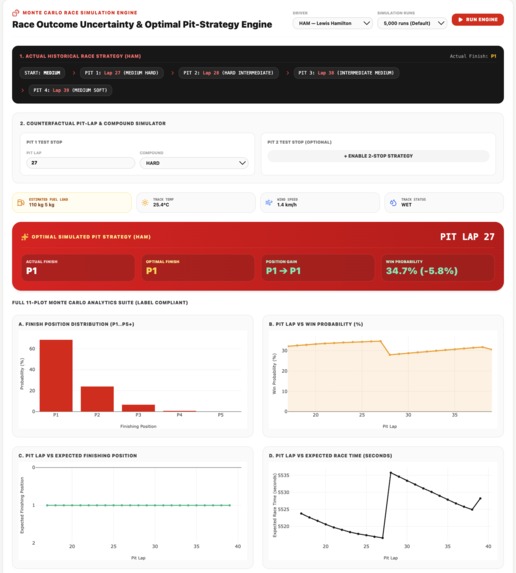
Simulate race scenarios with uncertain pace, tires, traffic, and pit losses to calculate win odds and identify the optimal pit strategy.
Inspiration
Formula 1 is not only about speed; it is a data-driven sport. Every lap generates information about pace, tires, fuel, driver performance, track conditions, and strategy. We wanted to understand how this data influences race outcomes and build a platform that turns complex telemetry into meaningful insights.
What it does
F1 Race-Lab focuses on race data analysis to understand:
- Why a driver gains or loses pace
- How tire age affects lap performance
- Which drivers are more consistent
- How pit stops influence race position
- How different strategies perform
- How race conditions affect performance
- How small decisions can change the final result
The platform combines historical analysis, machine learning, visualization, and simulation to move from simply observing race results to understanding the reasons behind them.
Why Data Analysis is Important
In F1, a difference of a few tenths of a second per lap can determine the outcome of an entire race. Looking only at the final standings does not explain where that advantage came from.
Data analysis helps identify patterns that are difficult to see during a live race:
Lap Data → Pattern → Insight → Prediction → Decision
For example, analyzing tire performance can reveal when a driver begins losing pace, while analyzing pit-stop data can show whether an earlier stop could have created an advantage.
This makes analysis important because it transforms thousands of telemetry points into evidence-based race decisions.
How we built it
We use FastF1 to collect real historical telemetry and Pandas, NumPy, and Python for data processing and analysis.
Machine learning models analyze tire degradation and predict lap performance.
FastAPI connects the data, models, and simulation engine, while React, Plotly, and Recharts provide interactive analytical visualizations.
Challenges we ran into
Real F1 telemetry is complex and contains missing data, abnormal laps, pit stops, safety-car periods, traffic effects, and changing track conditions.
A major analytical challenge was determining whether a change in lap time was actually caused by tire degradation or by another factor.
We also had to ensure that our predictions and simulations were based on real data rather than artificially improved results.
Accomplishments that we're proud of
We created a complete data analytics pipeline from:
Real Telemetry → Data Cleaning → Analysis → ML → Visualization → Simulation
We are especially proud of being able to analyze multiple dimensions of a race simultaneously, including pace, tires, drivers, stints, pit stops, and strategy.
The platform does not just display statistics; it allows users to explore relationships within the data and understand how those relationships influence race outcomes.
What we learned
We learned that good analysis starts with good data.
Feature selection, data cleaning, handling outliers, understanding domain-specific factors, and validating models are just as important as the machine-learning algorithm itself.
We also learned how powerful visualization can be for analytical decision-making. A complex relationship that is difficult to understand from raw numbers can become obvious through a well-designed graph, heatmap, or interactive visualization.
What's next for F1 Race-Lab Intelligent Race Analytics & Strategy Simulator
We want to make the analysis more comprehensive by incorporating:
- Detailed fuel-load analysis
- Weather and track-temperature analysis
- Safety-car impact analysis
- Traffic and overtaking analysis
- Driver consistency metrics
- Team performance comparison
- Automated strategy discovery
- Real-time race analytics
- More advanced statistical and predictive models
The ultimate goal is to make F1 Race-Lab a platform where every major race decision can be supported by data.
Instead of just asking who won the race, we ask what the data tells us about why they won.

Log in or sign up for Devpost to join the conversation.