Inspiration
The Eye of Horus is the all-seeing eye from Egyptian myth, a symbol of watching over and protecting the world. News about disasters and world events is spread across dozens of feeds and sites. We wanted one view where you can see what is happening on Earth, where it is happening, and who it affects. Free satellite archives that almost nobody uses made the disaster side possible.
What it does
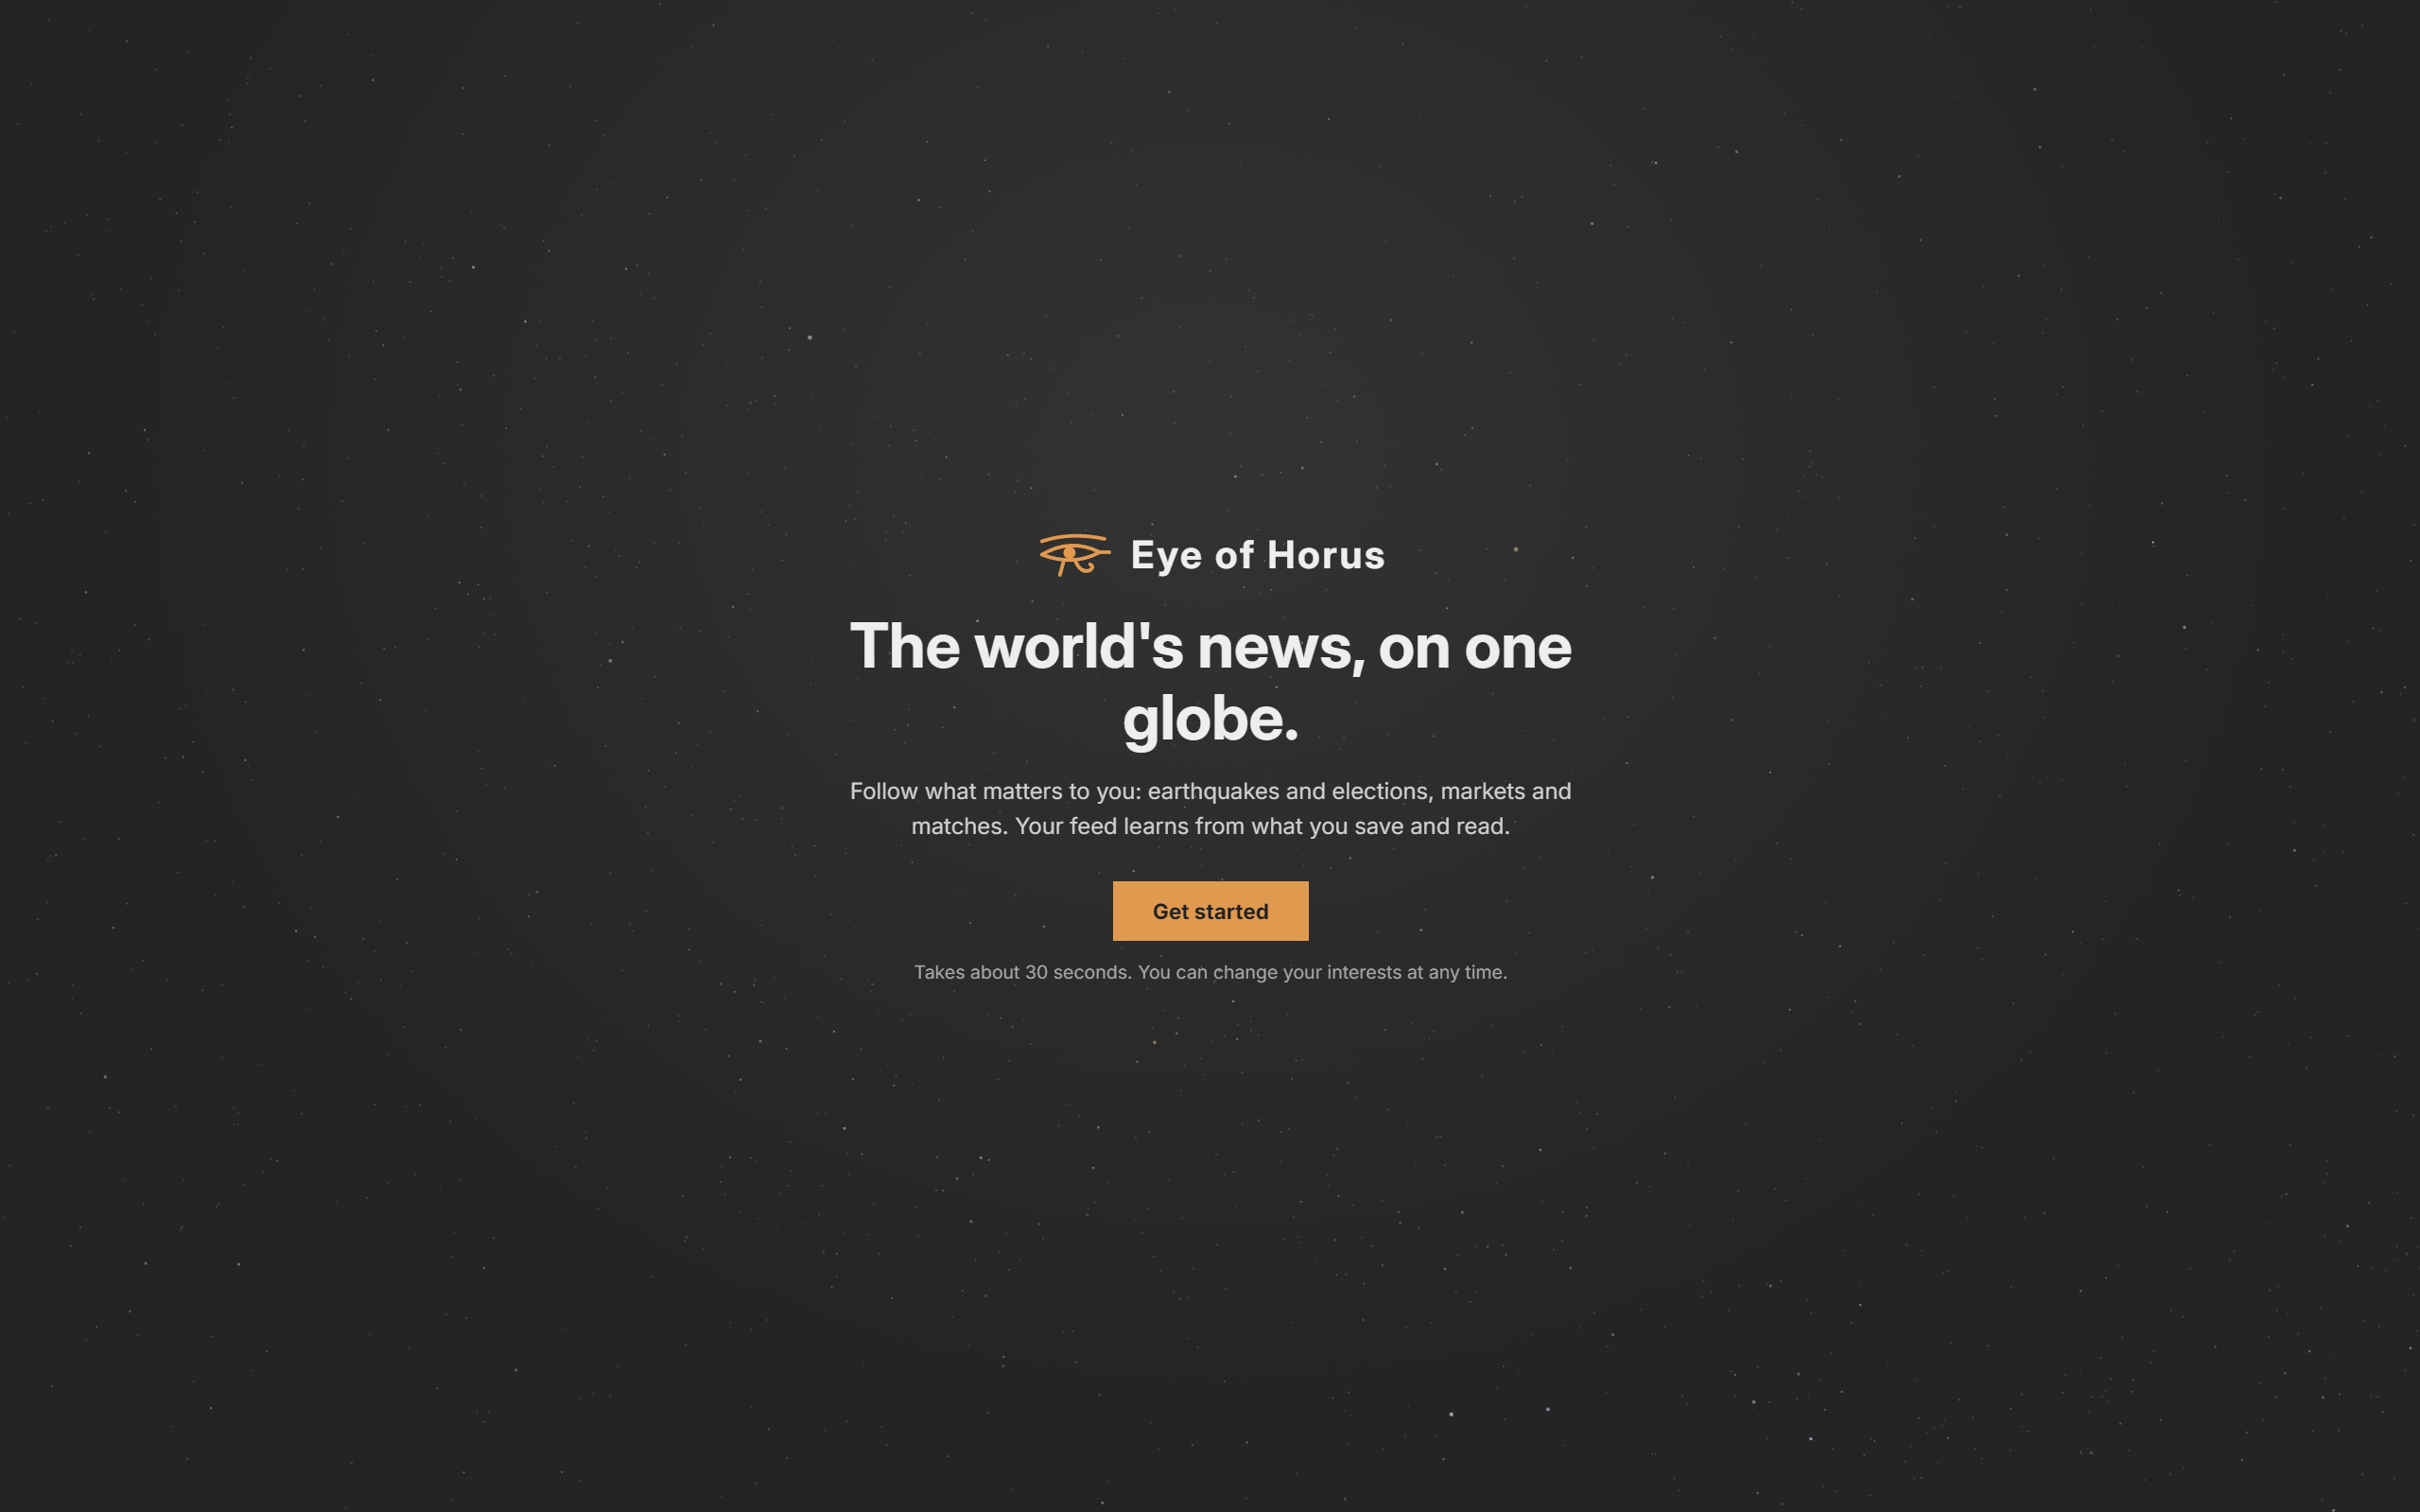
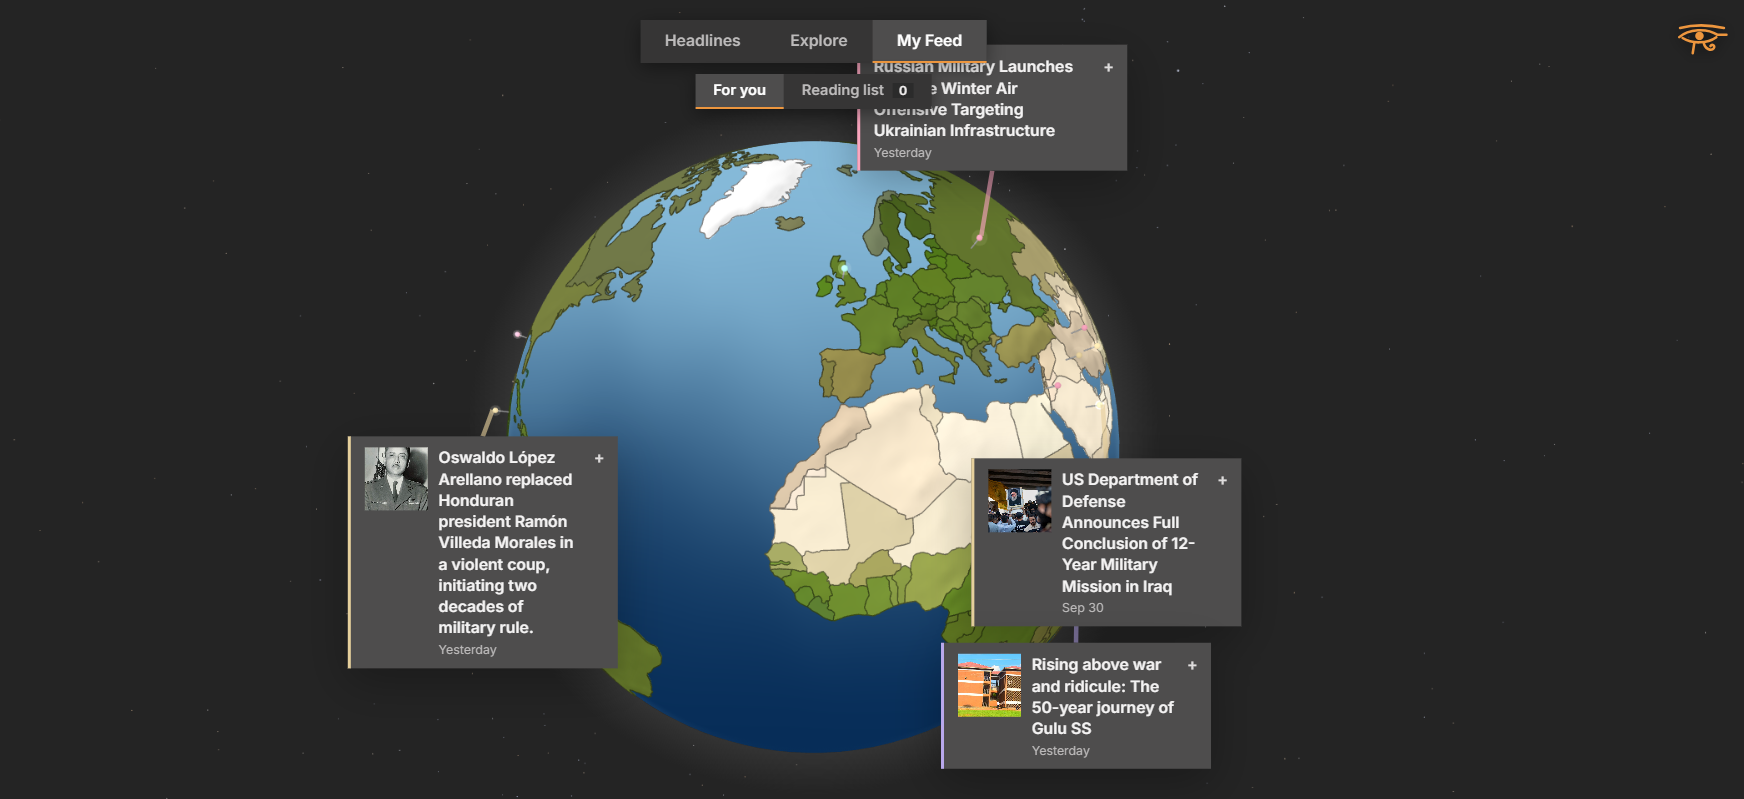
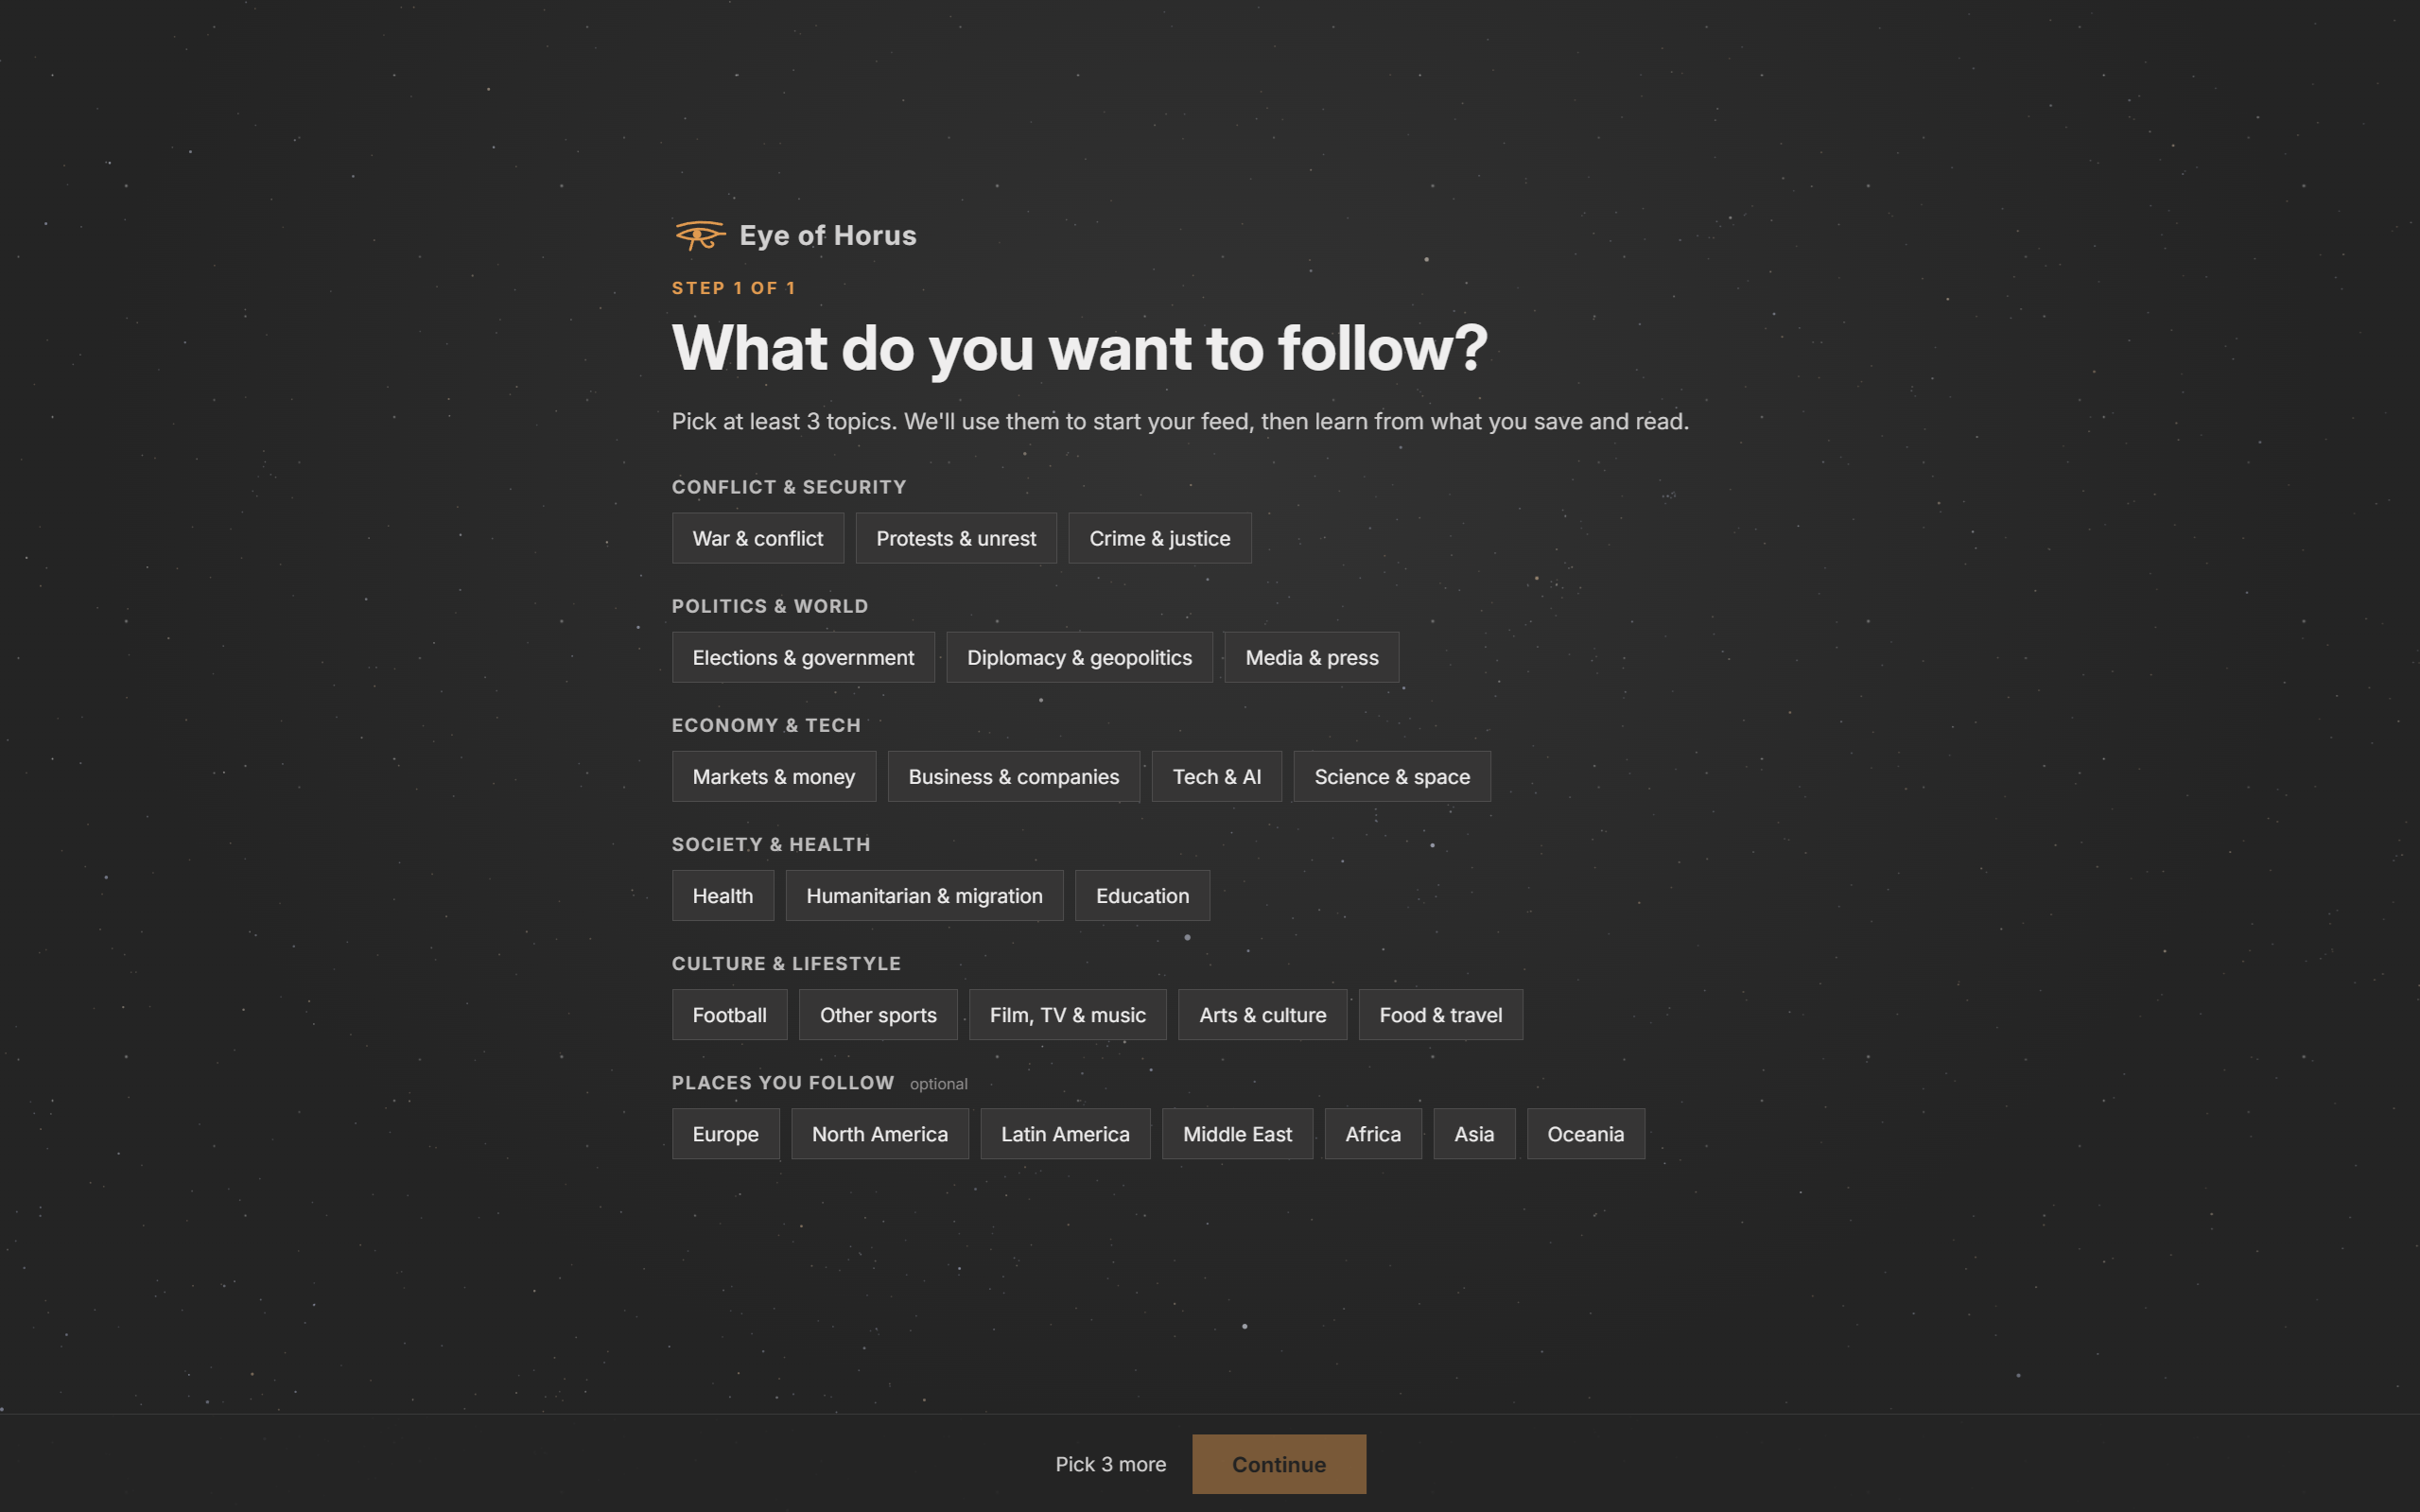
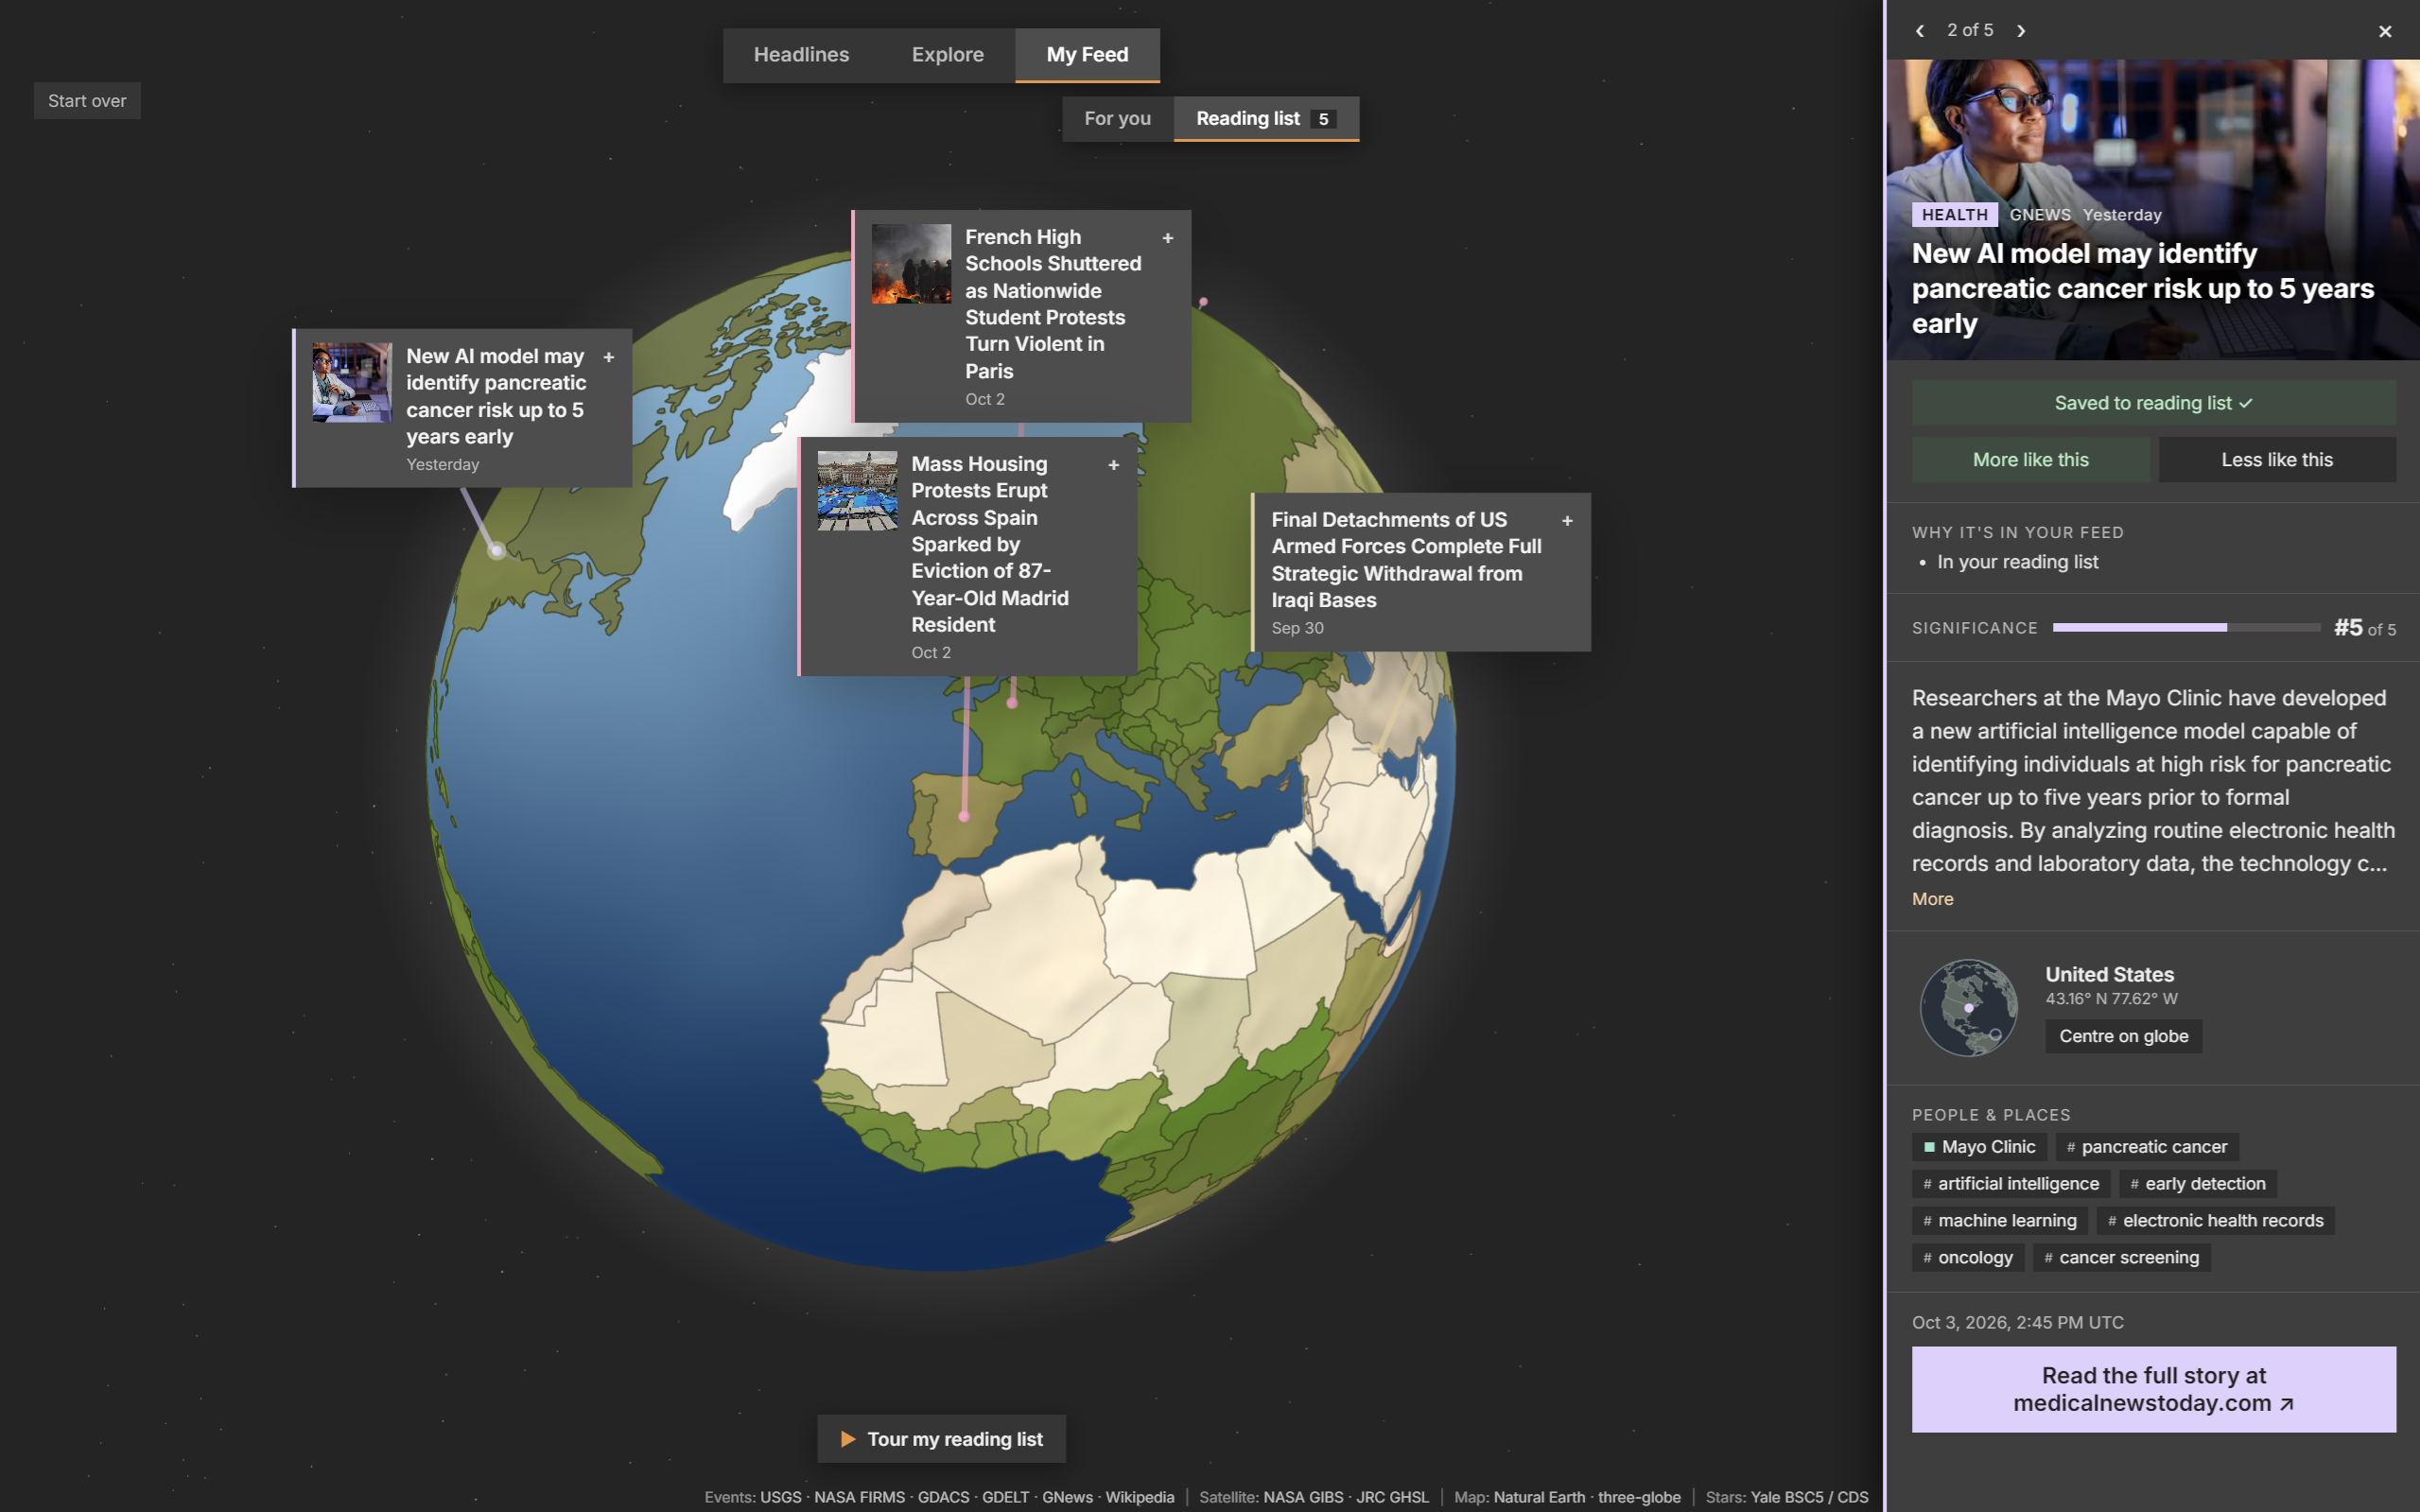
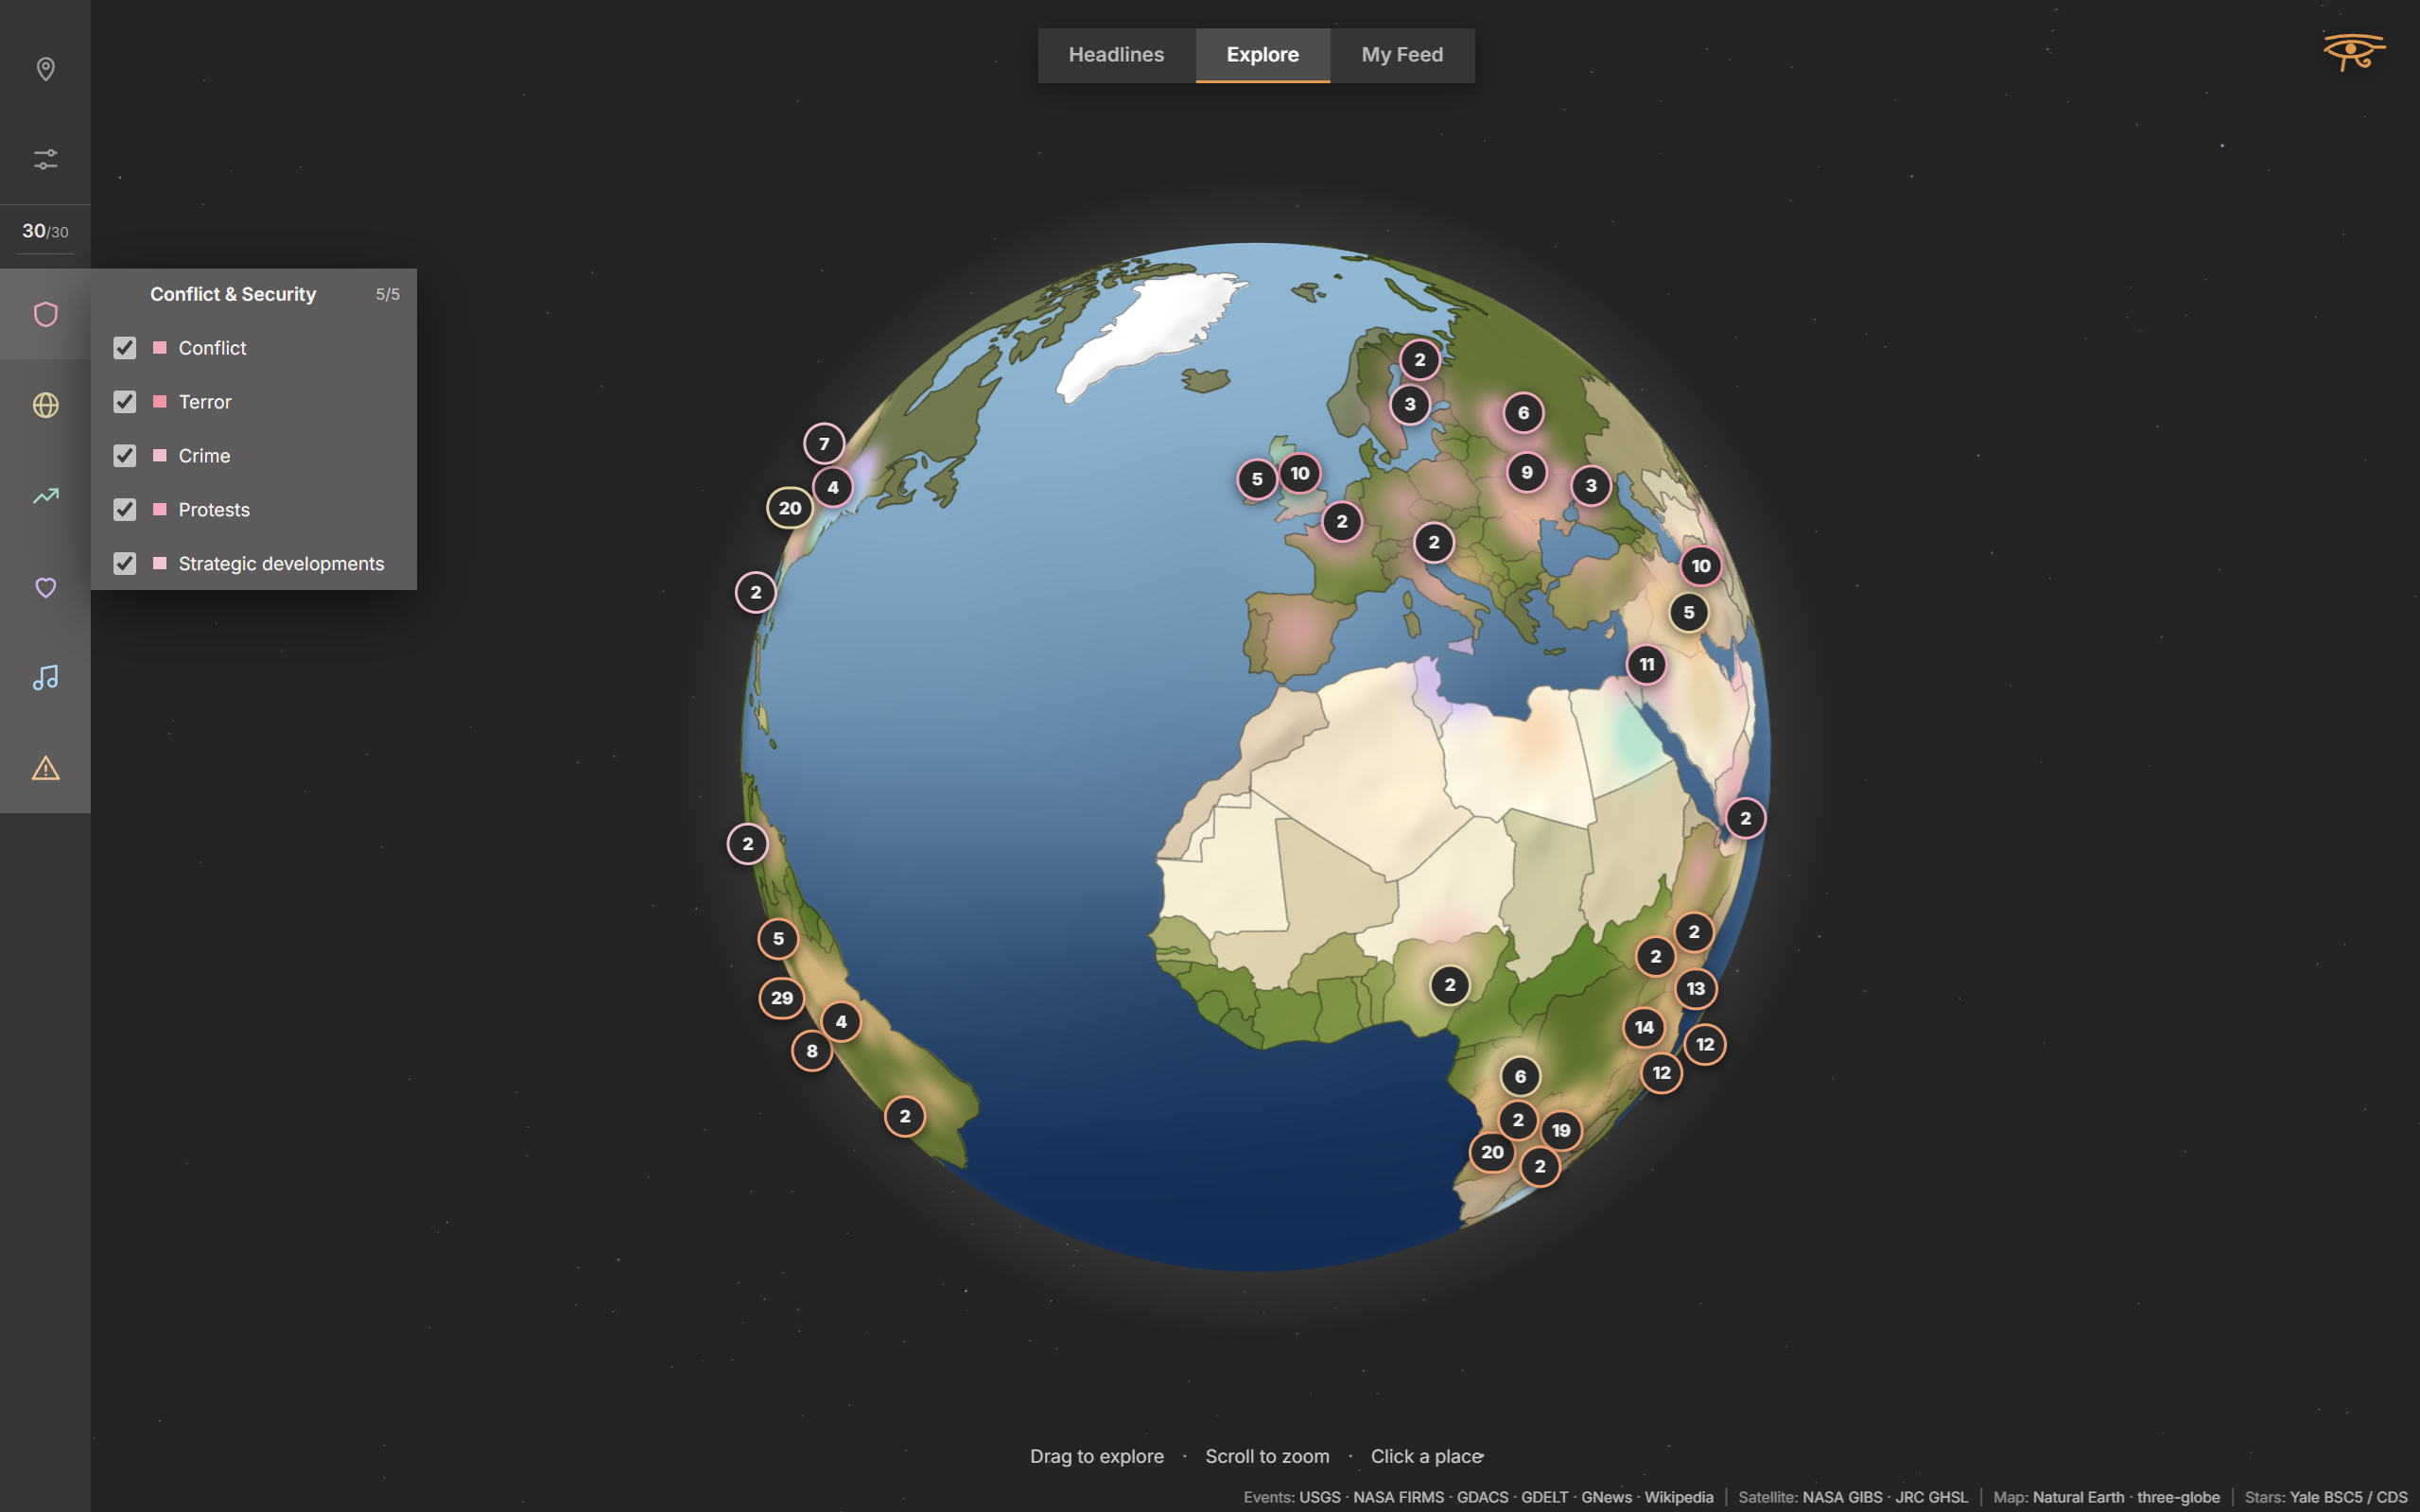
EyeofHorus is an interactive 3D globe of live world events: earthquakes, wildfires, floods, cyclones, and volcanoes, plus news on politics, conflict, society and more. Layers can be toggled and filtered by significance, time, and country. There are three views: Headlines, Explore, and My Feed, a personalized feed that learns from what you save and read.
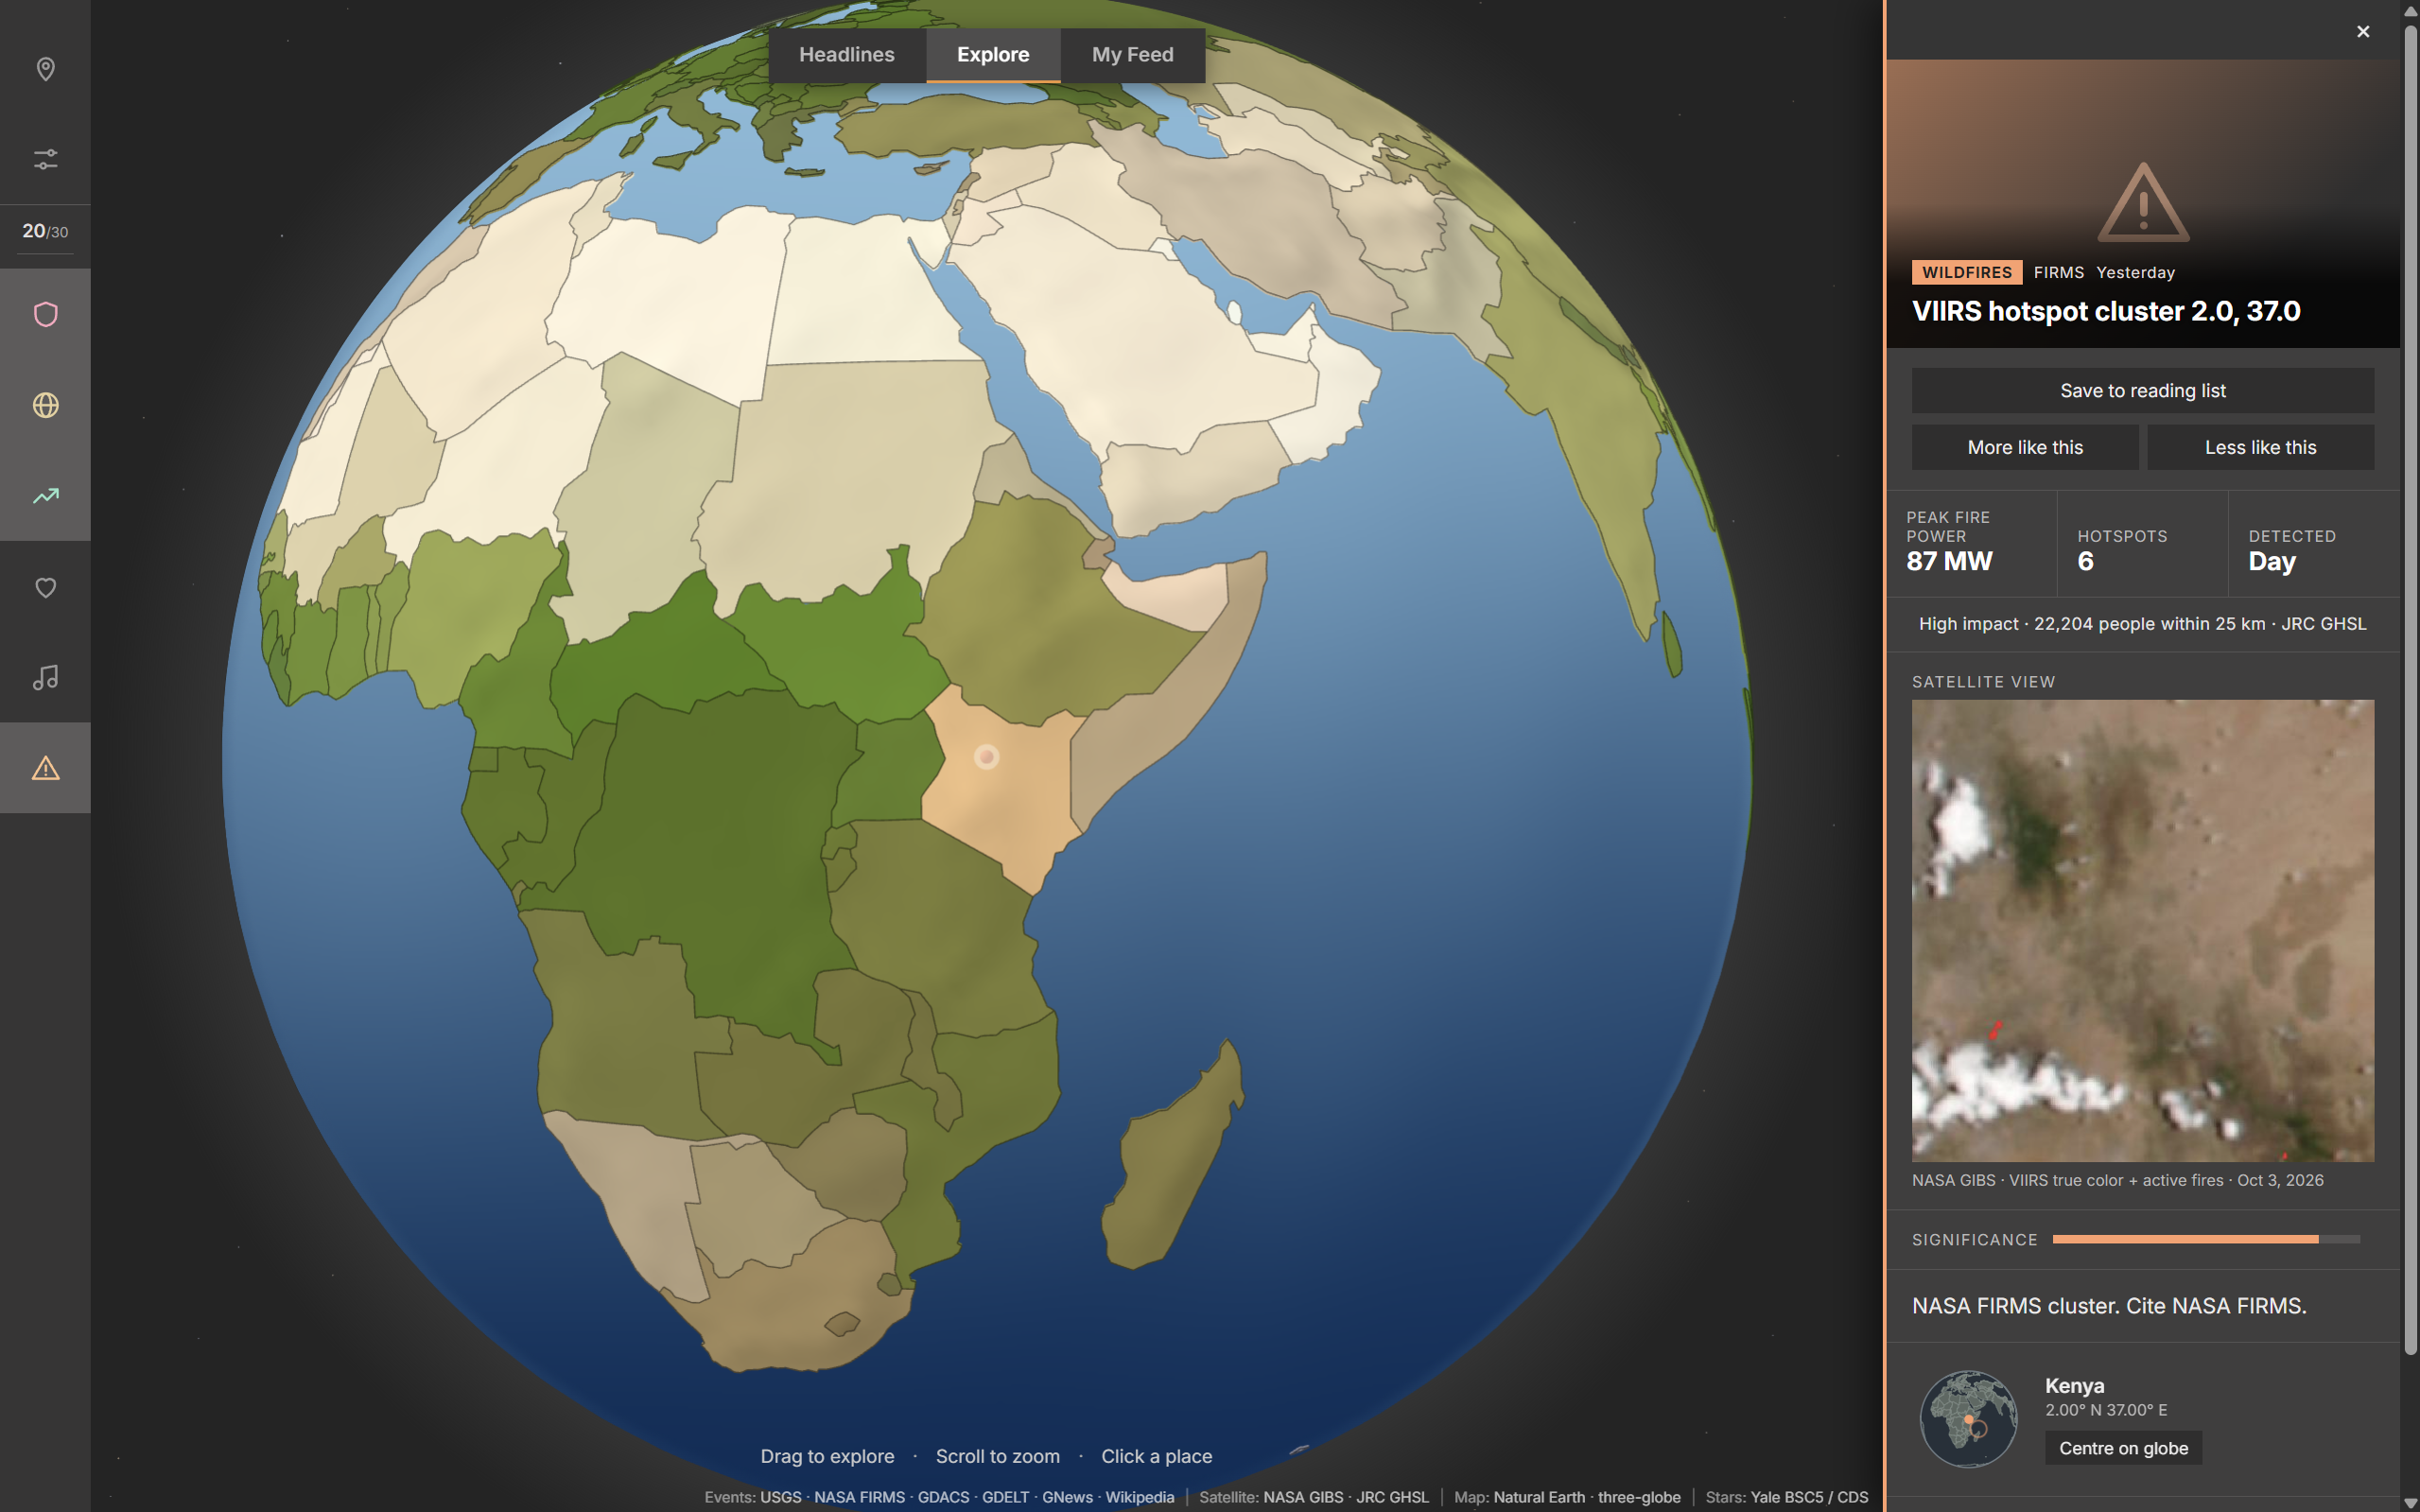
Every natural hazard has a briefing with:
- A satellite view: that day's NASA VIIRS true-color image of the area, with satellite fire detections drawn on top for wildfires.
- A human impact score: Low, Moderate, High, or Severe, based on the hazard's intensity and how many people live nearby, using the JRC GHSL satellite-derived population grid.
- Linked stories: related events connected by Gemini, each with a written explanation and its sources.
How we built it
- Frontend: Next.js, React, and TypeScript, with
react-globe.gland Three.js for the globe. - Backend: FastAPI, reached through a Next.js proxy on the same site, so database credentials and API keys stay on the server.
- Database: TigerData (Postgres with Timescale), holding raw source data and the cleaned events.
- Data jobs: Python jobs pull events from USGS, GDACS, NASA FIRMS, GDELT, GNews, and Wikipedia. Gemini tags, places, deduplicates, and links news events.
- Satellite data:
rasterioandnumpyadd up the GHSL population grid within a set distance of each hazard. The browser requests imagery for each briefing from NASA's GIBS image service, which needs no key.
Challenges we ran into
Deprecated APIs slowed us down repeatedly. Some planned services and endpoints were deprecated or close to shutting down, including the Google Maps heatmap layer and older Gemini models. Others had changed their access rules since the documentation we started from. We had to swap tools partway through and adapt our code to the newer replacements. On the satellite side, the population tiles didn't line up with a neat 10-degree grid, and some days one satellite had no imagery, so we combined images from two satellites to fill the gaps.
Accomplishments that we're proud of
- Satellite data that does real work: a population-based impact score for every hazard to aid in disaster relief prioritization, and a satellite image in every disaster briefing.
- One globe that brings together live feeds from many different sources, with source links kept on every event.
- AI-generated links between stories that explain the connection and cite sources instead of just asserting it.
- Ingestion of event data using APIs into TigerData cloud database.
What we learned
- How to work with open Earth observation data, such as NASA GIBS, VIIRS, and GHSL.
- Check that an API is current and stable before building on it.
- Keeping one shared event format let four people build the frontend, API, data jobs, and AI work in parallel.
What's next for EyeOfHorus
Historical data. The globe currently shows only recent events. Next we want to add historical records and a timeline, so users can scrub back through past disasters and news. They could then compare today's events with what happened in the same places before, and use decades of satellite archives to see how affected areas recovered.
Built With
- fastapi
- gemini
- google-geocoding
- next.js
- node.js
- postgresql
- python
- rasterio
- react
- tigerdata
- typescript


Log in or sign up for Devpost to join the conversation.