-
-
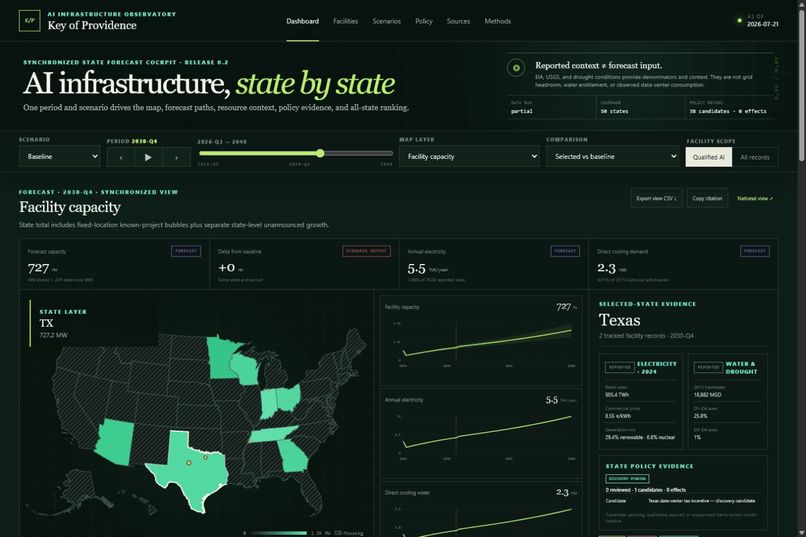
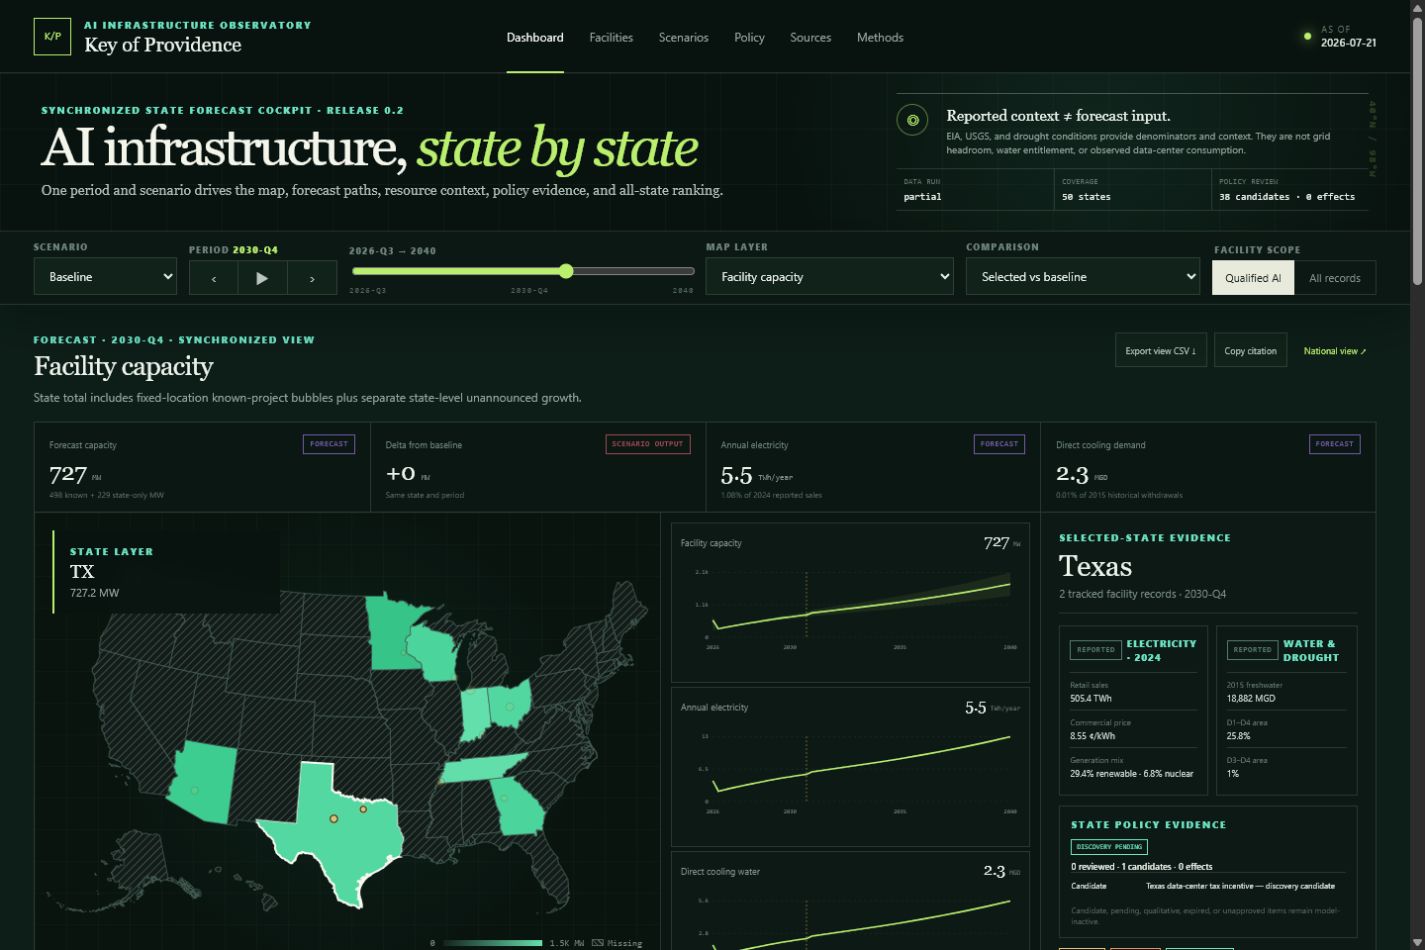
One synchronized research cockpit
-
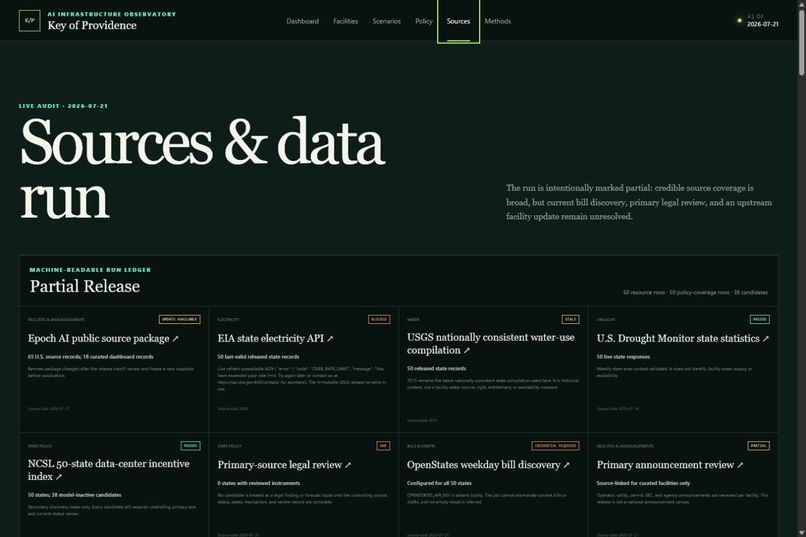
Failure is a visible data state
-
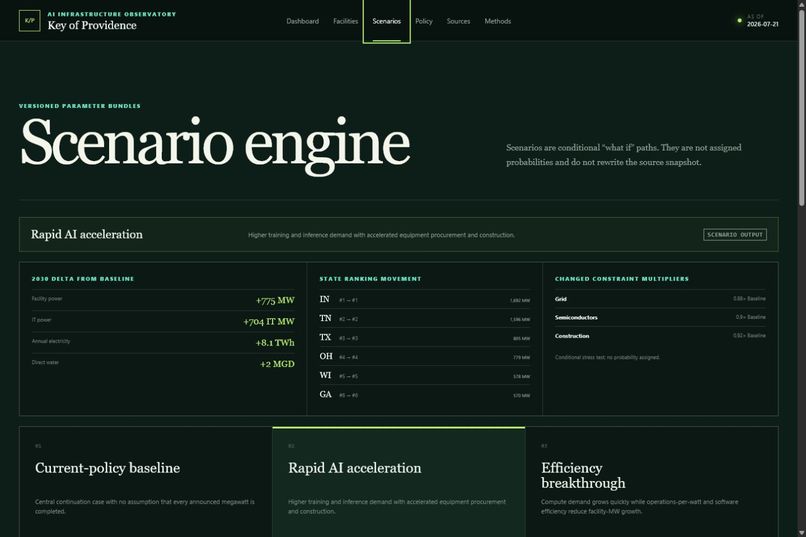
Nine versioned parameter bundles.
-
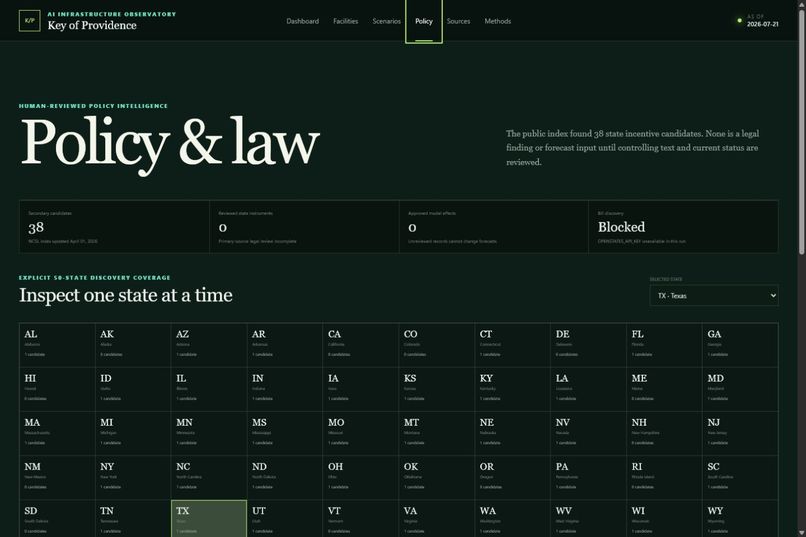
Discovery is not a legal finding
-
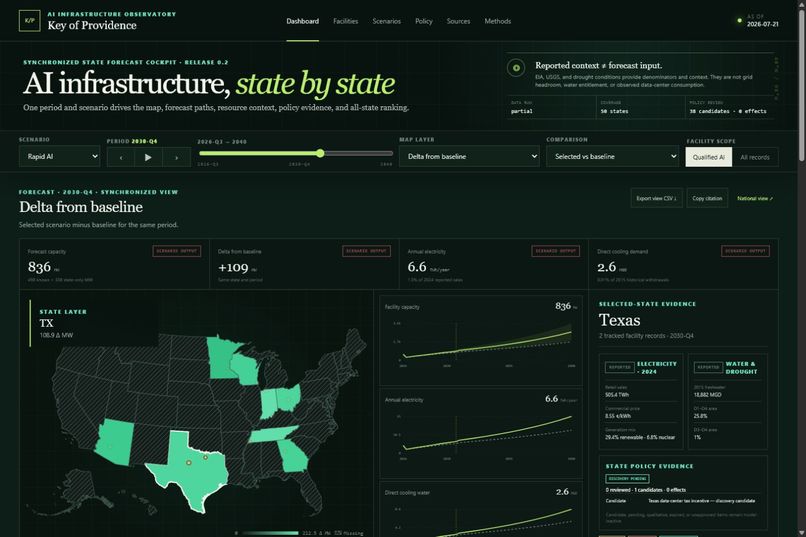
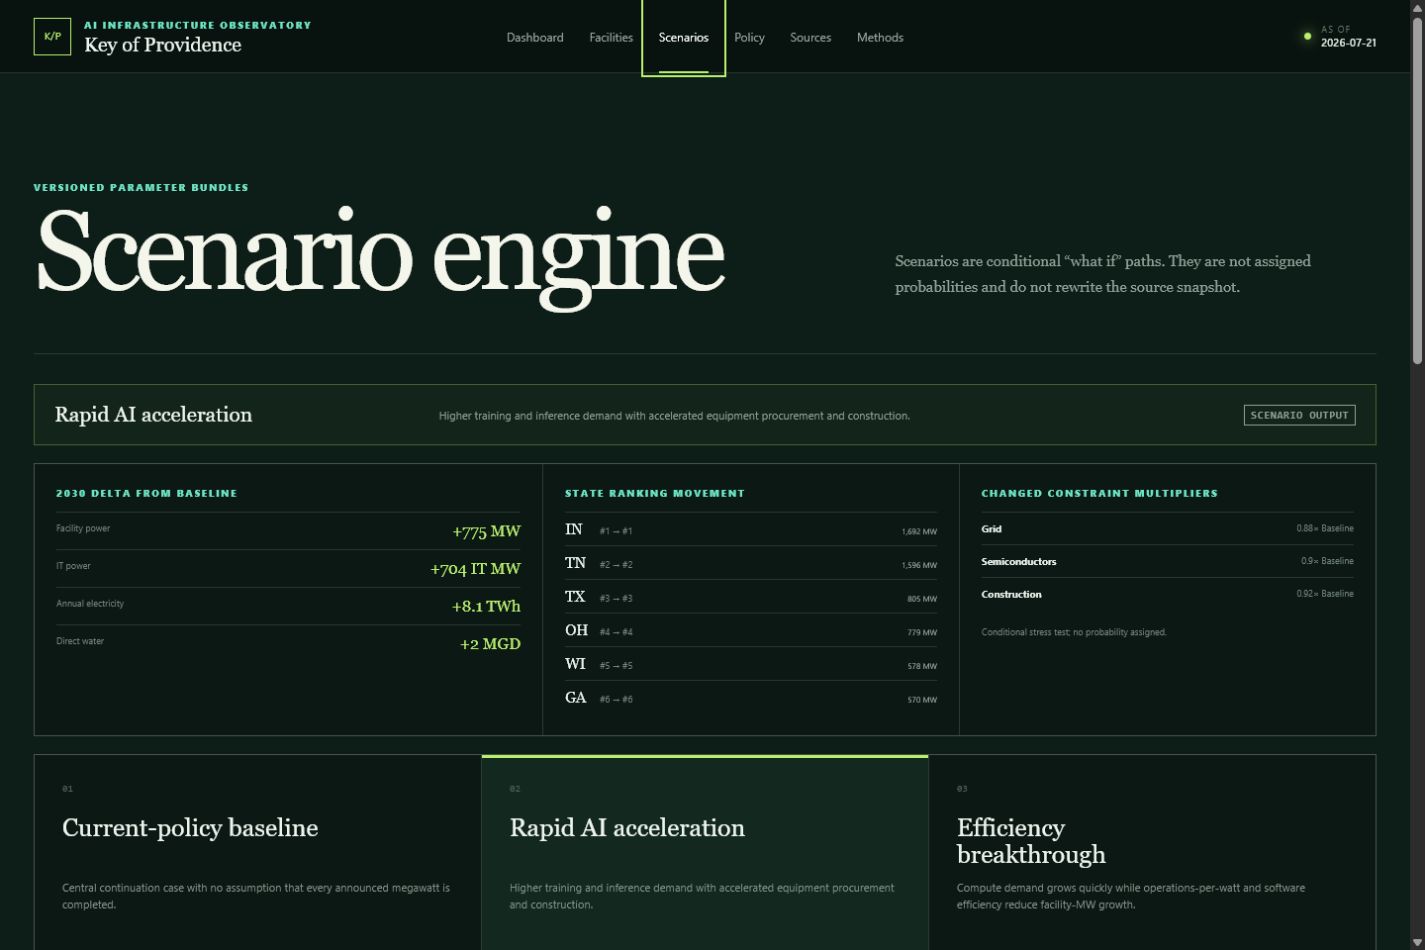
Conditional futures, not disguised predictions
-
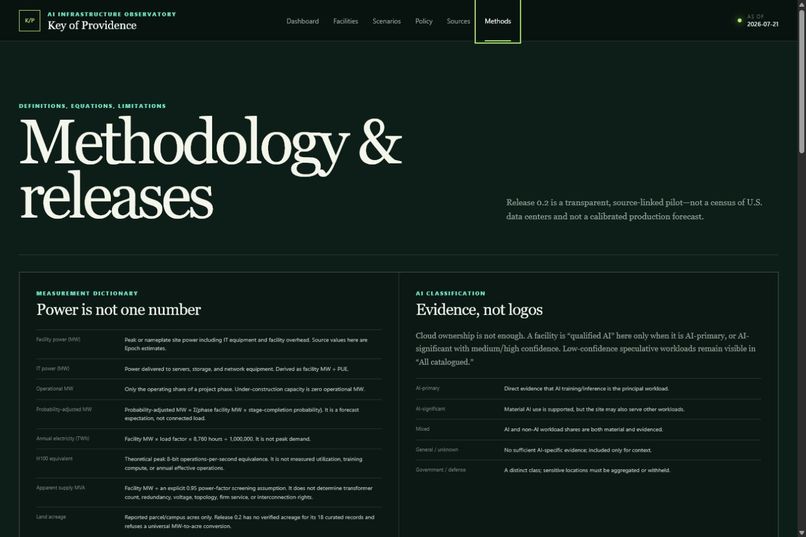
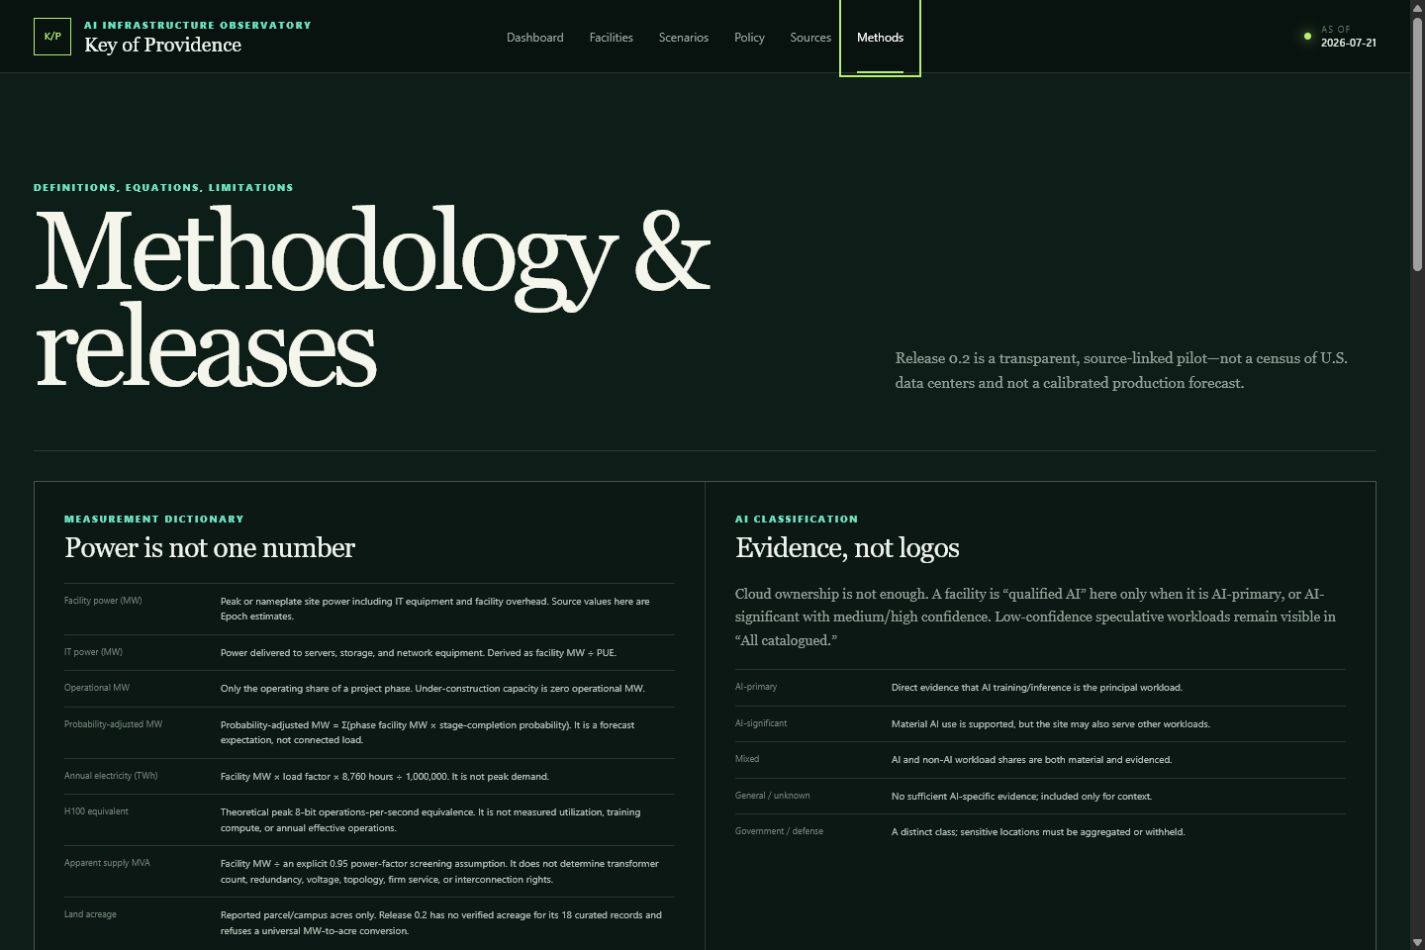
Definitions before dashboard
-
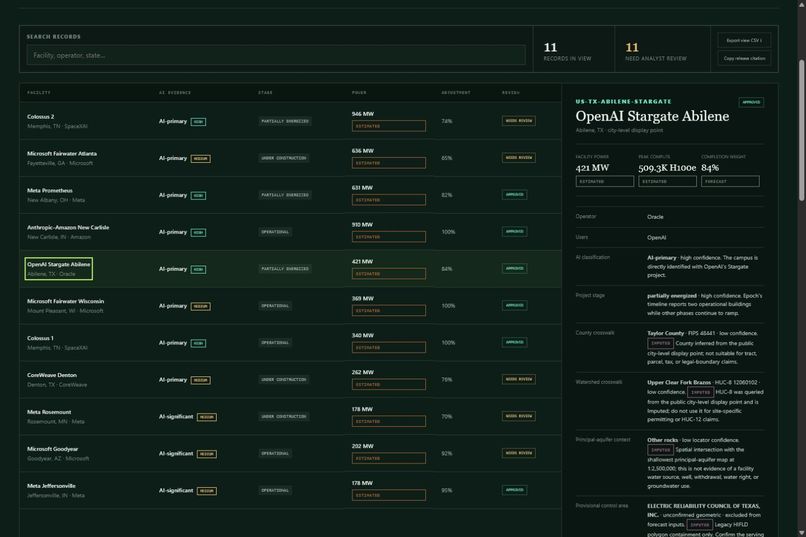
Every aggregate can be inspected.
About the project
Inspiration
AI infrastructure is increasingly discussed through giant headline numbers: megawatts announced, gigawatts requested, electricity consumed, water used, accelerators installed. But those numbers often describe different things. A campus announcement is not connected load. Facility power is not IT power. A state water total is not a data center's supply. A scenario is not a prediction.
We built Eye of Providence because researchers and decision-makers need more than another map of dots. They need a way to move from a national trend to a state, a facility, an equation, and the underlying evidence—without losing the uncertainty along the way.
The name reflects the product's purpose. It does not claim to reveal a predetermined future. It provides a key for interpreting several conditional futures and understanding what would have to be true for each one.
What it does
Eye of Providence is a synchronized observatory for United States AI data-center capacity, resource demand, constraints, and conditional futures.
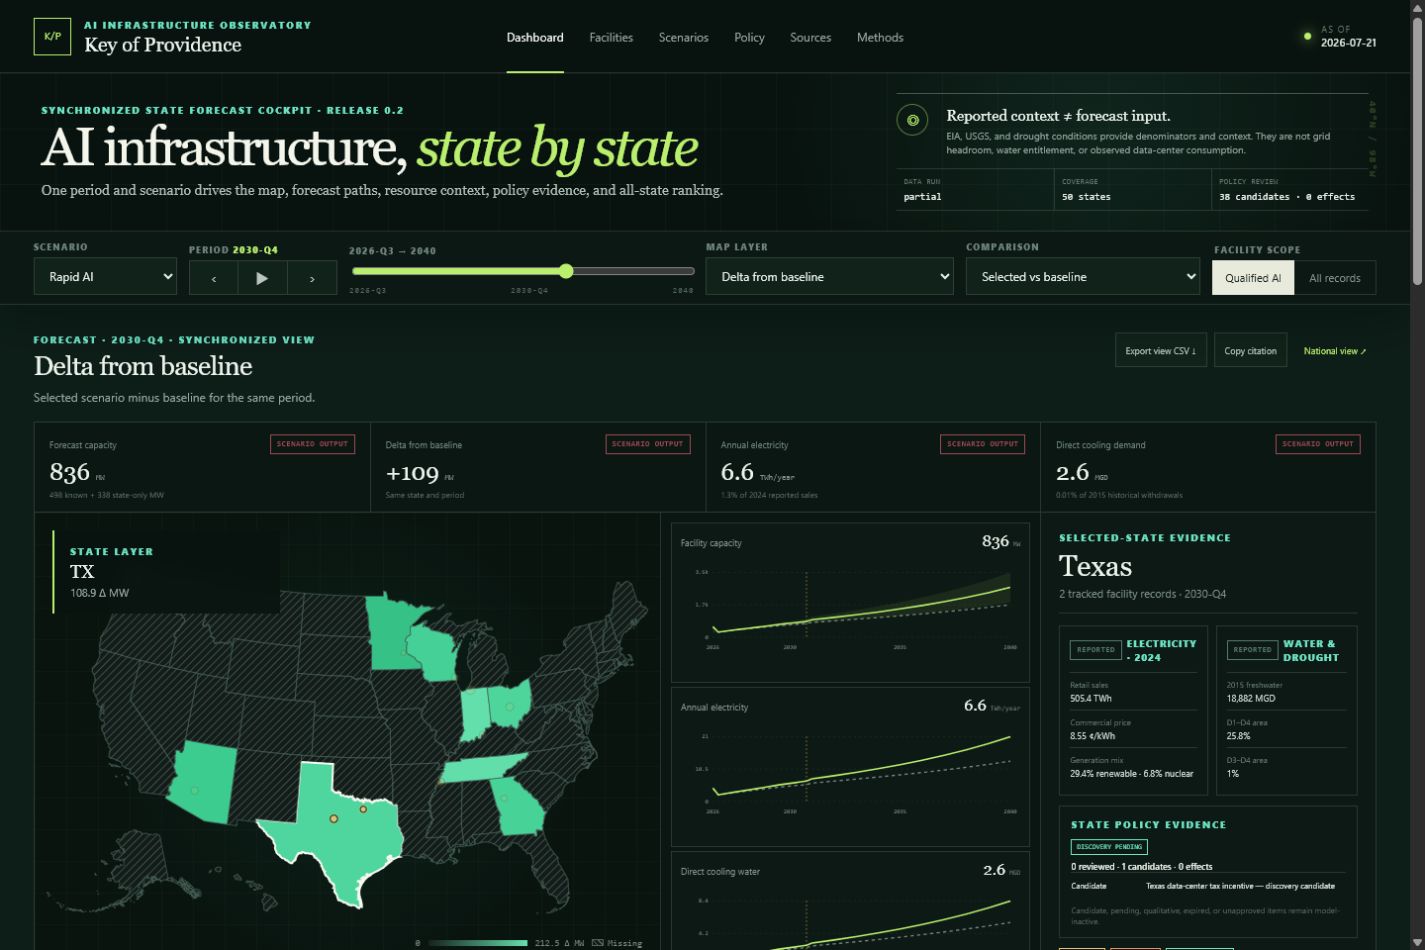
A single state, period, scenario, map layer, and comparison mode drives the entire interface. Users can:
- explore all 50 states on an offline-capable map, with Alaska and Hawaii insets and visible hatching where facility evidence is missing;
- move from 2026 through 2040 and compare nine versioned scenarios, including rapid AI growth, efficiency breakthroughs, grid bottlenecks, water limits, chip disruption, and demand pullbacks;
- keep fixed-location known projects separate from state-level unannounced growth;
- compare facility power, IT power, annual electricity, direct cooling water, completion-adjusted capacity, and scenario deltas;
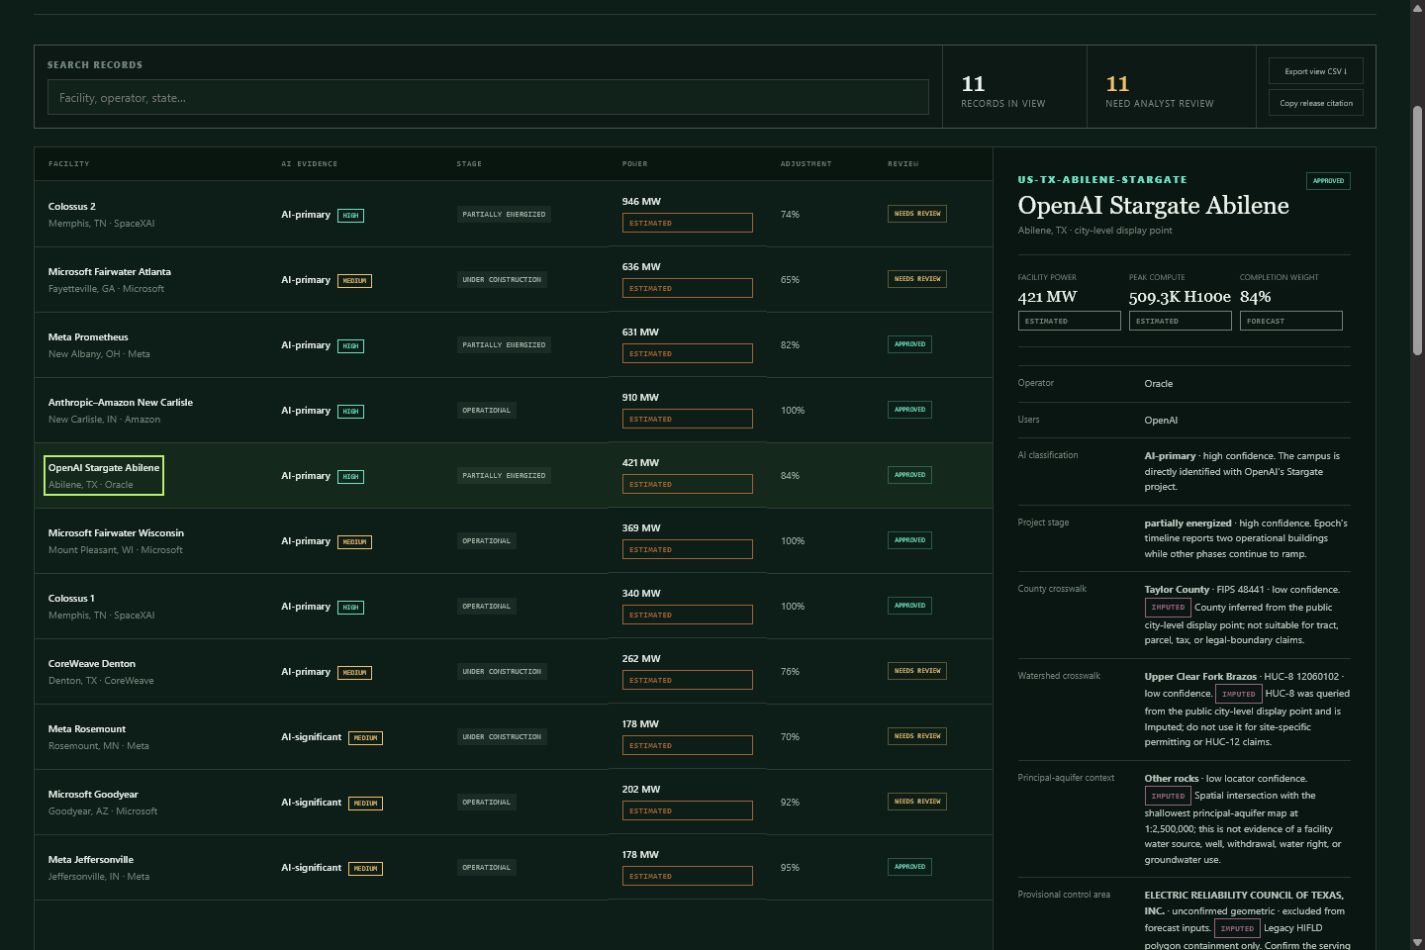
- inspect source-linked facility records, AI-use evidence, construction status, uncertainty, city-level disclosure, and geographic crosswalk limitations;
- see state electricity, historical water, drought, and policy evidence as context without silently turning those values into causal forecast inputs;
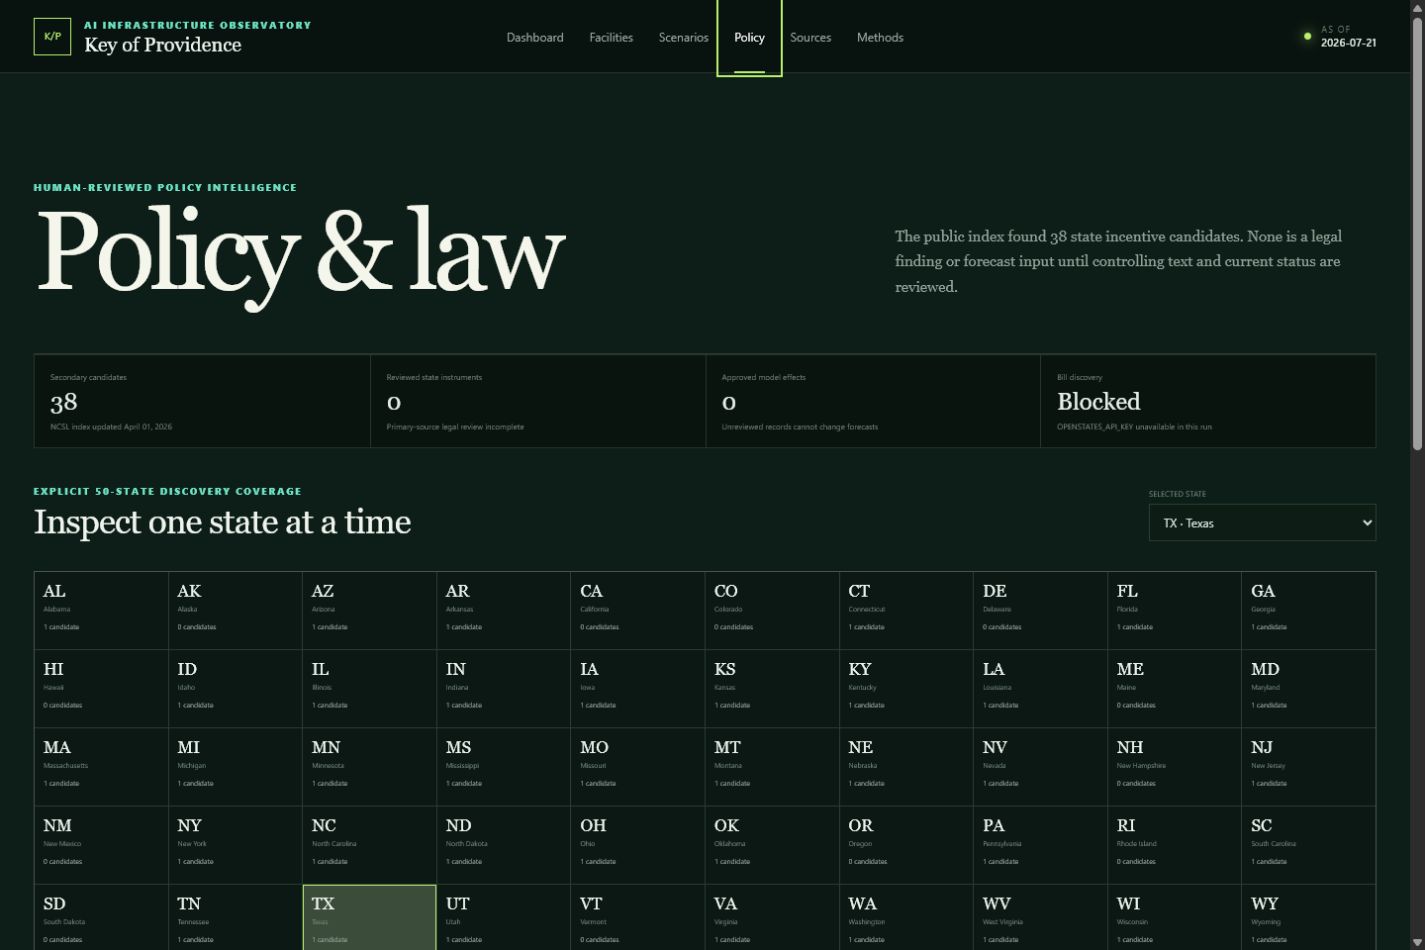
- distinguish policy discovery candidates from reviewed legal instruments and approved model effects;
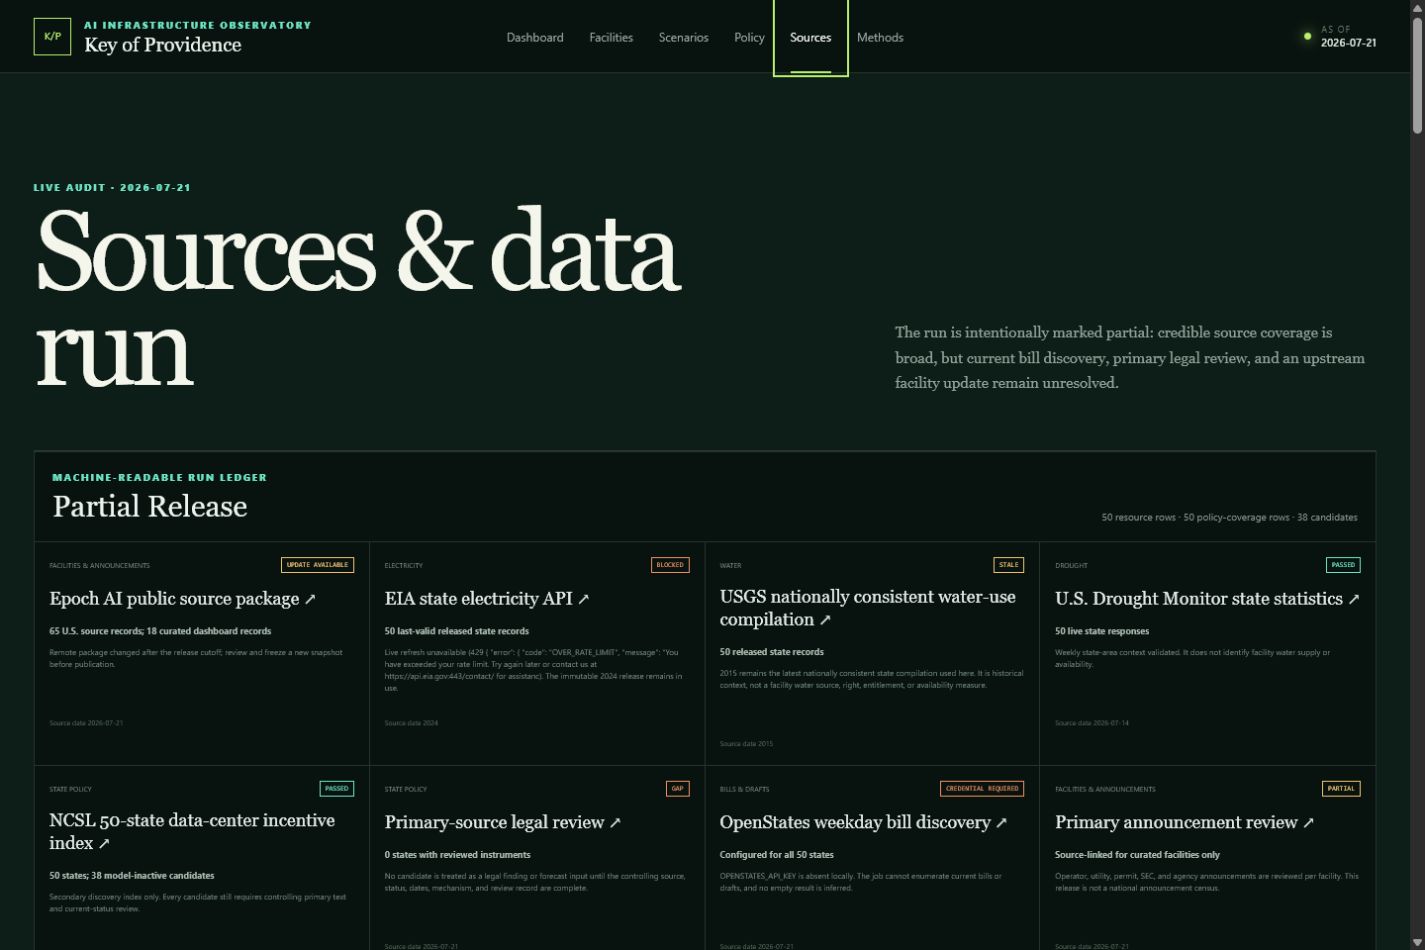
- inspect a machine-readable source-health ledger that exposes passed, stale, blocked, credential-required, partial, and update-available states;
- export the current view as CSV, copy a research citation, preserve selections in the URL, and trace displayed values back to equations and sources.
The release uses seven visible provenance classes: Observed, Reported, Verified derived, Estimated, Imputed, Forecast, and Scenario output. “No tracked record” is rendered as missing coverage, never as zero infrastructure.
How we built it
We chose a static-first architecture so judges can run the complete product locally without a paid database, map service, or runtime API.
The interface is built with React, TypeScript, Vite, d3-geo, TopoJSON, and local us-atlas geometry. A deterministic TypeScript domain model calculates facility ramps, state aggregation, scenario paths, resource conversions, uncertainty envelopes, and national reconciliation. Vitest, TypeScript, ESLint, release audits, and GitHub Actions enforce the same contracts used by the interface.
The data layer begins with an immutable, checksummed snapshot of Epoch AI's public AI Data Centers package. The current release retains 74 upstream records, including 65 United States records, and curates 18 facility records for the public dashboard. It joins those records to 50-state electricity context from EIA, nationally consistent historical water context from USGS, weekly drought context from the U.S. Drought Monitor, and a 50-state NCSL policy-discovery index. Geographic scripts build release-pinned county, HUC-8, principal-aquifer, provisional control-area, and provisional retail-utility crosswalks while retaining method and confidence.
How Codex and GPT-5.6 helped
Codex with GPT-5.6 was our development environment and coding partner, not a hidden forecasting engine inside the shipped app. The deployed runtime is deterministic and can be reproduced from the frozen release without model access.
Codex accelerated the work across the whole repository:
- translating the product idea into a data contract, model card, security model, and explicit acceptance gates;
- scaffolding and iterating on the React and TypeScript interface;
- implementing deterministic forecasting, resource equations, reconciliation, and calibration-readiness metrics;
- building ingestion, audit, policy-discovery, and geographic-crosswalk scripts;
- generating and extending tests for model behavior, provenance, validation, and release integrity;
- refactoring the dashboard after visual and functional audits;
- exercising the live app at desktop and narrow widths, checking interaction state, accessibility structure, and browser errors;
- producing source-linked documentation and making unsupported claims visible as blockers rather than smoothing them over.
The key decisions remained human-directed: keep the runtime static and inspectable; never infer a serving utility or water source from proximity; use city-level public points; keep policy candidates model-inactive until primary review; separate known projects from unannounced growth; and block calibration claims until real historical evidence exists. Those decisions were then encoded into types, tests, data manifests, and interface language so they could not quietly drift.
Challenges we ran into
1. Making unlike numbers stay unlike.
Public reporting often uses “capacity” for facility power, IT power, announced ultimate buildout, requested load, connected load, or annual energy. We had to define every field before charting it and carry the definition, unit, method, source, date, and provenance through each transformation.
2. Treating missing and failed updates honestly.
During the release run, the remote Epoch package changed after the cutoff, the EIA demo endpoint was rate-limited, the OpenStates key was unavailable, and the latest nationally consistent state water compilation used by the project was historical. Instead of replacing the last valid release with partial data—or displaying empty results—we built a source-health ledger and marked the run partial.
3. Adding geography without inventing service relationships.
A point inside a utility polygon does not prove the serving utility. A location above a principal aquifer does not prove groundwater use. Several facilities intersect multiple retail-territory candidates. We retained overlaps, confidence, vintage, and non-inference warnings, and excluded provisional relationships from forecasts.
4. Forecasting without false precision.
It was tempting to present a polished interval as a probability statement. We instead implemented a calibration-readiness gate, leakage rules, and scoring functions, then let the gate fail visibly because the required historical cutoffs do not yet exist.
5. Keeping a dense research product coherent.
The map, three forecast paths, state evidence, policy state, facility scope, ranking table, URL, exports, and playback all needed to stay synchronized. We repeatedly simplified the interface, removed duplicate panels, added reduced-motion behavior, and tested wide and narrow layouts.
Accomplishments that we're proud of
- A complete, runnable research product rather than a static mockup.
- A synchronized 50-state cockpit with nine scenario bundles and explicit missing-evidence states.
- Facility-level evidence and equations that remain inspectable from every aggregate view.
- A provenance taxonomy that changes the interface, not just the footnotes.
- Immutable source snapshots, SHA-256 manifests, deterministic release audits, tests, and CI.
- Privacy-conscious city-level mapping and a security model for future document ingestion and human approvals.
- A calibration gate that is useful precisely because it refuses to certify the current release.
What we learned
We learned that provenance is not metadata added after a model is finished; it is part of the product architecture. It shapes types, joins, chart labels, missing states, review workflows, and what the model is allowed to calculate.
We also learned that an honest “unknown,” “stale,” or “blocked” state can be more useful than a complete-looking dashboard. The most important rule in the project became simple: absence of evidence is not a zero, and spatial proximity is not a service relationship.
Finally, GPT-5.6 and Codex were most effective when the project supplied explicit invariants and executable gates. The agent could move quickly across UI, model, data engineering, tests, and documentation, while the contracts made the boundaries reviewable.
What's next
The next release will focus on evidence rather than cosmetic expansion:
- freeze several genuinely historical source cutoffs and compare them with independent later outcomes;
- replace demonstration completion weights with leakage-reviewed, hindcast-calibrated estimates;
- confirm serving utilities, balancing authorities, interconnection status, water providers, and site acreage from primary evidence;
- complete primary legal review for state policy candidates and keep quantitative effects behind a two-person approval gate;
- add authenticated, signed analyst approvals and append-only release history;
- expand facility and announcement coverage without converting “no record” into “no infrastructure.”
Eye of Providence is already useful as an inspectable scenario and evidence instrument. Its ambition is to become a shared research surface where planners, journalists, analysts, and communities can debate the future of AI infrastructure while looking at the same definitions, sources, assumptions, and gaps.


Log in or sign up for Devpost to join the conversation.