Inspiration
The inspiration for Export Compass came from a critical business problem: Egyptian foreign-trade datasets are vast and highly detailed, but raw availability does not make this information immediately useful for decision-makers. We realized that relying on a single indicator—such as a high export growth rate, a large trade deficit, or a low market share—is insufficient evidence to declare a true export or manufacturing opportunity. We wanted to solve this analytical translation problem by converting high-volume trade records into a chain of understandable, multi-dimensional metrics that support disciplined market screening.
What it does
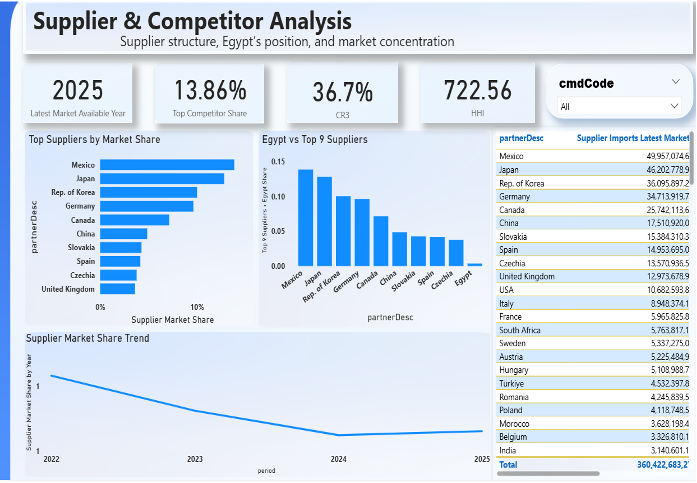
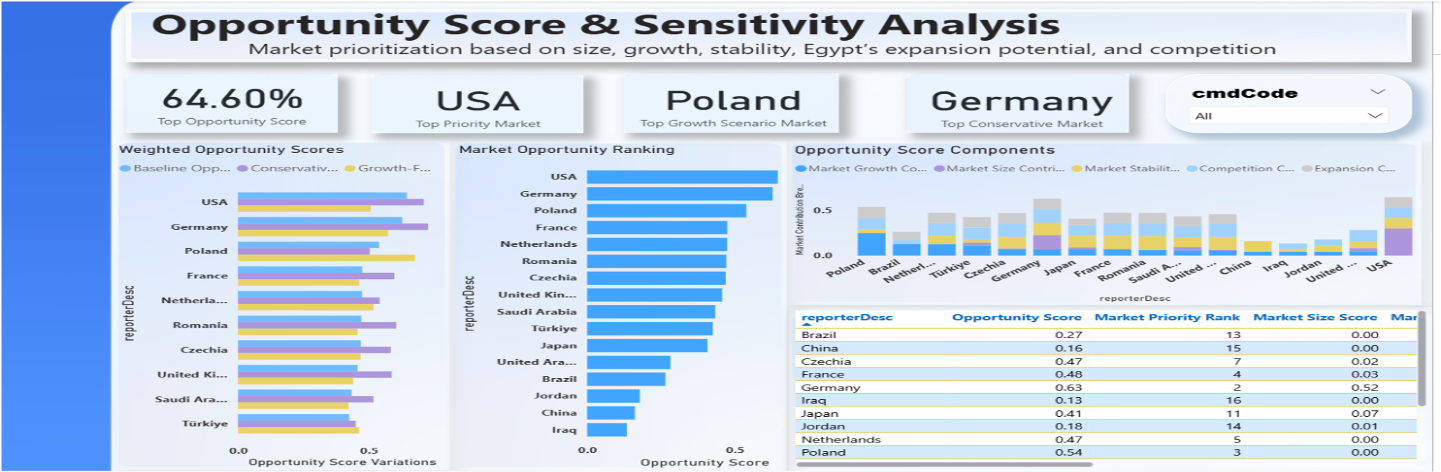
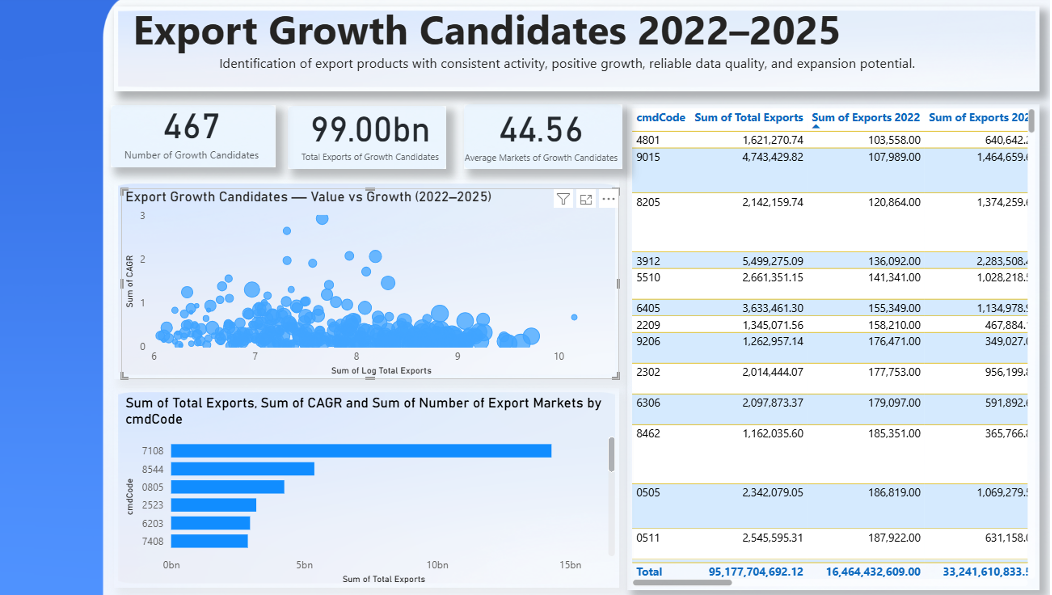
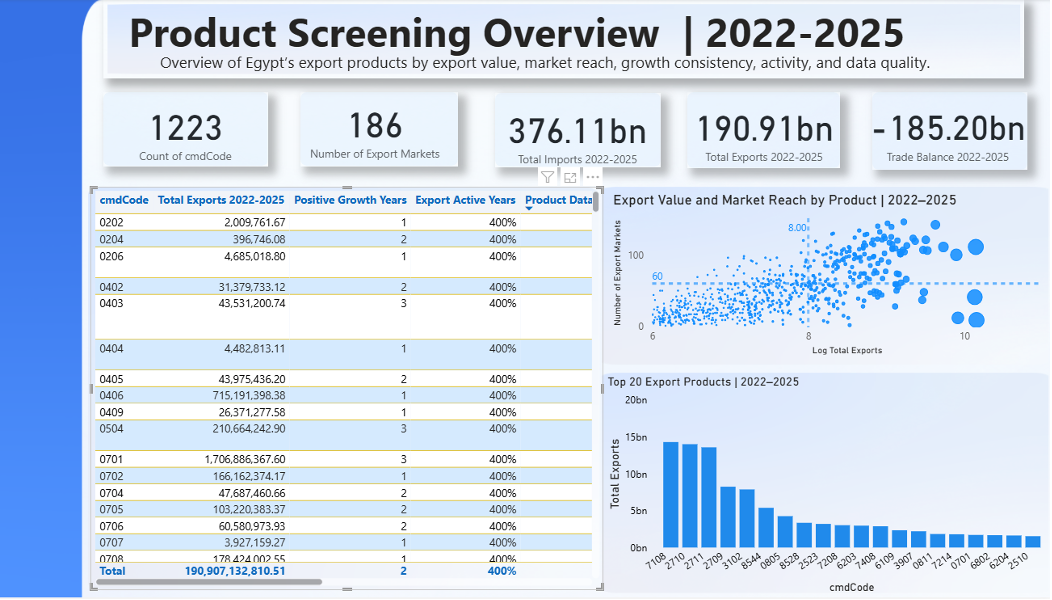
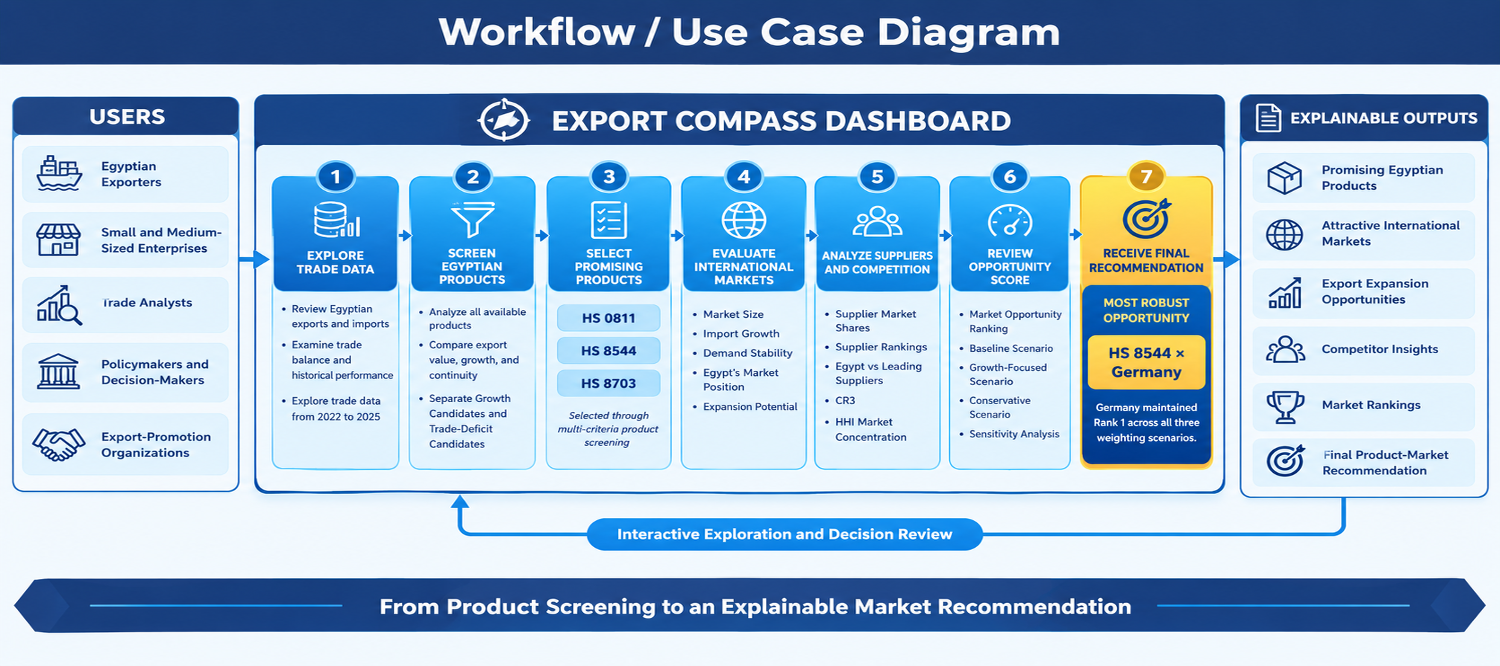
Export Compass is an end-to-end data-driven platform that evaluates Egypt's trade, screens products, compares international markets, and assesses competitor concentration. Instead of issuing a guaranteed commercial recommendation, it reduces the search space and provides an evidence-based prioritization framework.
The core of the platform is the Opportunity Score, a transparent ranking metric that normalizes and combines five dimensions:
Market Size (30%)
Demand Growth (25%)
Demand Stability (15%)
Egypt Share Expandability (15%)
Competition (15%)
How we built it
We implemented a staged analytical strategy. First, we analyzed Egypt's overall trade to screen and select a small portfolio of products (e.g., HS 8544, HS 0811, HS 8703) based on economic significance, continuous growth, and data quality. Then, we shifted to a global market analysis using UN Comtrade data to evaluate target markets.
To measure competitor concentration within these markets, we utilized the Herfindahl-Hirschman Index (HHI), calculated as the sum of the squares of the market shares of the suppliers:
$$HHI = \sum_{i=1}^{N} s_i^2$$
We processed and modeled the data using Python for cleaning and Microsoft Power BI for data modeling, DAX measure creation, and interactive visualization.
Challenges we ran into
A major part of our project work involved intense analytical debugging rather than just creating visuals. We faced significant challenges regarding DAX filter contexts. For instance, during the competitor analysis phase, our table initially returned the same repeated value (the market total) for every supplier. We discovered this was caused by the removal of the supplier filter context when searching for the latest valid observation year. We successfully resolved this by redesigning the calculation to adjust only the necessary period context while keeping the supplier filter active. We also had to troubleshoot period data-type mismatches where visually numeric values behaved as text, causing comparison logic to fail.
Accomplishments that we're proud of
We successfully built a robust system where no single metric dominates irresponsibly. We are proud of designing the "Latest Available Year" logic, which intelligently searches for the most recent period with a valid measure rather than blindly using the maximum year in the dataset, preventing blank or misleading comparisons when markets have different reporting coverage.
What we learned
We learned that data quality and model context are completely inseparable from business interpretation. Our testing validated that a high growth rate can be misleading if it originates from a tiny base, and that a less concentrated supplier structure (low HHI) does not automatically mean easier market access for Egypt. Ultimately, we proved that effective data analysis is about contextualizing evidence, not just plotting numbers.
What's next for Export Compass
To further bridge the gap between market prioritization and commercial feasibility, future enhancements for Export Compass include integrating customs tariffs, trade agreements, shipping costs, and non-tariff barriers. We also plan to implement automated data refreshes and expand the platform to cover a wider range of economic sectors.


Log in or sign up for Devpost to join the conversation.