-
LEGO DASHBOARD

Inspiration
I've always admired how LEGO blends creativity and logic and wanted to analyze how data reflects that balance.
This dashboard visualizes LEGO set trends, parts diversity, and play categories to uncover what drives engagement and innovation in LEGO's digital ecosystem.
What It Does
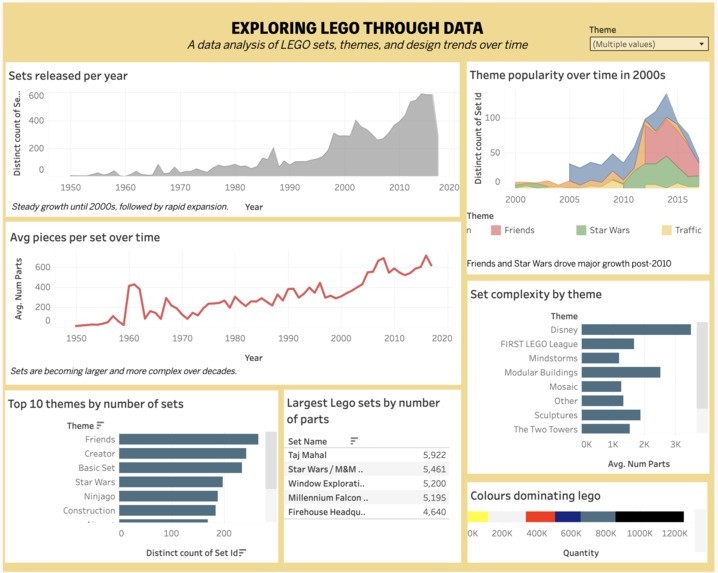
- Integrates LEGO dataset (themes, parts, year, price, pieces) to visualize brand evolution from 1950–2017.
- Interactive filters for theme, year, and price to track product design diversity.
- Shows correlations between piece count, retail price, and theme popularity.
- Provides category-wise dashboards for "Classic," "Star Wars," and "Technic" sets to illustrate creative intensity.
- Designed with LEGO's data storytelling and play philosophy in mind.
How I Built It
- Dataset: LEGO brick dataset (via Kaggle).
- Tools: Tableau Desktop, Excel and Python preprocessing
- Data preparation: Cleaned 18,000+ rows; normalized missing theme and part values.
- Visualization: Created multiple dashboards (Theme Trends, Set Complexity, Price Evolution).
- Design: Used LEGO color palette (red, yellow, blue) and playful typography to reflect brand personality.
Results
- Produced a clear interactive dashboard.
- Enabled year-over-year comparison for 60+ LEGO themes.
- Used as a storytelling demo for digital analytics roles and data visualization showcases.
What Makes It Unique
- Balances data accuracy with design storytelling, built to feel like a LEGO experience.
- Focused on making analytics approachable for non-technical users.
- Serves as both a data exploration tool and a creative portfolio piece.
Challenges I Ran Into
- Cleaning the large dataset while maintaining relationships between parts, sets, and themes.
- Choosing metrics that reflect creativity rather than just sales or quantity.
- Translating a playful brand identity into a clean dashboard design.
Accomplishments That I'm Proud Of
- Built a complete Tableau story from scratch and refined it for interactivity.
- Created a design that feels authentic to LEGO's visual identity.
- Strengthened my data storytelling and dashboard design workflow.
What I Learned
- How to blend creative branding and analytical insight in one interface.
- How to communicate data visually in a way that sparks curiosity.
- Reinforced my passion for combining creativity, data, and play. something I want to keep exploring professionally.
What's Next
- Expanding it with LEGO behavioral analytics (customer reviews, play ratings).
- Adding a sustainability lens, CO₂ per part or packaging footprint.

Log in or sign up for Devpost to join the conversation.