Inspiration
One of our team members is planning to study abroad next year. Besides going to the usual sights, we wanted to analyze what he should see with his limited time in Europe.
What it does
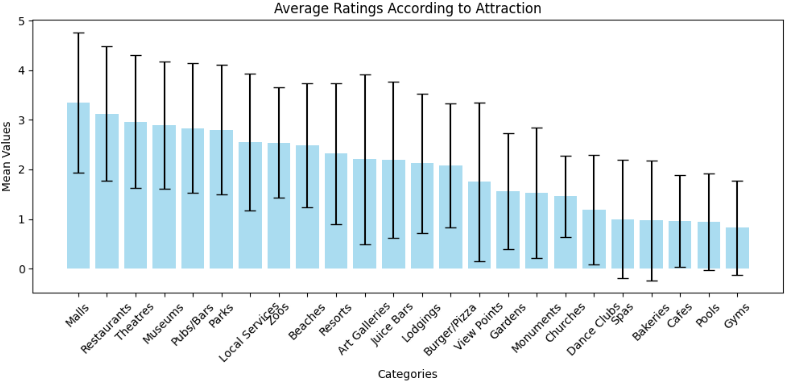
Using the Google review data, we used statistical analysis to recommend the most enjoyable activities when traveling to Europe. Additionally, we found attractions that users on average rated highly to individualize experiences.
How we built it
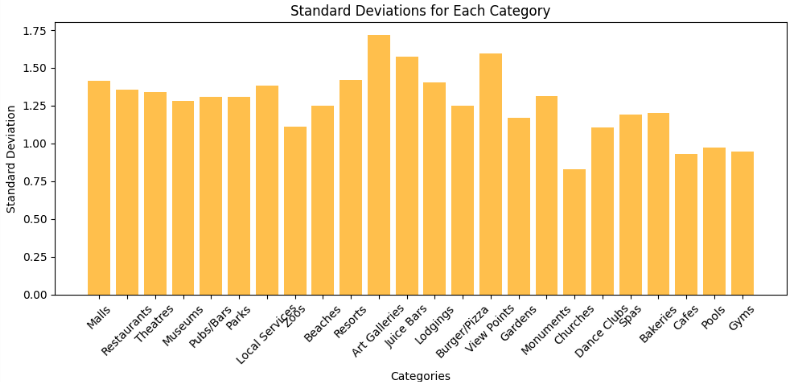
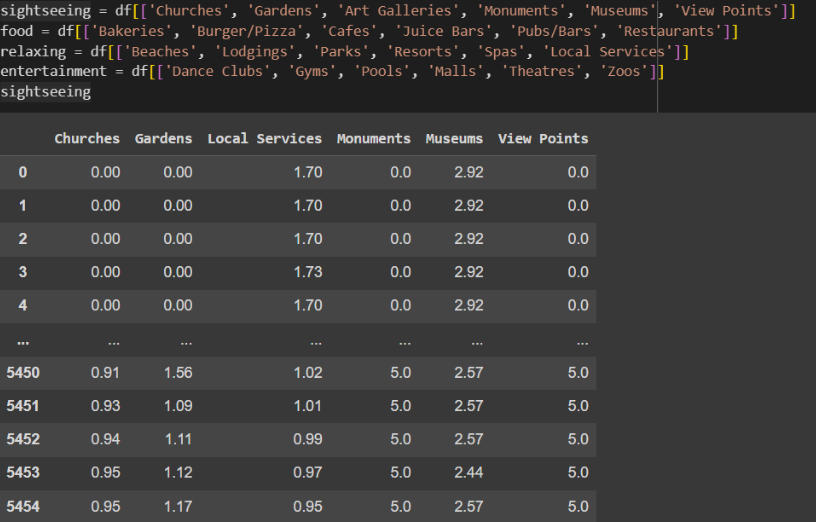
We aggregated the mean and standard deviation of reviews for each attraction. Then we grouped the attractions based on similar classes of typical vacation activities. We ran statistical analyses which allowed us to make practical rankings of different activities, and compare the popularity of certain activities with each other.
Challenges we ran into
With such an open-ended dataset, determining how we planned to use the data was initially challenging. We also struggled with deciding how to group attractions within the dataset. Also, because the data was already averaged, we had to make some assumptions before performing analysis.
Accomplishments that we're proud of
We used statistical analysis techniques to help generate travel activity recommendations based on Google reviews. We are also proud that we were able to generate other possible recommendations based on personal preferences.
What's next for ExploreMore: Travel Recommendations
Potentially, we could try to improve our recommendations with more data, as the dataset only includes ~5000 users. Additionally, we could compare this data with similar rating platforms, such as TripAdvisor, to see if our models hold up.

Log in or sign up for Devpost to join the conversation.