-
-
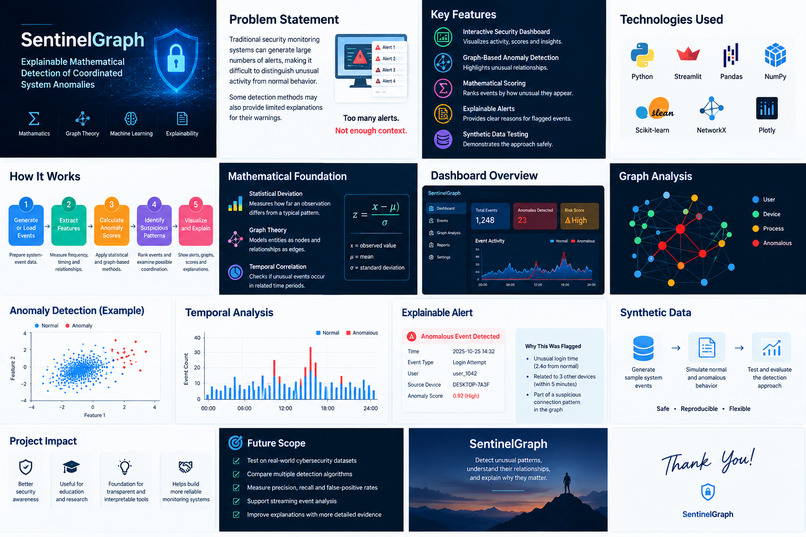
SENTIEL GRAPH
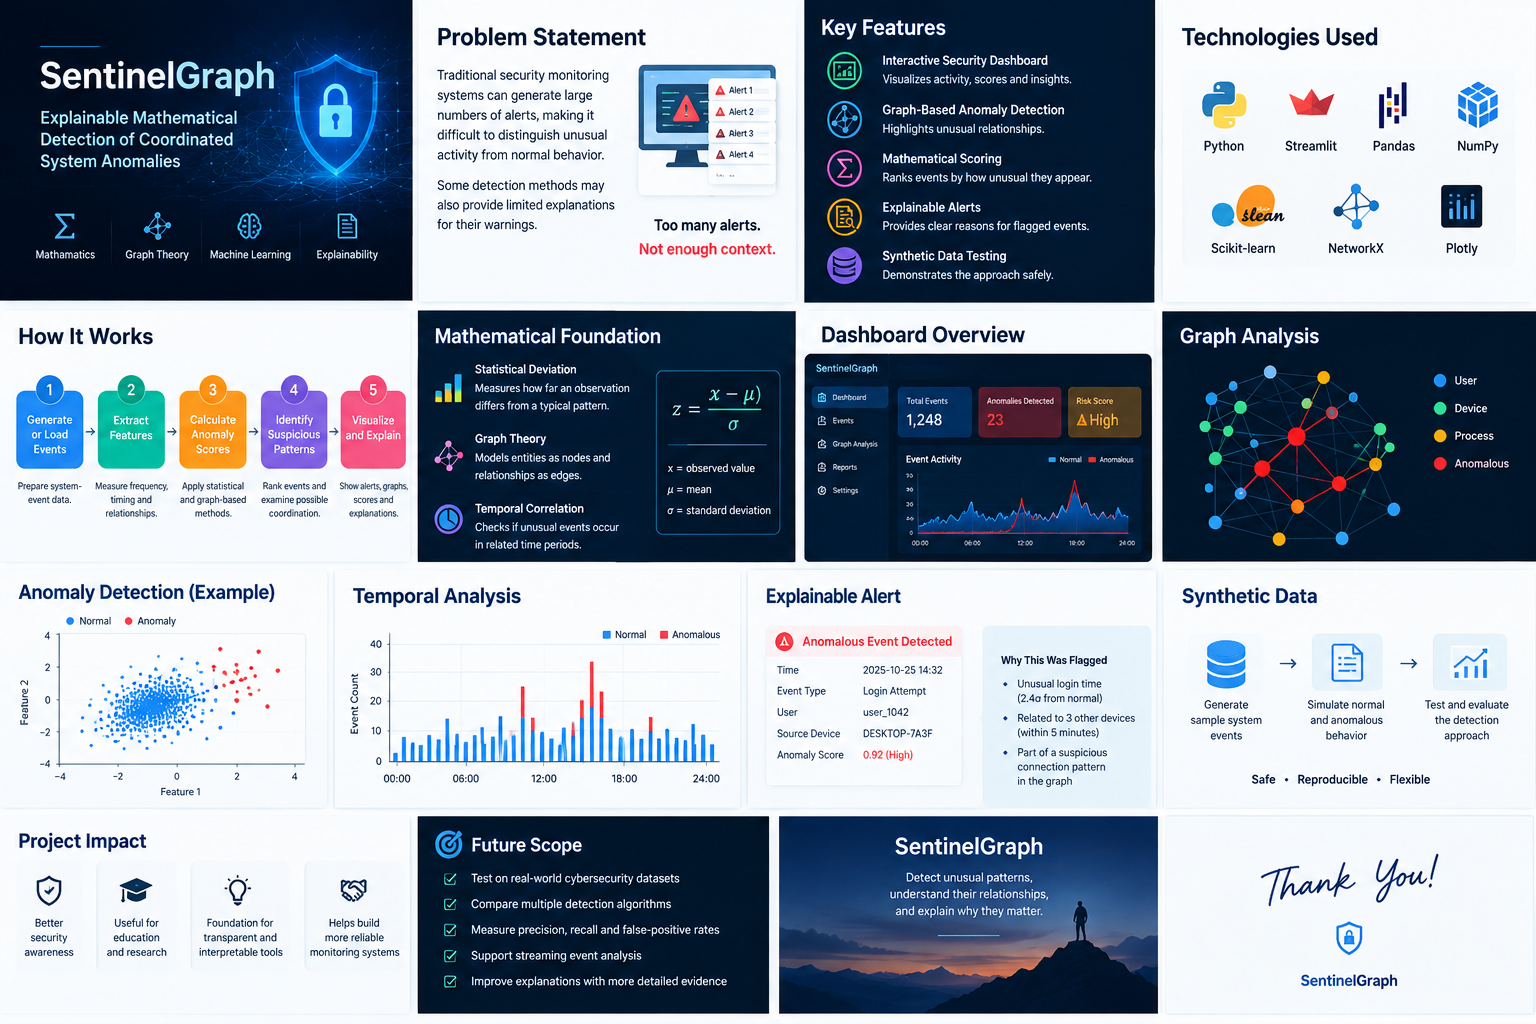
SentinelGraph: Explainable Mathematical Detection of Coordinated System Anomalies
Inspiration
I was inspired by a simple but important question: Can mathematics help us identify suspicious system activity and explain why it looks unusual?
Modern computer systems generate large amounts of activity data, and identifying unusual patterns can be challenging. I wanted to explore how mathematical concepts, graph theory, and machine learning could work together to make anomaly detection more understandable.
This idea led me to build SentinelGraph, a Python-based prototype that analyzes system-event patterns, highlights potential anomalies, and presents its findings through an interactive dashboard.
What It Does
SentinelGraph combines three analytical perspectives:
- Statistical analysis: Identifies observations that differ from typical patterns.
- Graph analysis: Examines relationships between system entities and highlights unusual connections.
- Temporal analysis: Explores the timing and frequency of events to identify potentially coordinated behavior.
The project presents results through visualizations, anomaly scores, and explanations of why particular events were flagged. It uses synthetic event data to demonstrate its approach without requiring sensitive real-world system logs.
How I Built It
I developed SentinelGraph using Python and a collection of data-analysis and visualization libraries.
- Pandas and NumPy support data processing and mathematical calculations.
- Scikit-learn provides machine-learning tools for anomaly detection.
- NetworkX represents and analyzes relationships between system entities.
- Streamlit powers the interactive dashboard.
- Plotly creates interactive charts and visualizations.
The development process involved generating sample system events, extracting useful features, calculating anomaly scores, analyzing relationships, and presenting the results in a dashboard. I also incorporated explanations to help users understand the reasoning behind individual alerts.
What I Learned
Building SentinelGraph helped me understand how mathematical ideas can be applied to practical cybersecurity problems. I explored statistical deviation, graph theory, feature engineering, anomaly detection, and interactive data visualization.
I also learned that detecting an unusual event is not the same as proving that it is malicious. An effective detection system must consider context, explain its results, and be evaluated using appropriate metrics.
Most importantly, I learned how different Python libraries can be combined to turn a research idea into an interactive software prototype.
Challenges I Faced
One of the main challenges was combining different analytical approaches into a coherent system. Statistical scores, graph relationships, and event timing describe different aspects of system behavior, so integrating them requires careful feature selection and scoring.
Another challenge was making the results understandable. A numerical anomaly score is not particularly useful if users cannot interpret it, so the dashboard emphasizes visual patterns and explanations.
A further challenge was evaluating the reliability of the approach. Because the initial prototype uses synthetic data, its behavior on real-world security events remains to be tested. This highlighted the importance of validation, false-positive analysis, and transparent reporting.
Future Plans
I would like to evaluate SentinelGraph using publicly available cybersecurity datasets, compare different detection algorithms, and measure precision, recall, and false-positive rates. Future versions could also support streaming events and more detailed explanations of suspicious patterns.
Conclusion
SentinelGraph represents my exploration of how mathematics, graph theory, and machine learning can contribute to more explainable cybersecurity analytics.
My goal is not simply to flag unusual activity, but to help users understand the patterns behind those alerts. This project is a starting point for building security tools that are more transparent, interpretable, and useful for research and learning.
Built With
- networkx
- numpy
- pandas
- python
- scikit-learn
- streamlit


Log in or sign up for Devpost to join the conversation.