-
-
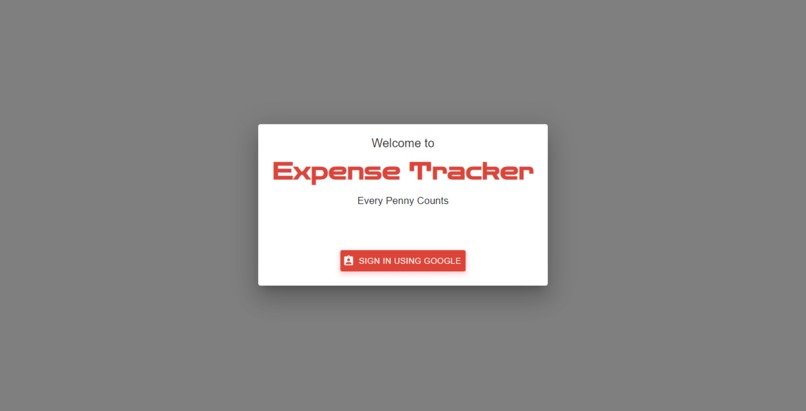
Login Page
-
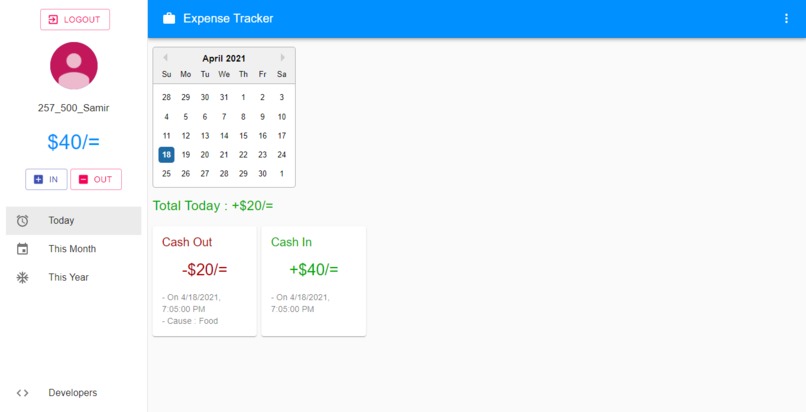
Dash Board
-
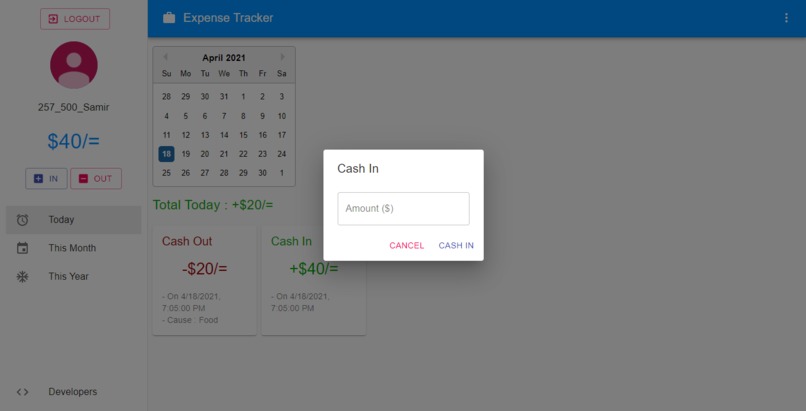
Cash in
-
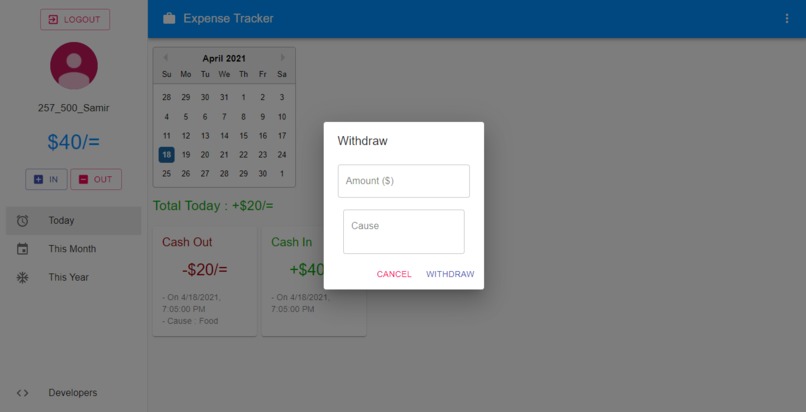
Cash Out
-
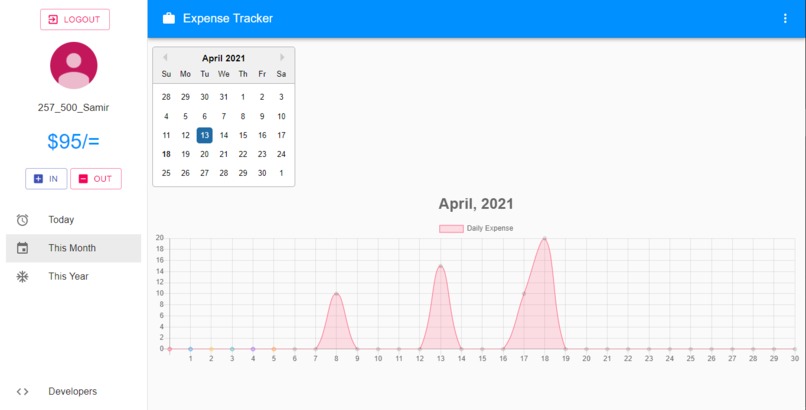
Daily Stat
-
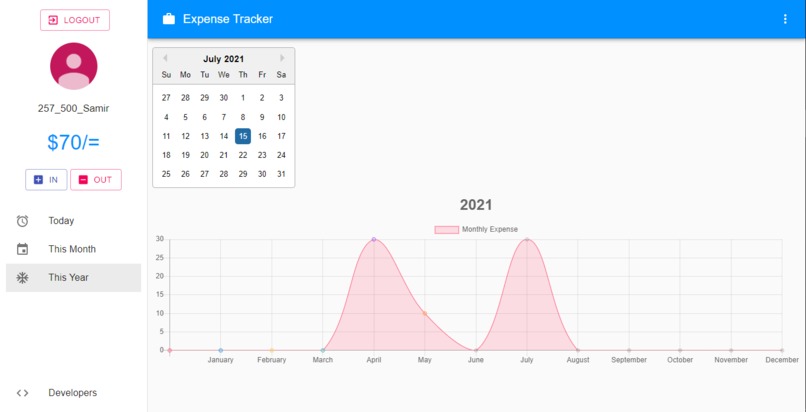
Monthly Stat


Inspiration
We waste a lot of money only for not knowing where the money is going. So for making some savings we need to keep track of our daily and monthly expenses. This web app will help people in this case.
What it does
It is actually a web app where a user can create his account with the help of google authentication. One can track his/her money on daily basis. If one gets some money from somewhere he/she can save it by the cash-in option which will be instantly shown in his/her dashboard. On the other hand, if the user spent some money for any purpose he/she can also save it using the cash-out option. This is how one can manage his/her savings. The savings from this month is automatically added to the next month. The cool feature of this app is one can see his/her stats by a line graph. One can track his/her daily as well as monthly expenses with the help of the graph.
How we built it
We built it with JavaScript frontend library react.js. We bootstrapped the project with npx create-react-app. We used material-ui for icons as well as responsiveness. We used react-toastify for showing toast. We used material-ui dialogue for showing fancy dialogue. We also used firebase for google authentication and real-time database. We used react-chartjs-2 for showing the line chart.
Challenges we ran into
Implementing a fully functional chart was the most challenging part. We did not work with charts before. We spent a lot of time researching. We could not make it real-time. After a long trial and error session, we finally made it fully functional.
Accomplishments that we're proud of
We made the whole app fully responsive. We also made the chart fully functional and those are the things fully functional. We didn't use git before so it took a lot of time to research and cope up with this.
What we learned
We learned React.js as well as firebase. We also learned how to use react-toastify and react-chartjs-2. For the first time, we use git for collaborating.
What's next for Expense Tracker
We will add more functionality like a bar chart, pi chart, etc in the next version.


Log in or sign up for Devpost to join the conversation.