Expense Anomaly Detector
Problem Statement
Managing personal finances can be tricky, unusual, or unexpectedly high expenses often go unnoticed until it’s too late.
We need a way to automatically detect anomalies in daily spending to help people take control of their expenses.
Solution
This project applies algorithmic anomaly detection to personal expense data.
We use two approaches:
- Statistical Rule → An expense is flagged if it is above
mean + 2 × std deviation. - AI/ML (K-Means Clustering) → Expenses are grouped into clusters (low, medium, high). The cluster with the highest average spending is treated as anomalous.
This combination allows us to detect both obvious and hidden spending anomalies.
Features
- Synthetic dataset generator
- Dual anomaly detection:
- Statistical threshold
- K-Means clustering (AI)
- Statistical threshold
- Visual anomaly highlighting with Matplotlib.
Installation & Running
1. Clone the repo
2. Install dependencies
pip install -r requirements.txt
3. Run the program
Example Output
Statistical anomalies (sample):
          date                 category  amount  stat_anomaly  cluster  kmeans_anomaly
69  2024-01-30        Shopping  261.60             True        0           False
175 2024-03-15        Shopping  563.44             True        1            True
221 2024-04-03       Shopping  313.84              True        0           False
377 2024-06-06      Entertainment  370.40     True        0           False
390 2024-06-11        Bills  904.75                      True        1            True

K-Means anomalies (sample):
          date               category  amount  stat_anomaly  cluster  kmeans_anomaly
175 2024-03-15      Shopping  563.44          True            1            True
390 2024-06-11     Bills  904.75                    True            1            True
455 2024-07-10     Shopping  862.02          True            1            True
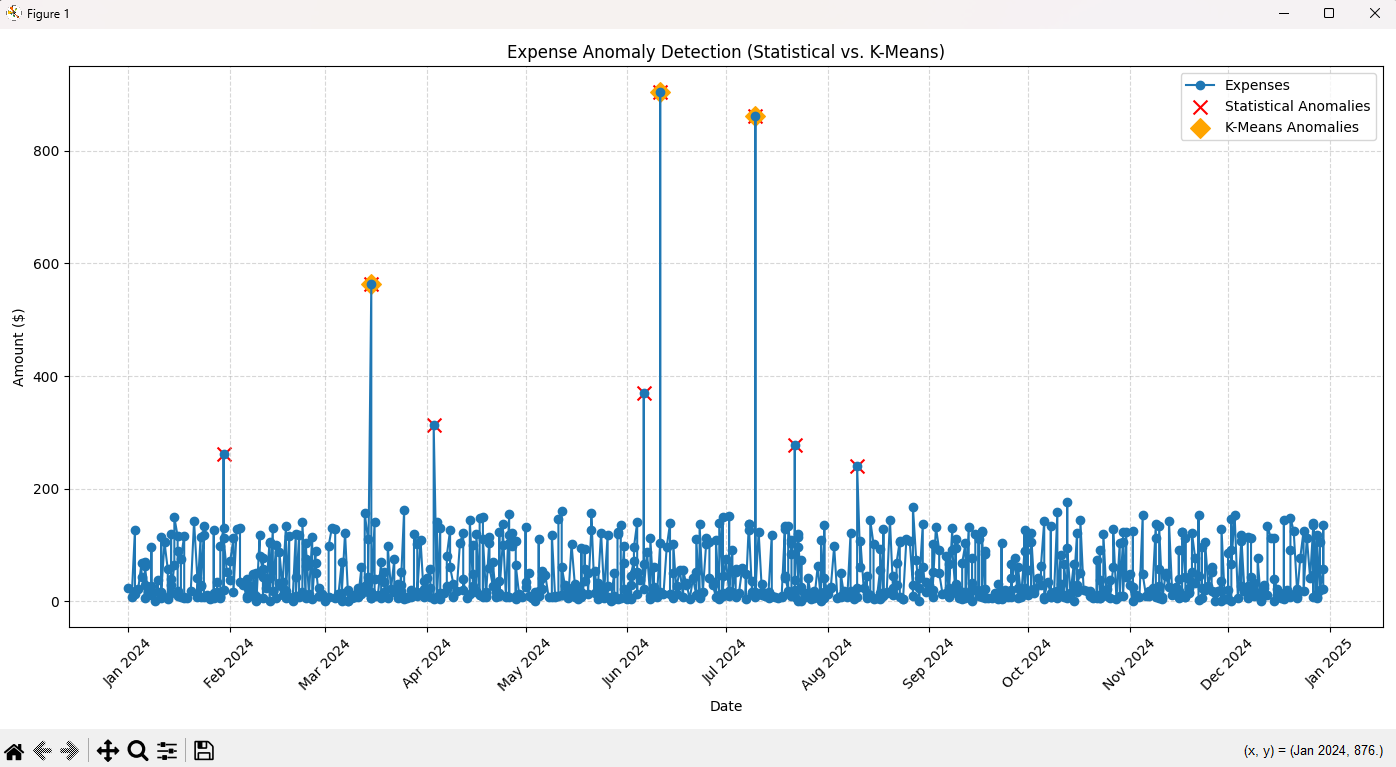
Graph
- Blue line → Normal expenses over time
- Red ❌ → Statistical anomalies
- Orange 🔶 → K-Means anomalies

Built With
- matplotlib
- pandas
- python
- scikit-learn

Log in or sign up for Devpost to join the conversation.