-
-

team Clesmor :)
-
How to find the best spot?
-
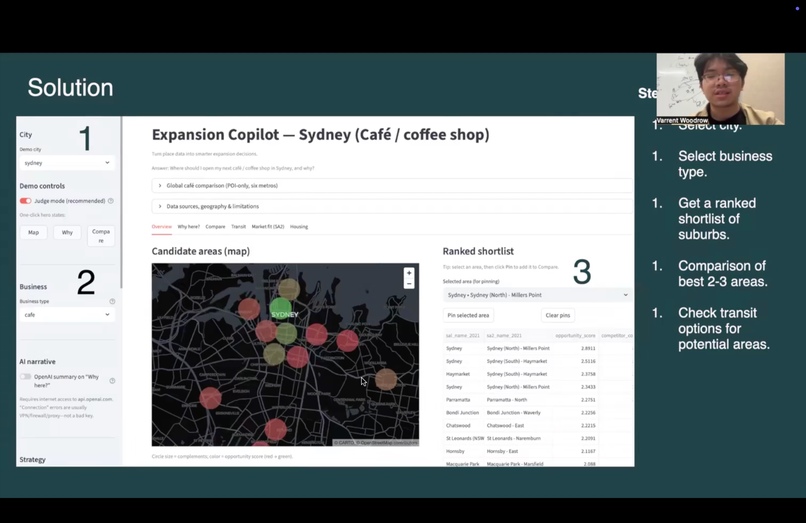
Our solution
-

Meet Alex!
-

Our team Captain...


Inspiration
Opening a hospitality business is high stakes: fit‑out, equipment, rent, and wages add up fast, and many operators sign leases with personal guarantees—so “going in blind” can put both the business and personal assets at risk. Industry stats point to food services as a high‑closure segment, and research consistently flags weak market research and underestimating competition among drivers of failure.
Meanwhile, location intelligence that enterprises use is often priced out of reach for independent operators. Our team wanted to explore whether open place data and a transparent, repeatable scoring model could give a founder like Alex—a commerce graduate planning a student‑focused café—a defensible, data‑backed way to compare markets and shortlist neighborhoods before signing a lease.
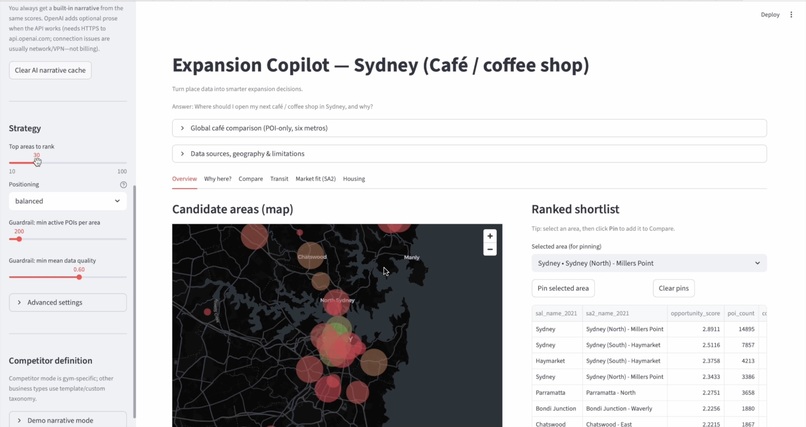
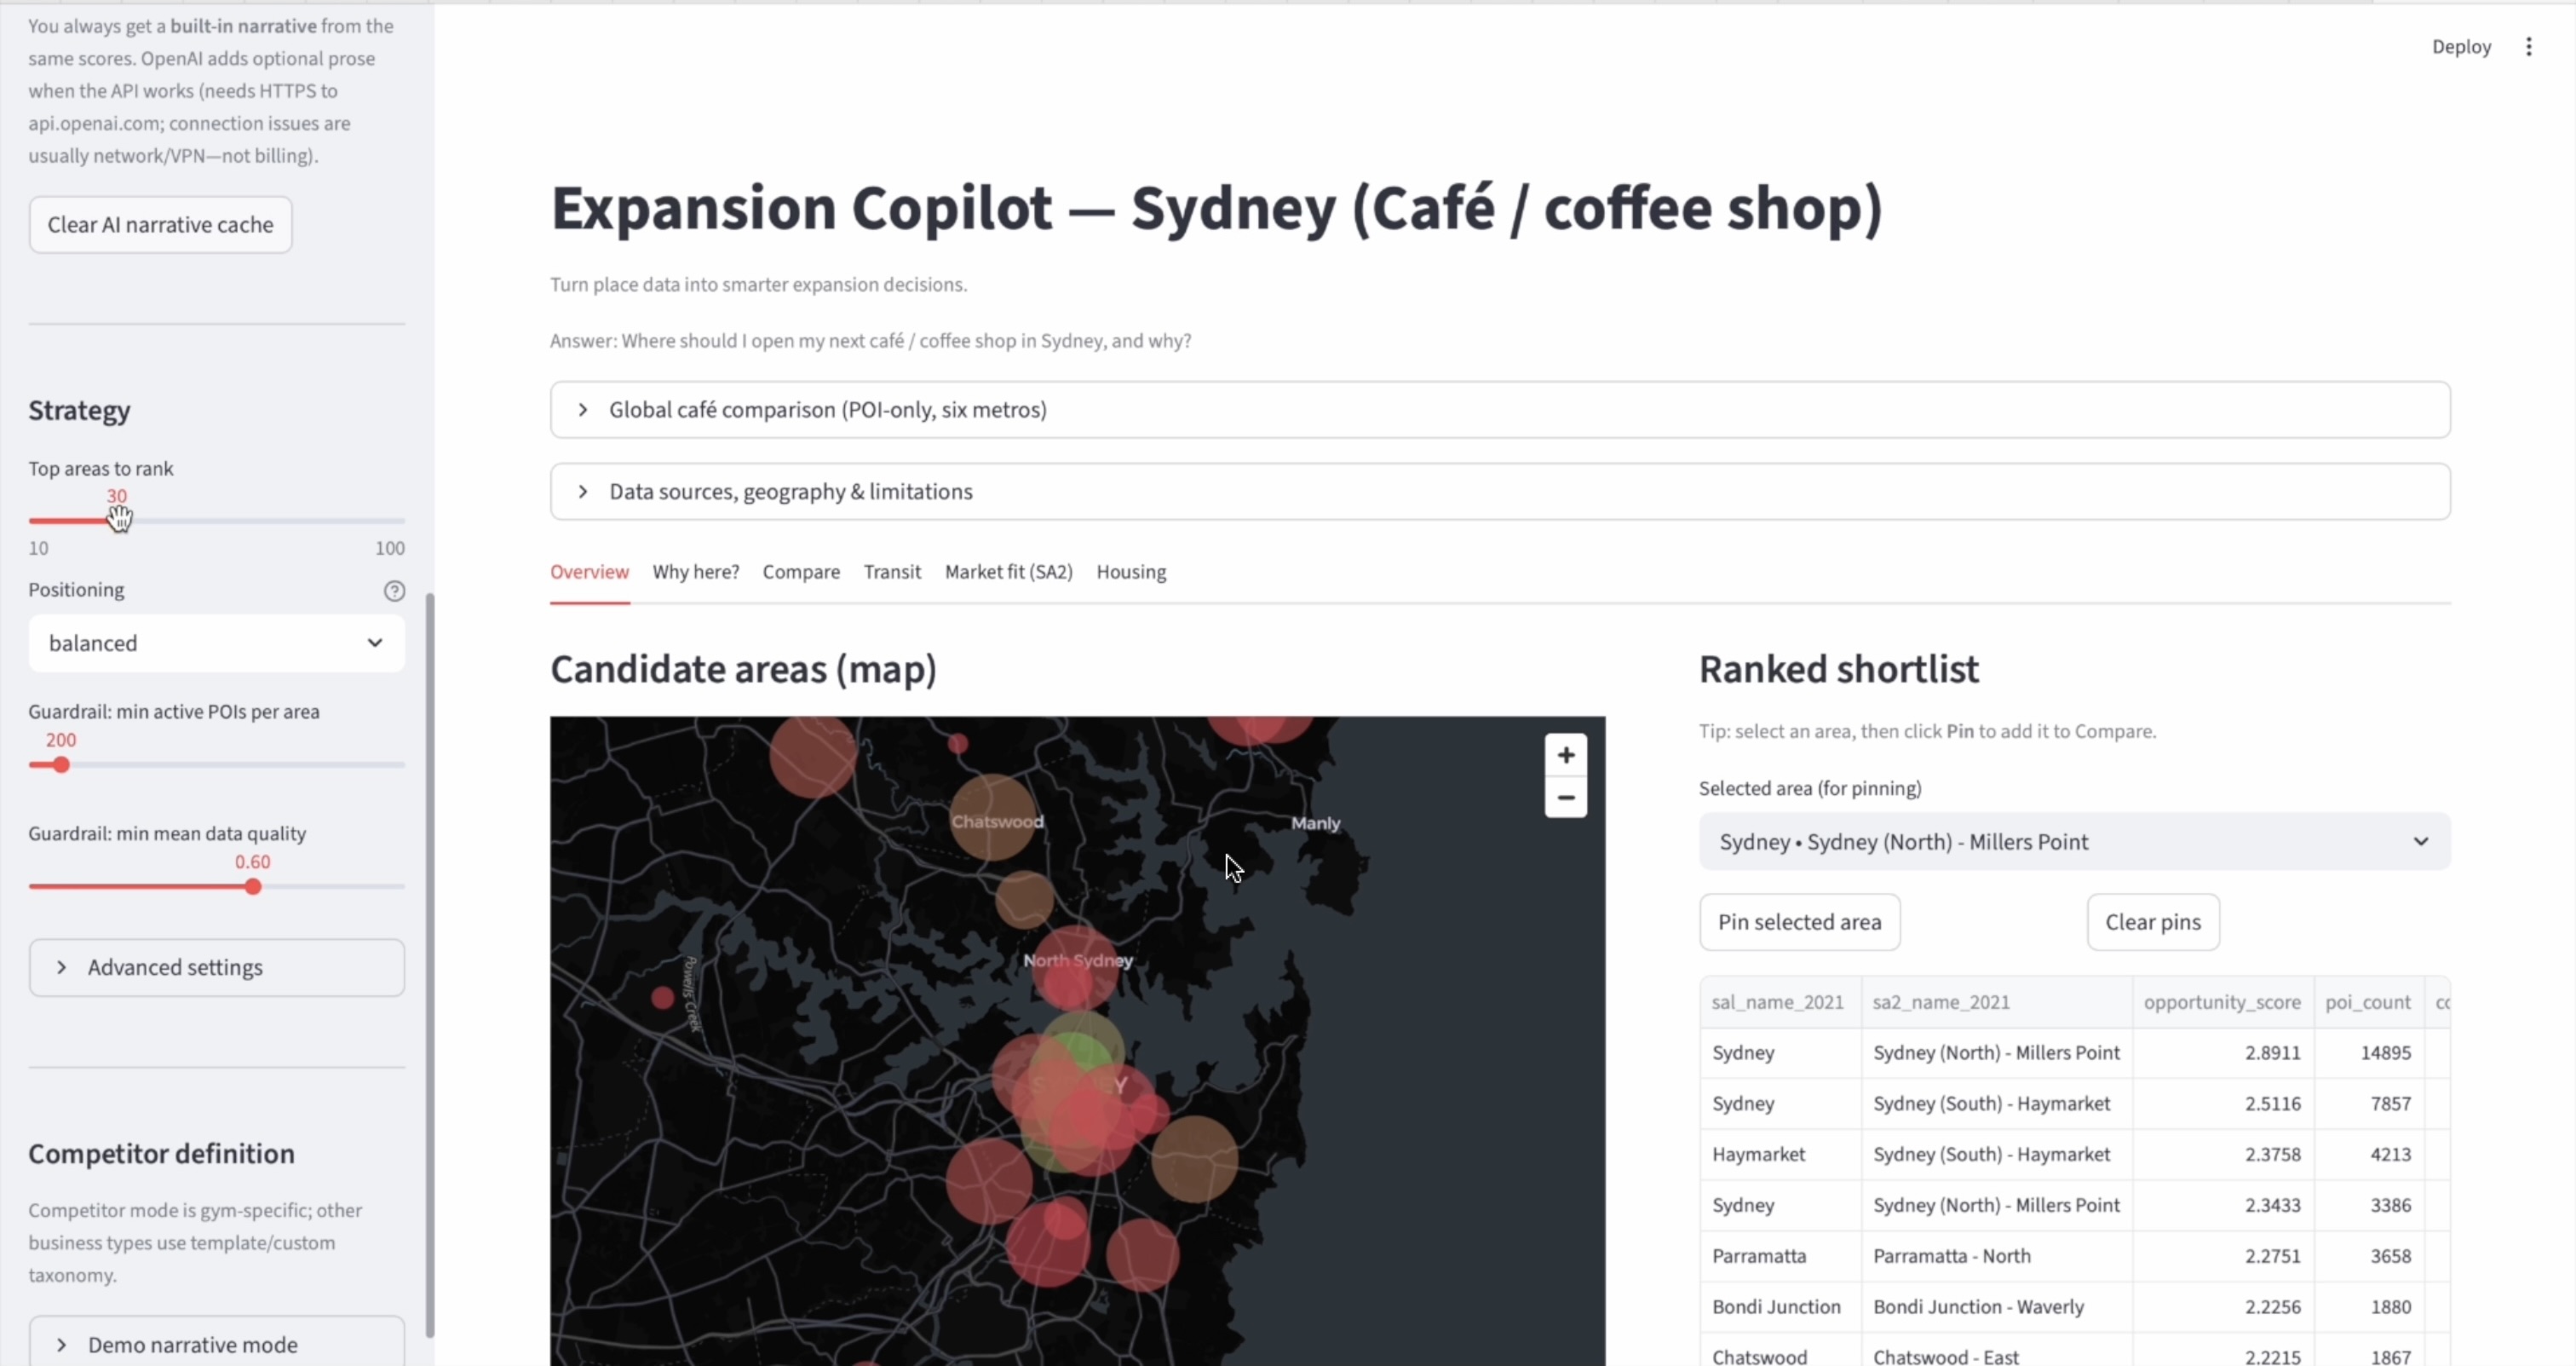
What we built
Expansion Copilot is a Streamlit demo that turns open POI (Points of Interest) data into:
- Ranked candidate areas (H3 hex cells) for expansion decisions
- Explainable scores with visible components (competition, complements, activity proxies, data quality, and—where data exists—transit proximity and SA2‑level market/rent proxies)
- Maps and comparison views to review and export a shortlist
- A global café comparison workflow that applies the same taxonomy and scoring across multiple metros for apples‑to‑apples market contrast
- “Why here?” narratives: a deterministic, rule‑based story always available from the same metrics, plus optional OpenAI enrichment when an API key is configured
The goal is not to predict revenue—it’s decision support: make trade‑offs visible, comparable, and auditable.
How we built it
- Data engineering: Python + Polars pipelines over open POI extracts; category mapping with careful handling of duplicates; H3 aggregation for scalable geography; optional enrichment layers (e.g. open transport points, SA2 market/rent proxies where built for a city).
- Scoring: A transparent opportunity scaffold—normalized inputs and weighted contributions—so users can see what moved the score (not a single opaque number).
- Application: Streamlit UI + PyDeck maps; full metrics tables so important fields (e.g. transit score and raw counts) aren’t hidden; CSV export for handoff.
- Reliability: OpenAI is optional; we added robust handling for quota/network issues and a built‑in narrative fallback so demos don’t fail when the API is unavailable.
Challenges
- Explainability vs. simplicity: Showing enough detail for judges and power users without overwhelming first‑time viewers—solved with headline KPIs plus an expandable “complete metrics” view aligned to the dataset.
- API reality: OpenAI 429 / quota and local connectivity issues—we separated error types, added retry/cache controls, and ensured offline narratives still match the numbers.
- Multi‑metro fairness: Cities differ in auxiliary datasets; we kept the core POI + scoring comparable and documented what’s optional per metro.
What we learned
- Trust comes from transparency: Users engage when they can trace inputs → components → final score.
- Demos must be resilient: Judges remember a working flow; graceful degradation beats a blank screen.
- Open data is powerful but messy: Invest in taxonomy, deduplication, and clear geographic units (H3 + sensible fallbacks).
What’s next
- Validate signals against ground truth (sales, foot traffic samples, lease comps where available).
- Expand metro coverage and template packs (café, gym, clinic, etc.).
- Optional team workspaces and scenario saves for real expansion workflows.
Built With
- duckdb-(data-workflows)
- foursquare-open-source-places?style-poi-data
- h3
- hugging-face-hub-(dataset-fetch/bootstrap-for-global-demo)
- openai-api-(optional-narrative)
- polars
- pyarrow
- pydeck
- pytest
- python
- streamlit


Log in or sign up for Devpost to join the conversation.