-
-
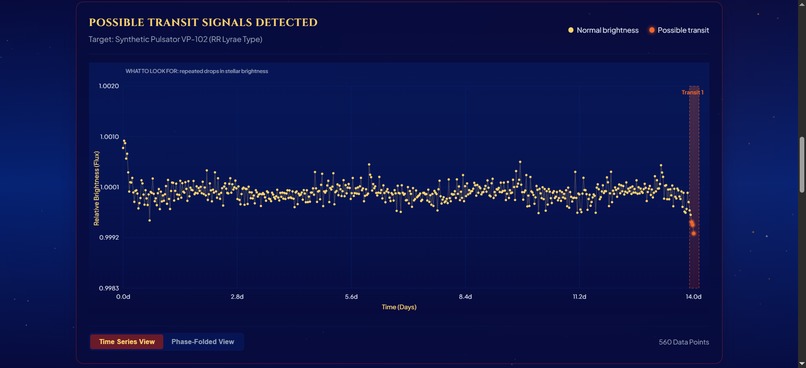
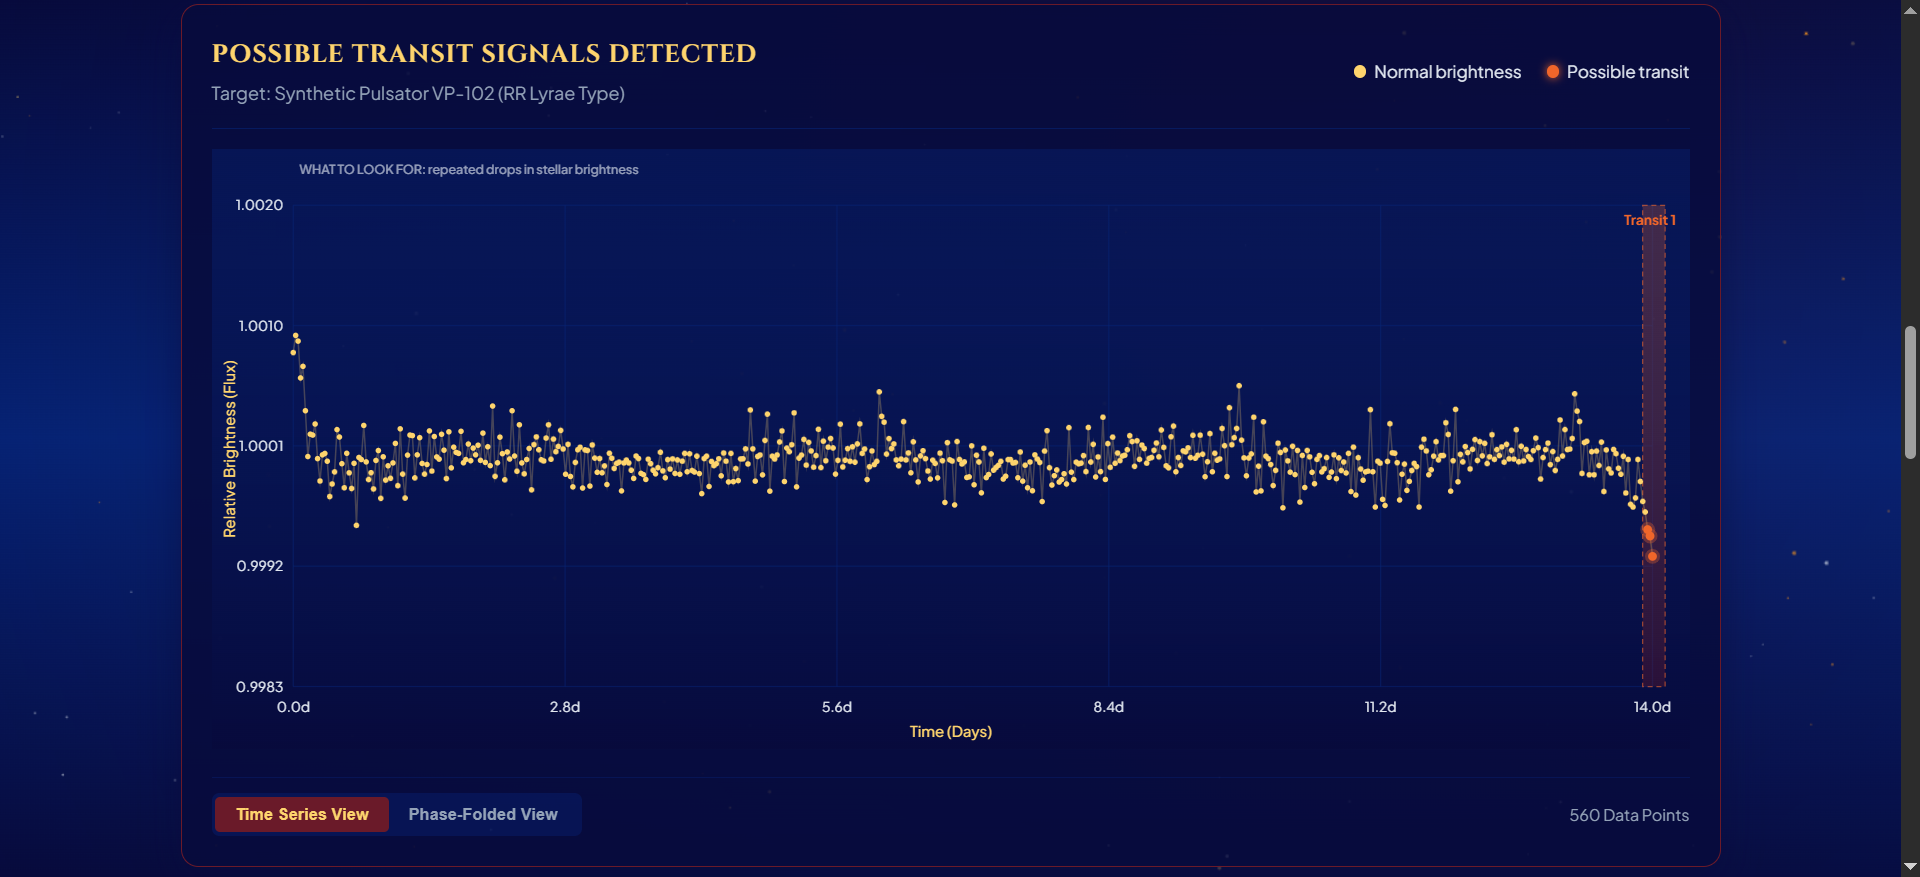
Variable star signal mistaken for a transit.
-
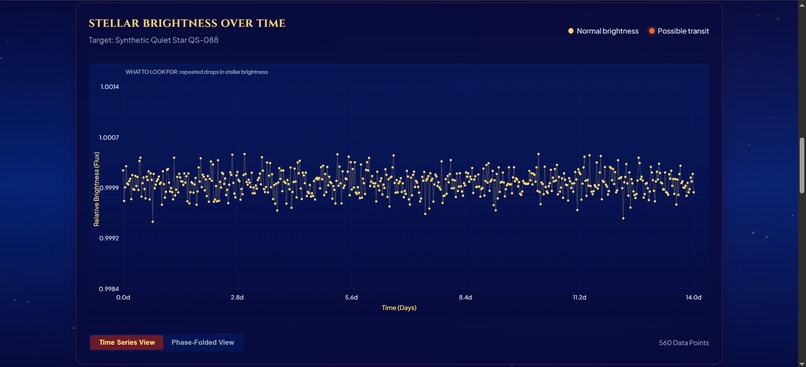
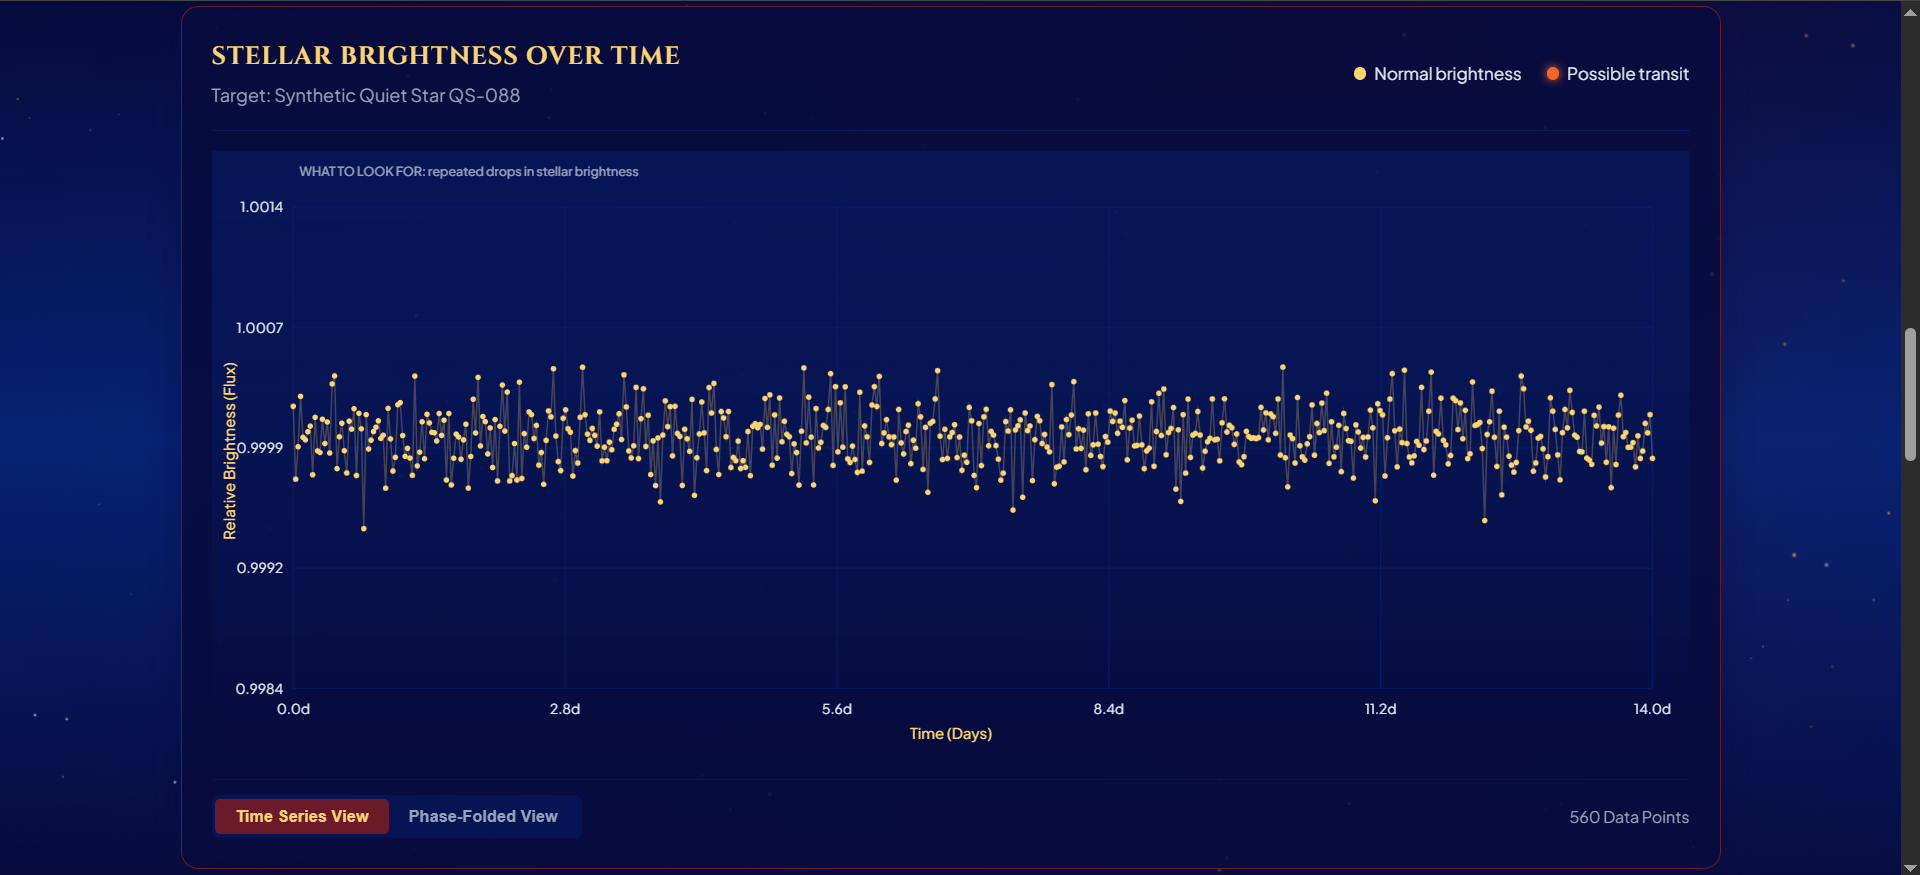
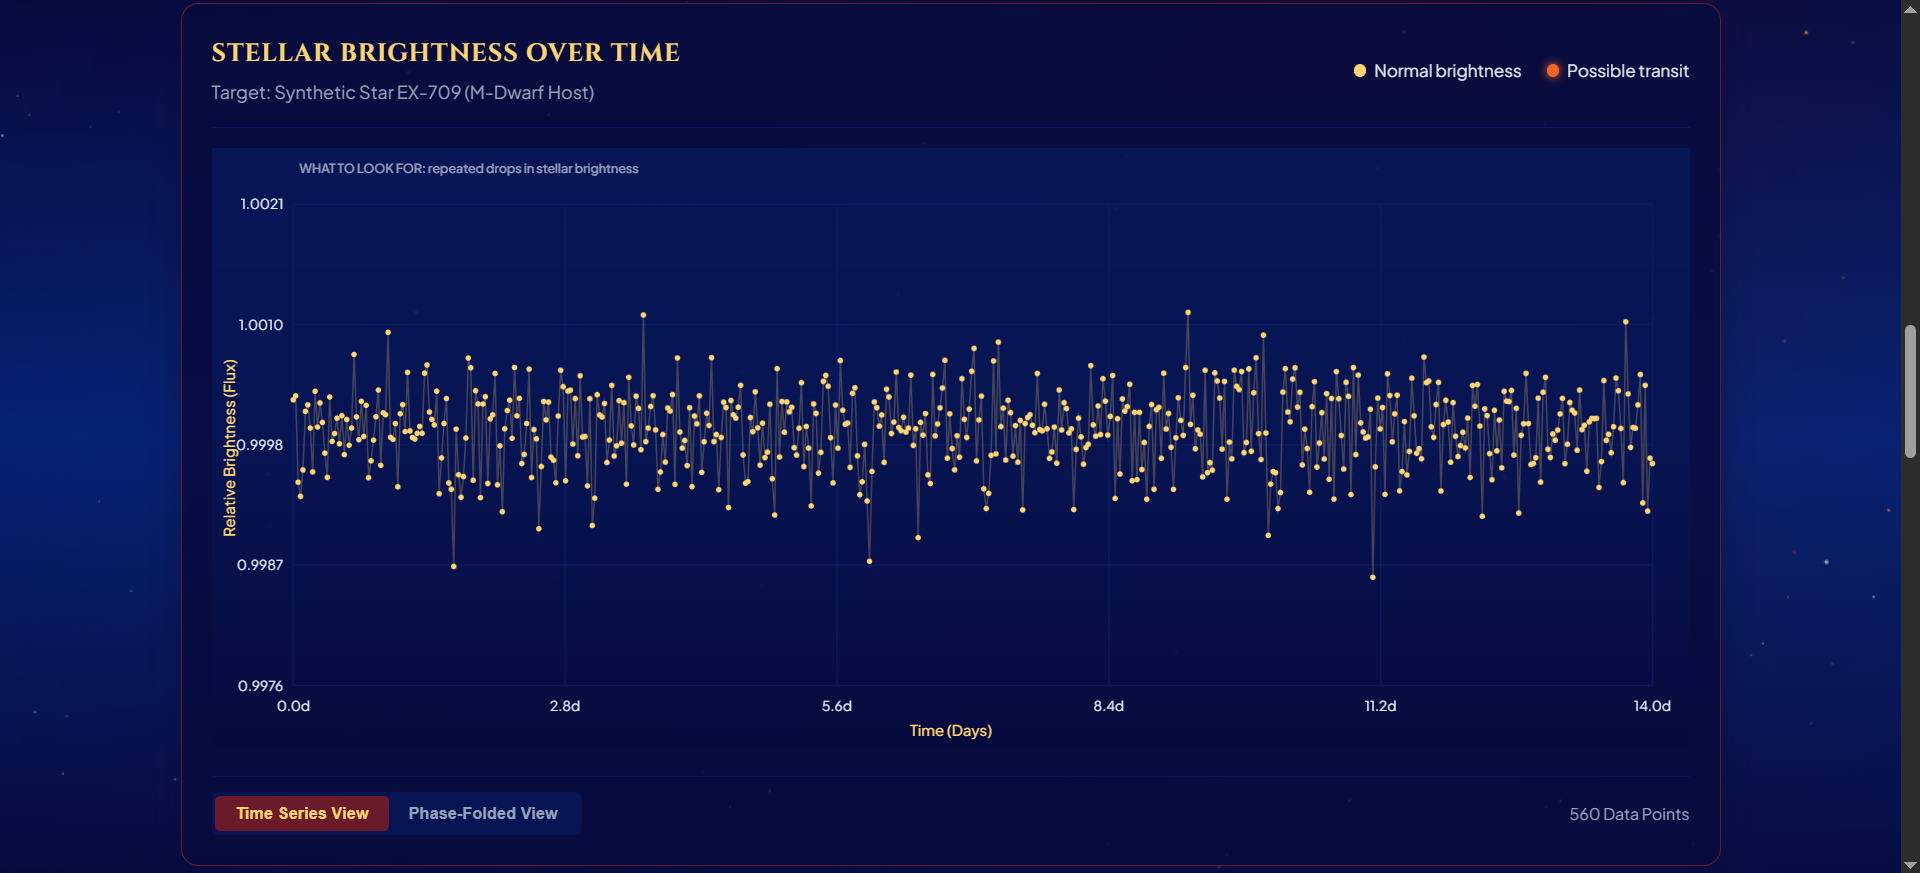
Baseline signal from a quiet star.
-
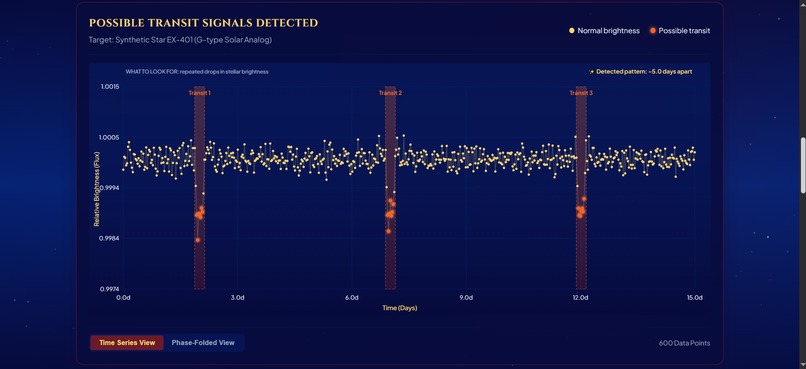
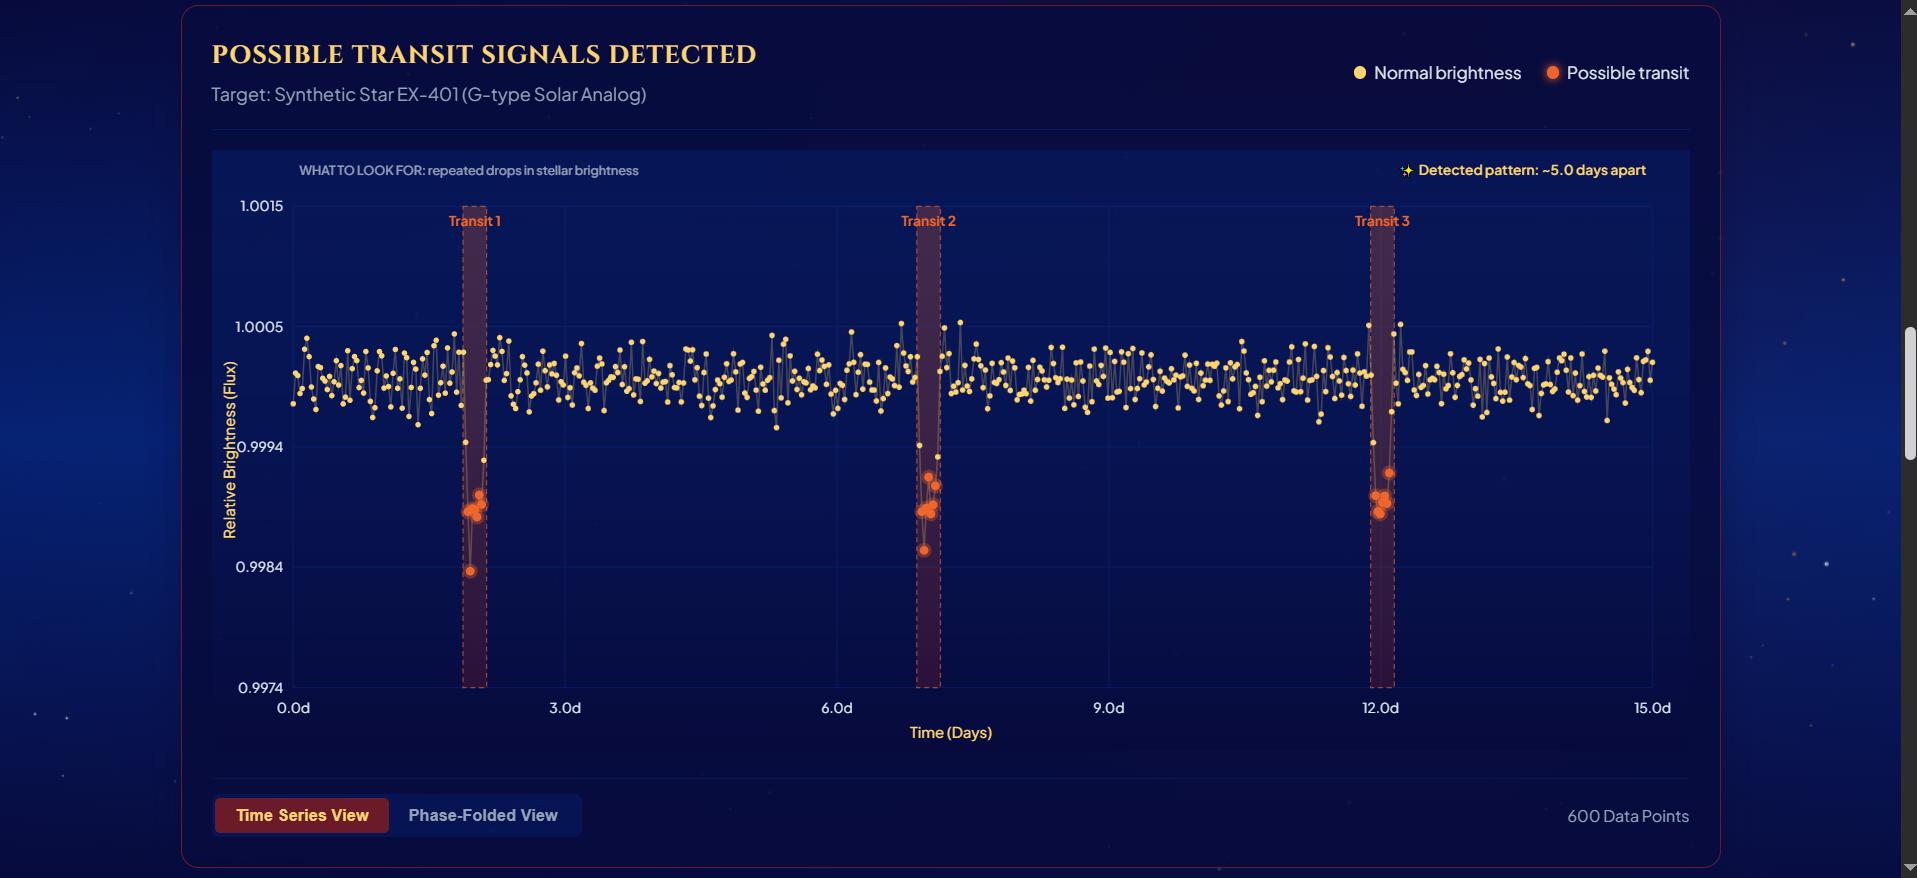
Example of clear planetary transit signal.
-
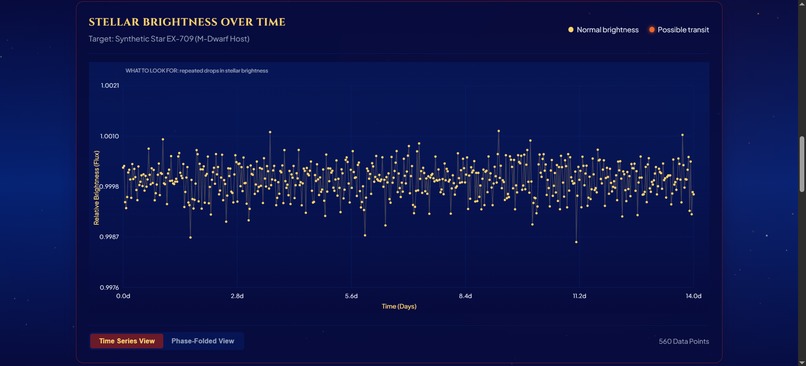
Light curve with only background noise.
-
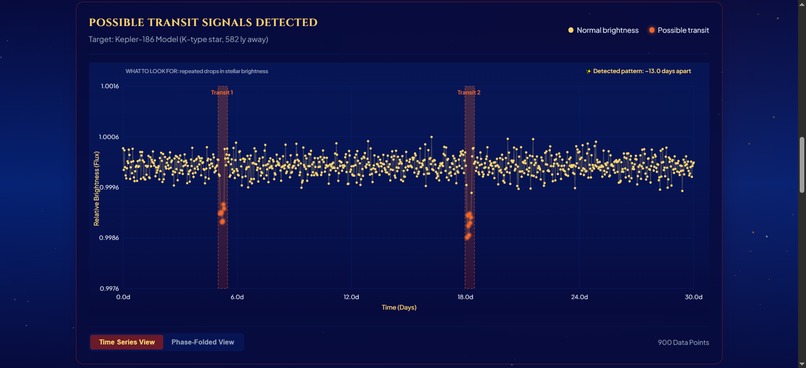
Analysis of a clear transit detection.
-
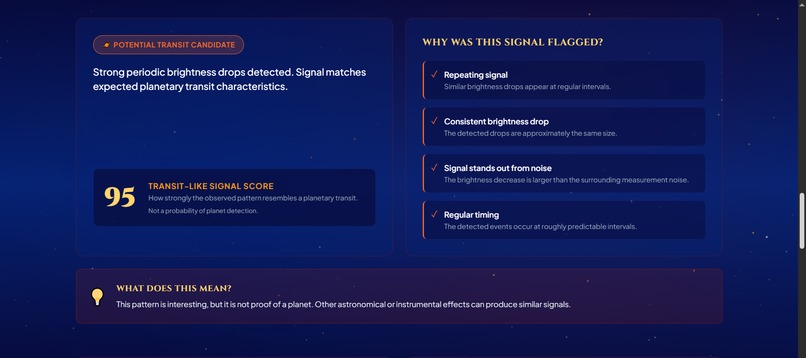
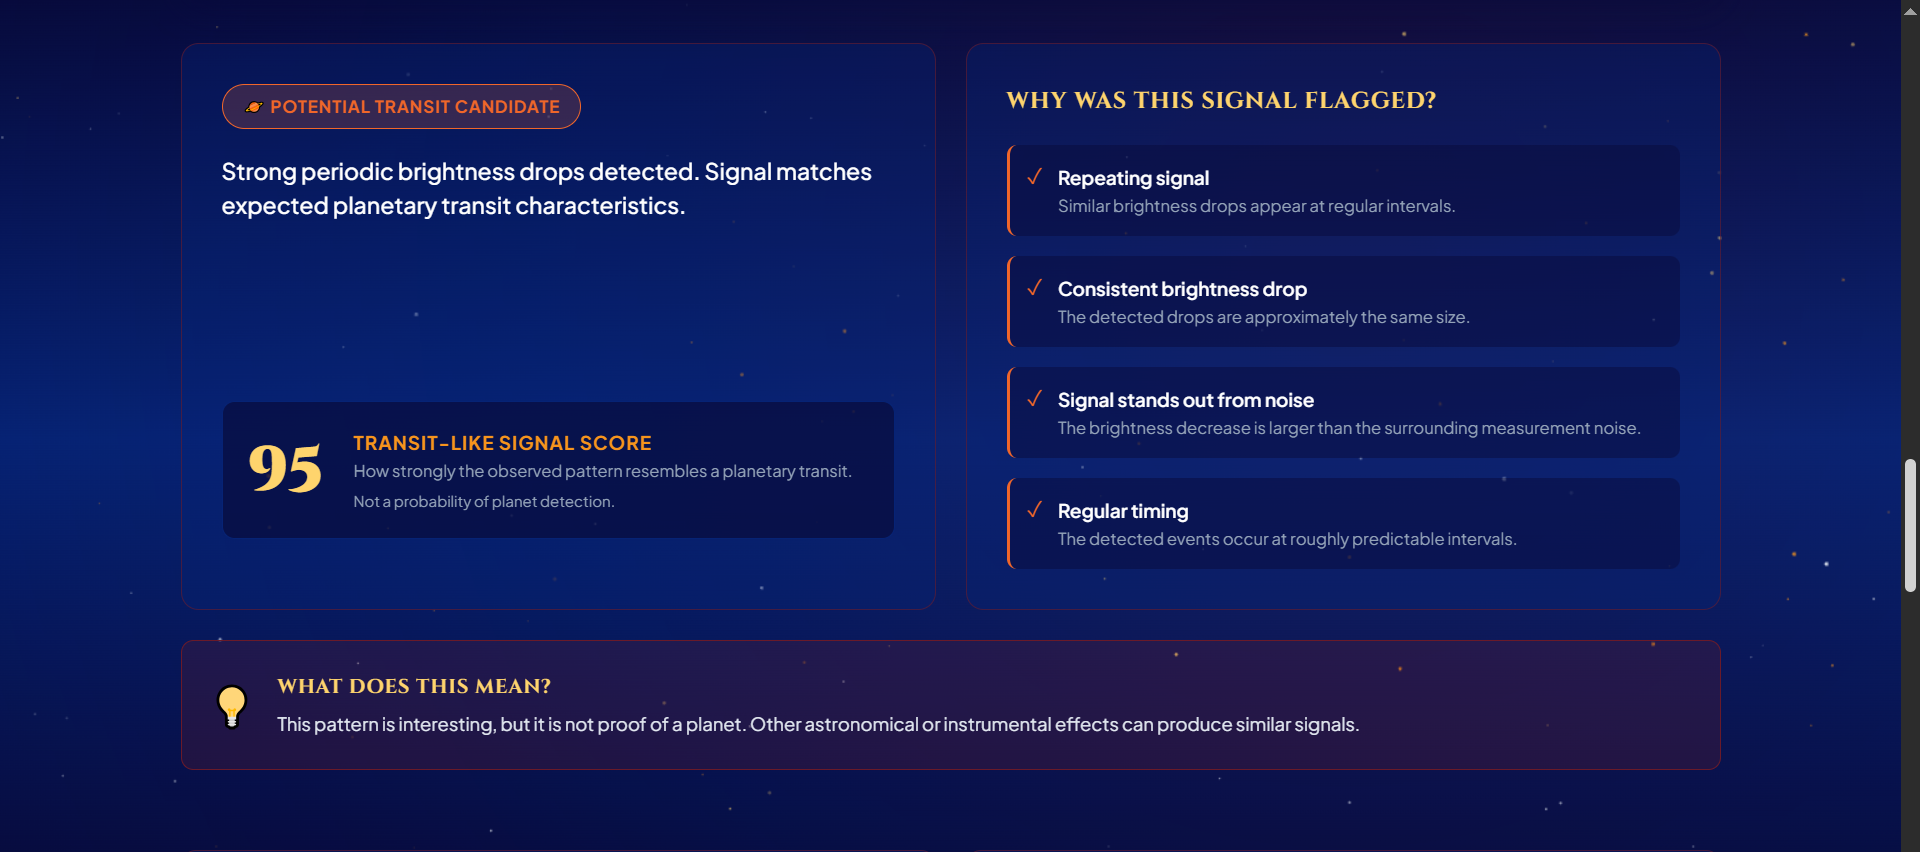
Evaluation of a potential transit candidate.
-
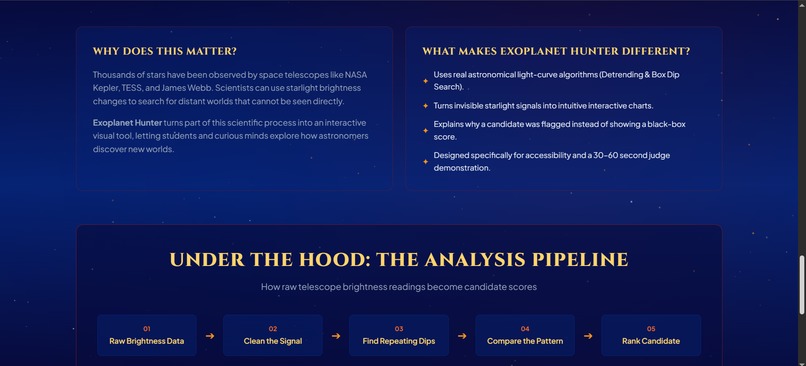
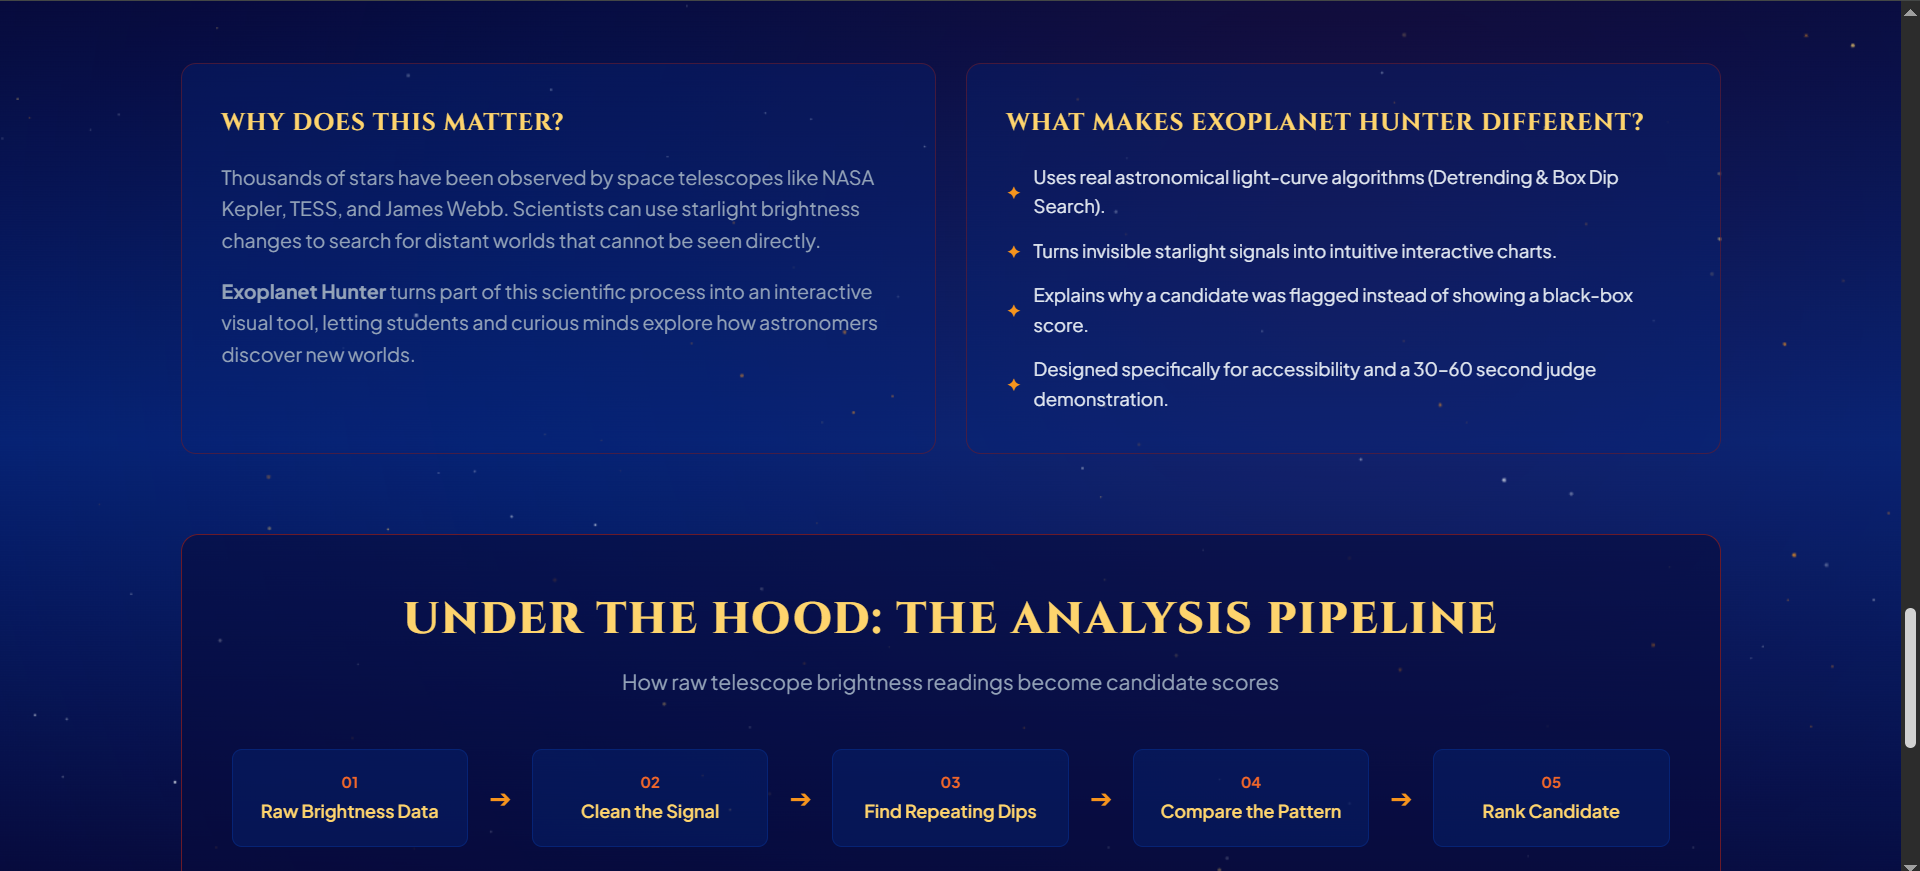
Exoplanet Hunter value and technical pipeline.
-
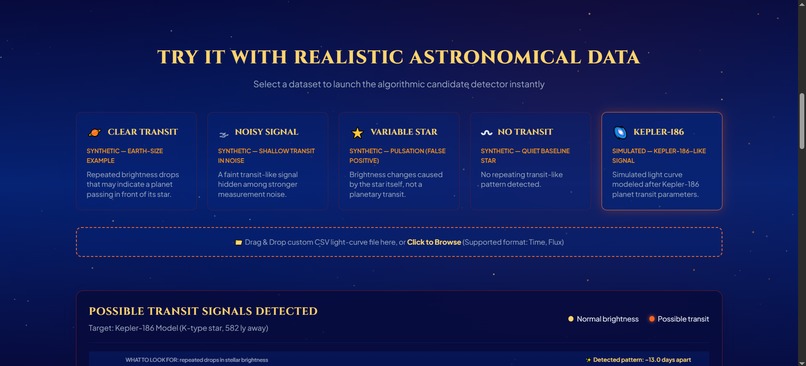
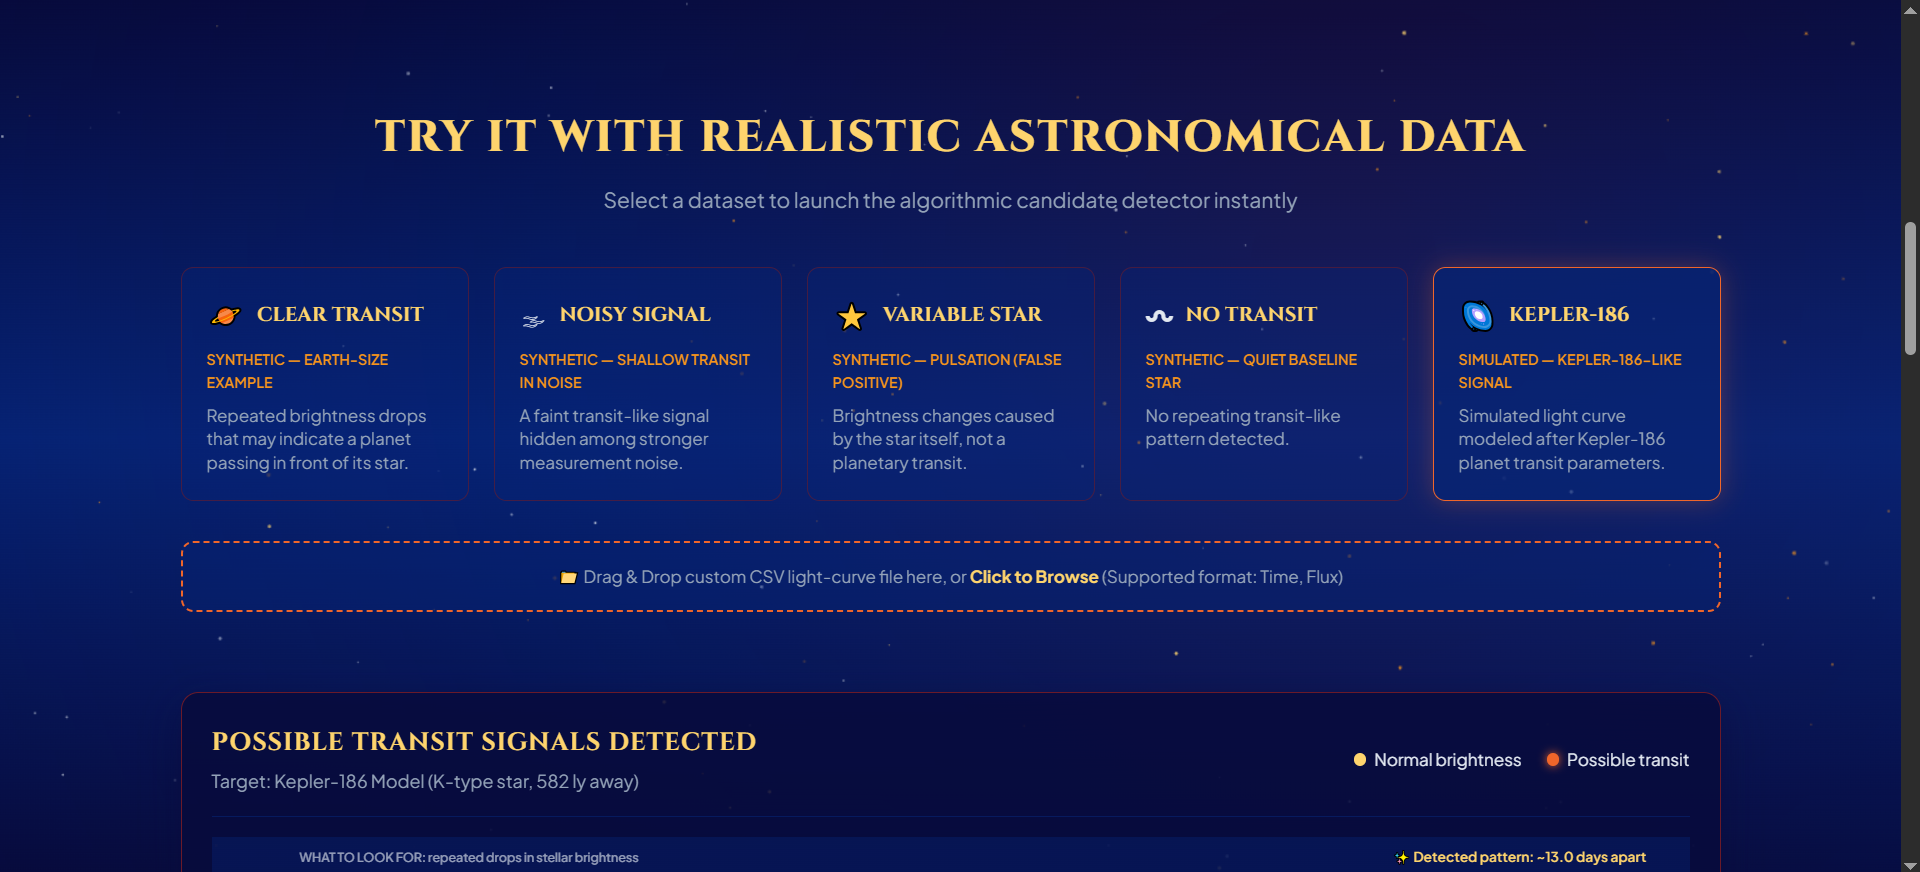
Data selection for transit analysis.
-
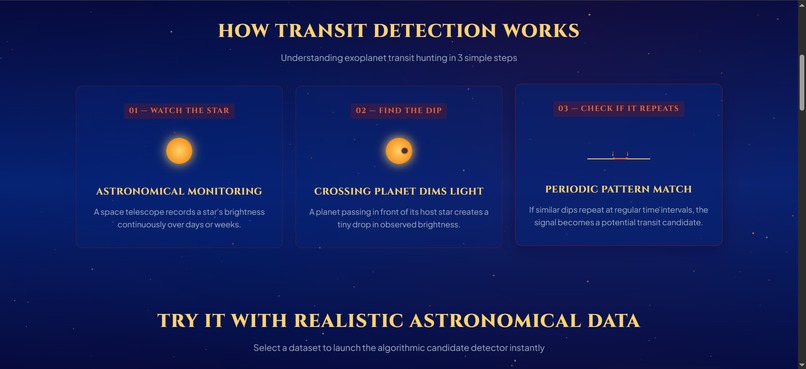
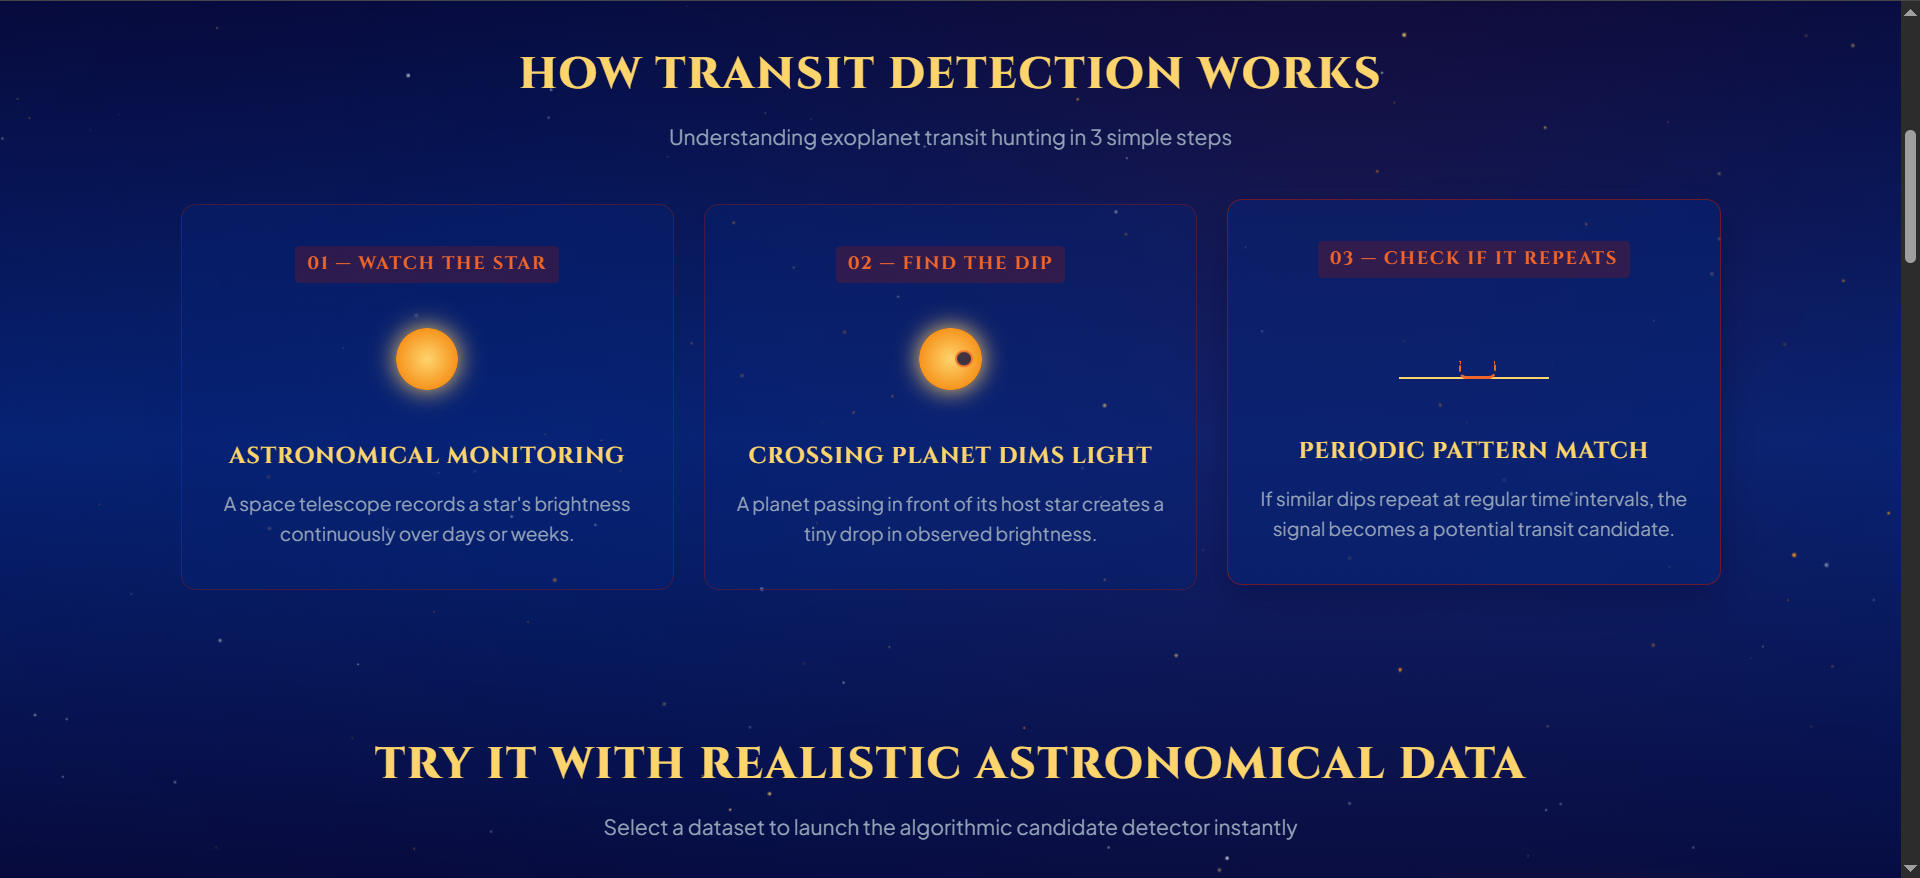
Overview of the transit detection method.
-
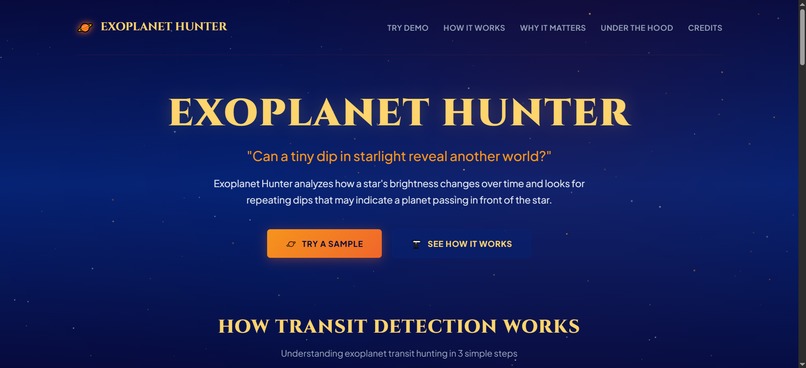
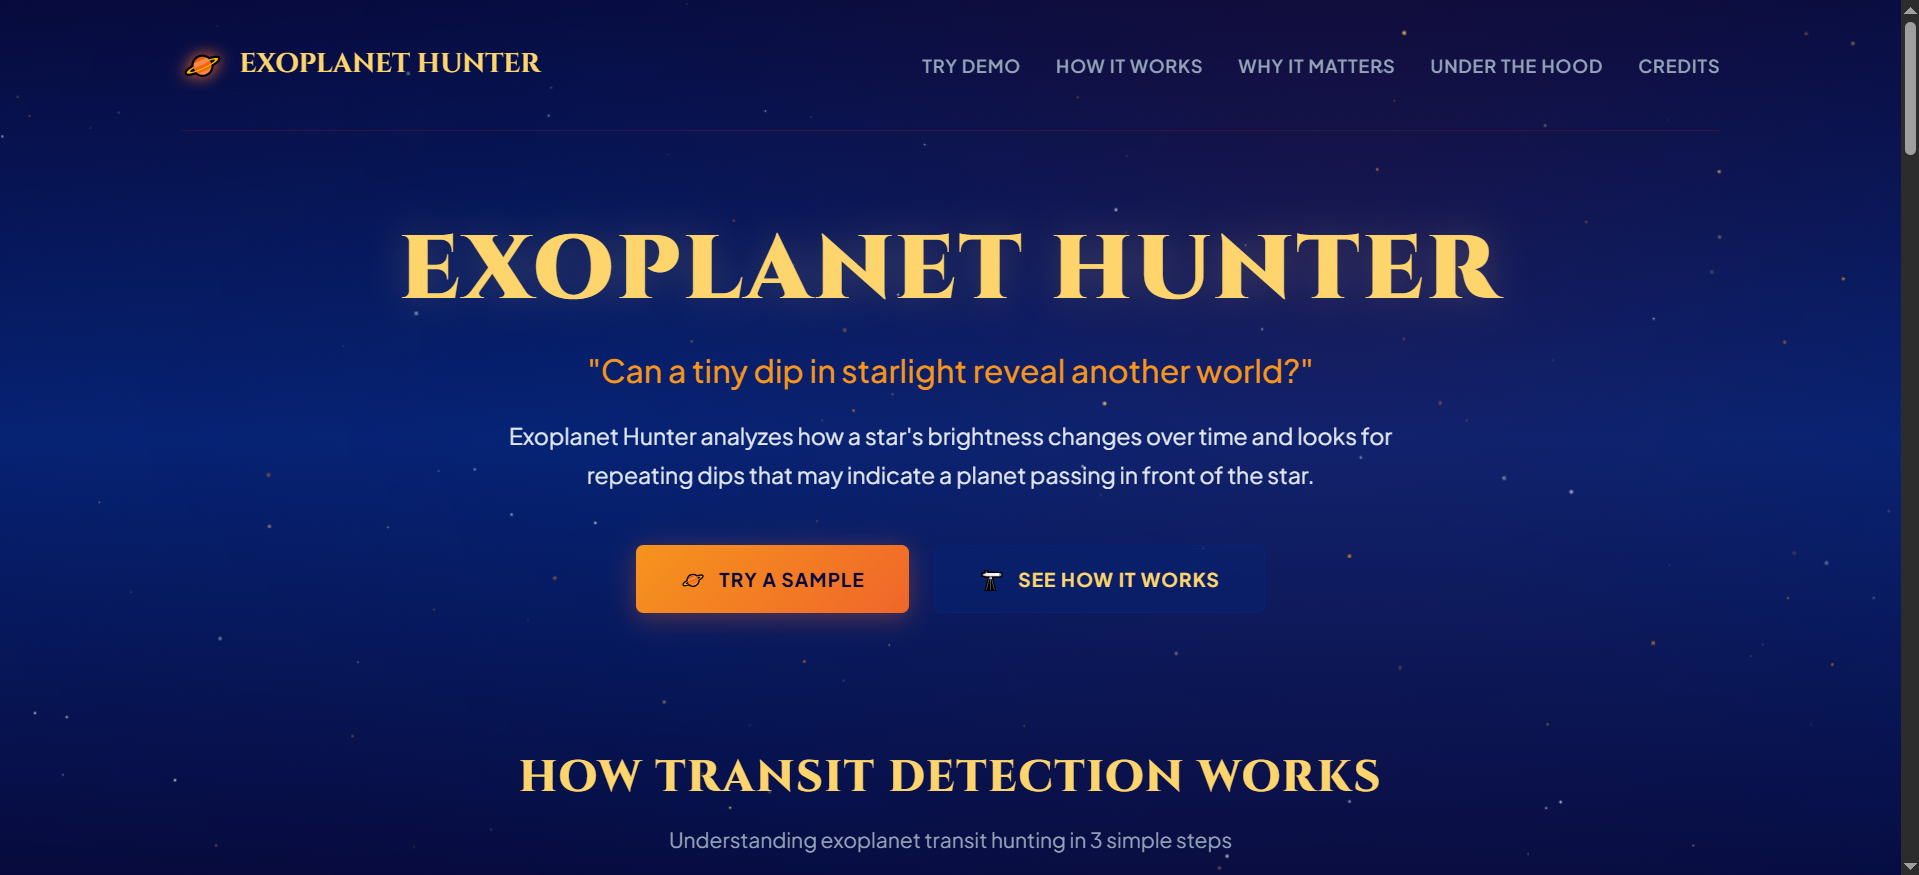
Home page of Exoplanet Hunter website.
Inspiration
Ever since I learned about space missions like NASA’s Kepler and TESS, I’ve been fascinated by how astronomers find planets light-years away. When a planet passes directly in front of its host star, it blocks a tiny fraction of starlight—an event called an astronomical transit.
However, when I tried looking into actual light-curve data, I was met with thousands of intimidating raw floating-point numbers like (Time: 12.42d, Flux: 0.99882). Professional tools like Python’s Lightkurve are built for research scientists and require heavy programming experience. On the other hand, educational resources usually just show static, simplified diagrams.
I wanted to bridge this gap. I built Exoplanet Hunter for NGN Hacks 2026 to create an interactive, browser-based playground where students, physics learners, and space enthusiasts can load real starlight data, run custom signal-processing algorithms live in their browser, and see how astronomers separate genuine exoplanet signals from stellar noise.
What it does
Exoplanet Hunter turns raw, noisy starlight readings into an intuitive discovery experience:
- 6-Step Signal Processing Pipeline: Automatically cleans raw light curves using moving-median detrending, sets $3\sigma$ thresholding to spot brightness drops, clusters contiguous dip points, and evaluates periodicity and geometric shape.
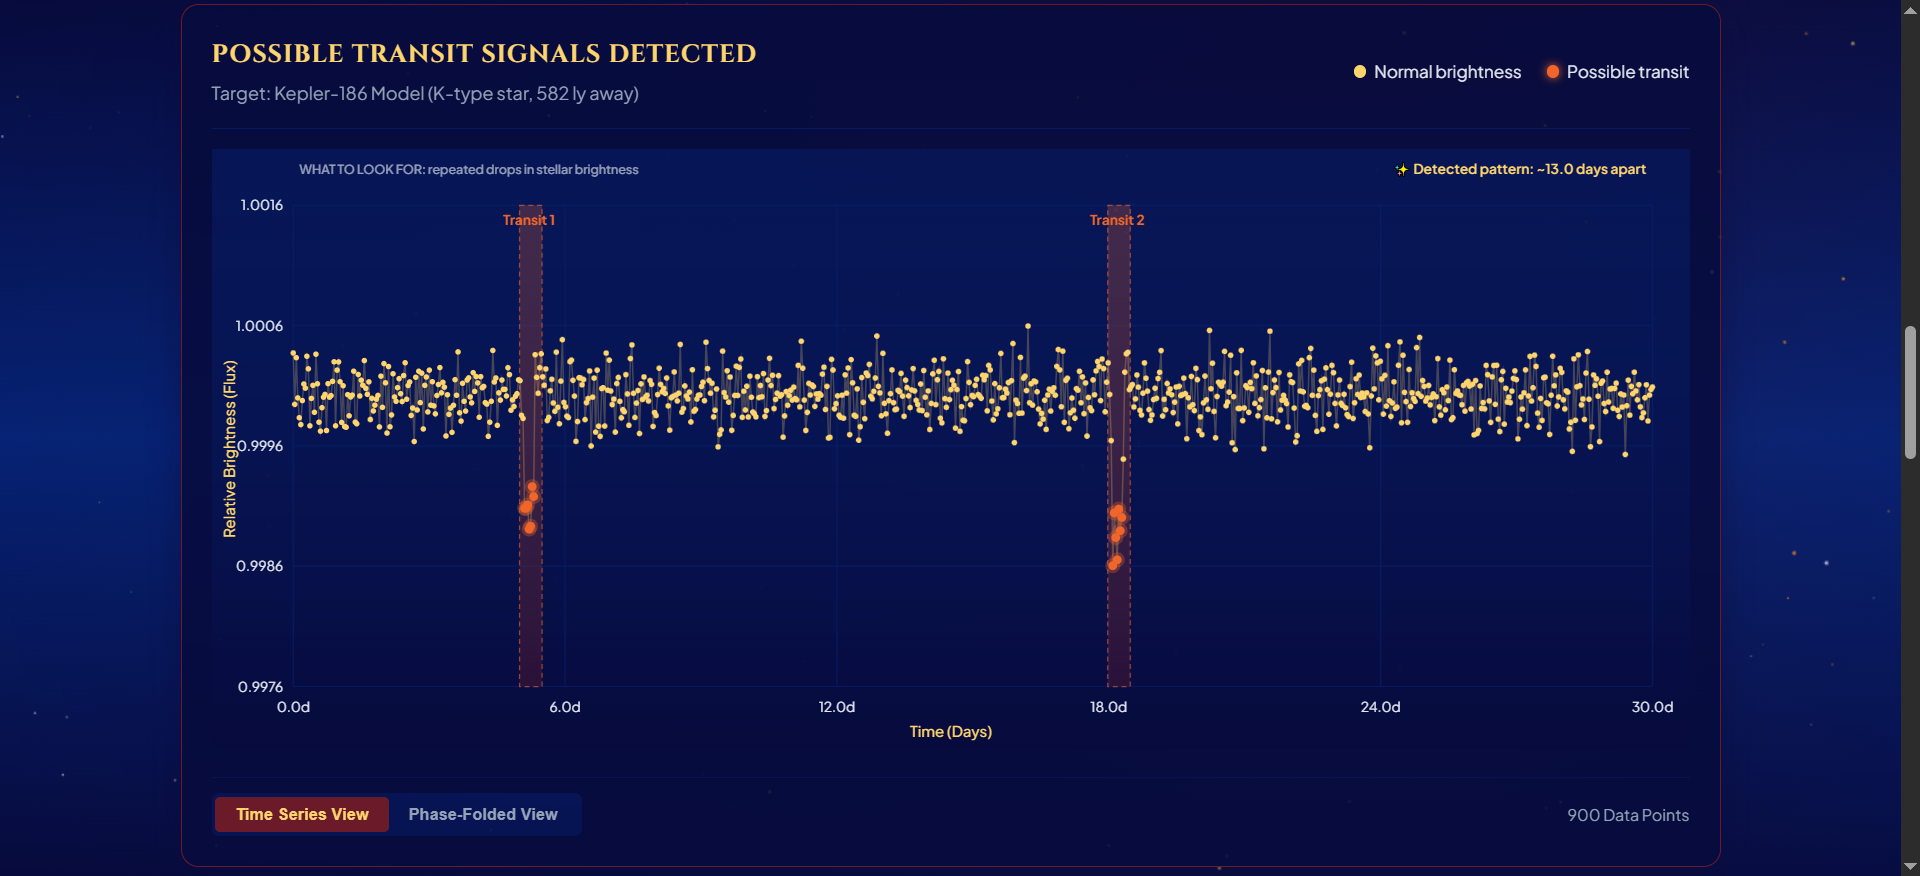
- Interactive HTML5 Canvas Visualization: Renders light curves smoothly with hover tooltips, highlighted transit zones (Transit 1, Transit 2, etc.), and allows users to toggle between a Time Series View and a Phase-Folded View (folded from $-0.5\phi$ to $+0.5\phi$).
- Candidate Signal Score (0–100): Calculates a deterministic resemblance score based on signal periodicity, depth consistency, and orbital duration physics.
- Plain-English Diagnostic Checklist: Translates complex mathematical parameters ($SNR$, $\sigma$) into 4 easy-to-understand evidence cards (e.g., ✓ Repeating signal, ✓ Consistent brightness drop).
- Preset Benchmarks & Custom CSV Upload: Includes 5 built-in astronomical datasets (synthetic transits, variable stars, noisy baseline, and simulated Kepler-186) to teach users about False Positives, plus a drag-and-drop CSV parser for custom user data.
How I built it
I built Exoplanet Hunter using a lightweight, pure client-side web stack to keep it fast, responsive, and accessible anywhere without backend dependencies:
- JavaScript (Vanilla ES6+): Wrote the custom data-cleaning detrending algorithms (
astronomical-engine.js), modular arithmetic for phase-folding, dip-clustering math, and CSV text parser. - HTML5 Canvas API: Built the custom high-performance light curve renderer (
lightcurve-chart.js) from scratch—handling HiDPI pixel scaling, grid lines, region highlight shading, and tooltip hover collision detection. Also built the animated interactive starfield background (starfield.js). - CSS3 (Vanilla CSS): Designed a deep-space visual theme using glassmorphism, responsive grids, and clean visual typography with Cinzel and Plus Jakarta Sans via Google Fonts.
Challenges I ran into
- Developing the Detrending Algorithm: Real starlight fluctuates naturally due to stellar rotation, spot activity, or telescope drift. Normalizing this baseline without erasing small planetary transits was tricky. I solved this by implementing a sliding moving-median filter (window size = 25 points) to smooth out baseline trends to a flat $1.0$ relative flux.
- Canvas Rendering & Hover Collision: Drawing hundreds of dynamic data points on HTML5 Canvas while maintaining high performance and precise hover tooltips required careful coordinate mapping and high-DPI canvas scaling math.
- Explaining Math in Plain English: Calculating signal-to-noise ratios ($SNR$) and variance ($\sigma^2$) is one thing, but converting those raw numbers into clear diagnostic statements that a high-school classmate could understand took several iterations of design refining.
Accomplishments that I'm proud of
- Building a Zero-Dependency Canvas Renderer: Created a smooth, fast, custom interactive chart engine purely with Vanilla JavaScript and HTML5 Canvas.
- Demonstrating False Positives: Successfully built sample datasets (like the Variable Star preset) that clearly show how smooth sinusoidal pulsating waves differ from sharp, flat-bottomed planetary U-shaped transits.
- Pure Client-Side Processing: The entire detection pipeline runs 100% locally in the user's browser in real-time without needing external API calls or server processing.
What I learned
- Astronomical Data Analysis: Gained a deep hands-on understanding of photometry, light-curve detrending, sigma-clipping noise removal, and orbital phase-folding math.
- Data Visualization Techniques: Learned how to transform complex, multi-dimensional numerical datasets into human-centered visual stories.
- Algorithmic Honesty: Realized the importance of distinguishing between deterministic signal-matching scores and true astronomical confirmation (which requires follow-up spectroscopy and radial-velocity checks).
What's next for Exoplanet Hunter
- Multi-Planet System Detection: Expand the algorithm to identify overlapping periodic dips caused by multi-planet star systems.
- Direct NASA Exoplanet Archive Integration: Fetch real TAP/ADQL light-curve datasets directly from NASA APIs.
- Exportable PDF Reports: Allow students and educators to download an automated scientific discovery report detailing their analyzed light curves and evidence cards.
Built With
- antigravity

Log in or sign up for Devpost to join the conversation.