Inspiration
Growing up, I loved space. And by love- I mean LOVE. I used to watch all the space videos I could on YouTube, from Black Holes to things about the Universe. I also deeply fell in love with Data Science. This project was an opportunity to combine both of my passions into something useful.
What it does
The project uses NASA's exoplanet data, and then further filters and analysis it to make comparisons, such as comparing the:
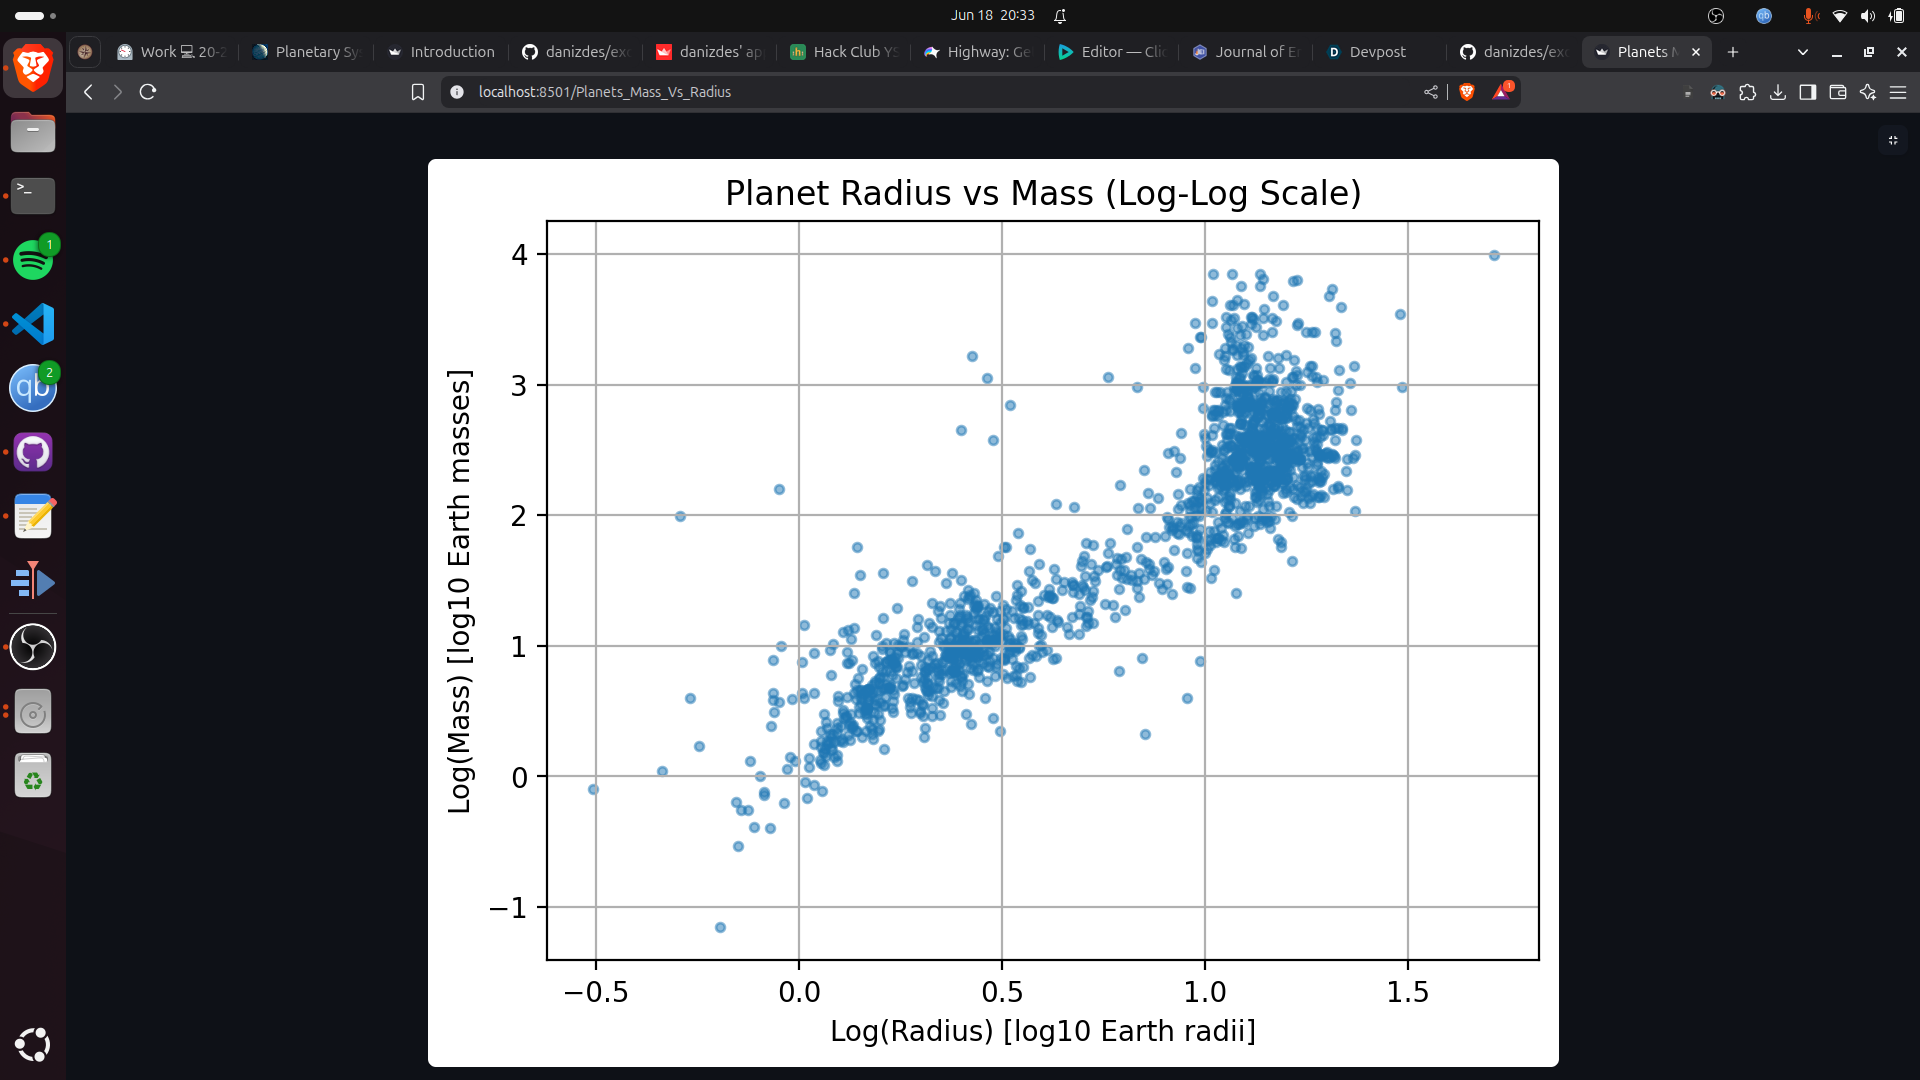
- Planets Mass (compared to earth) vs Planets Radius (compared to earth)
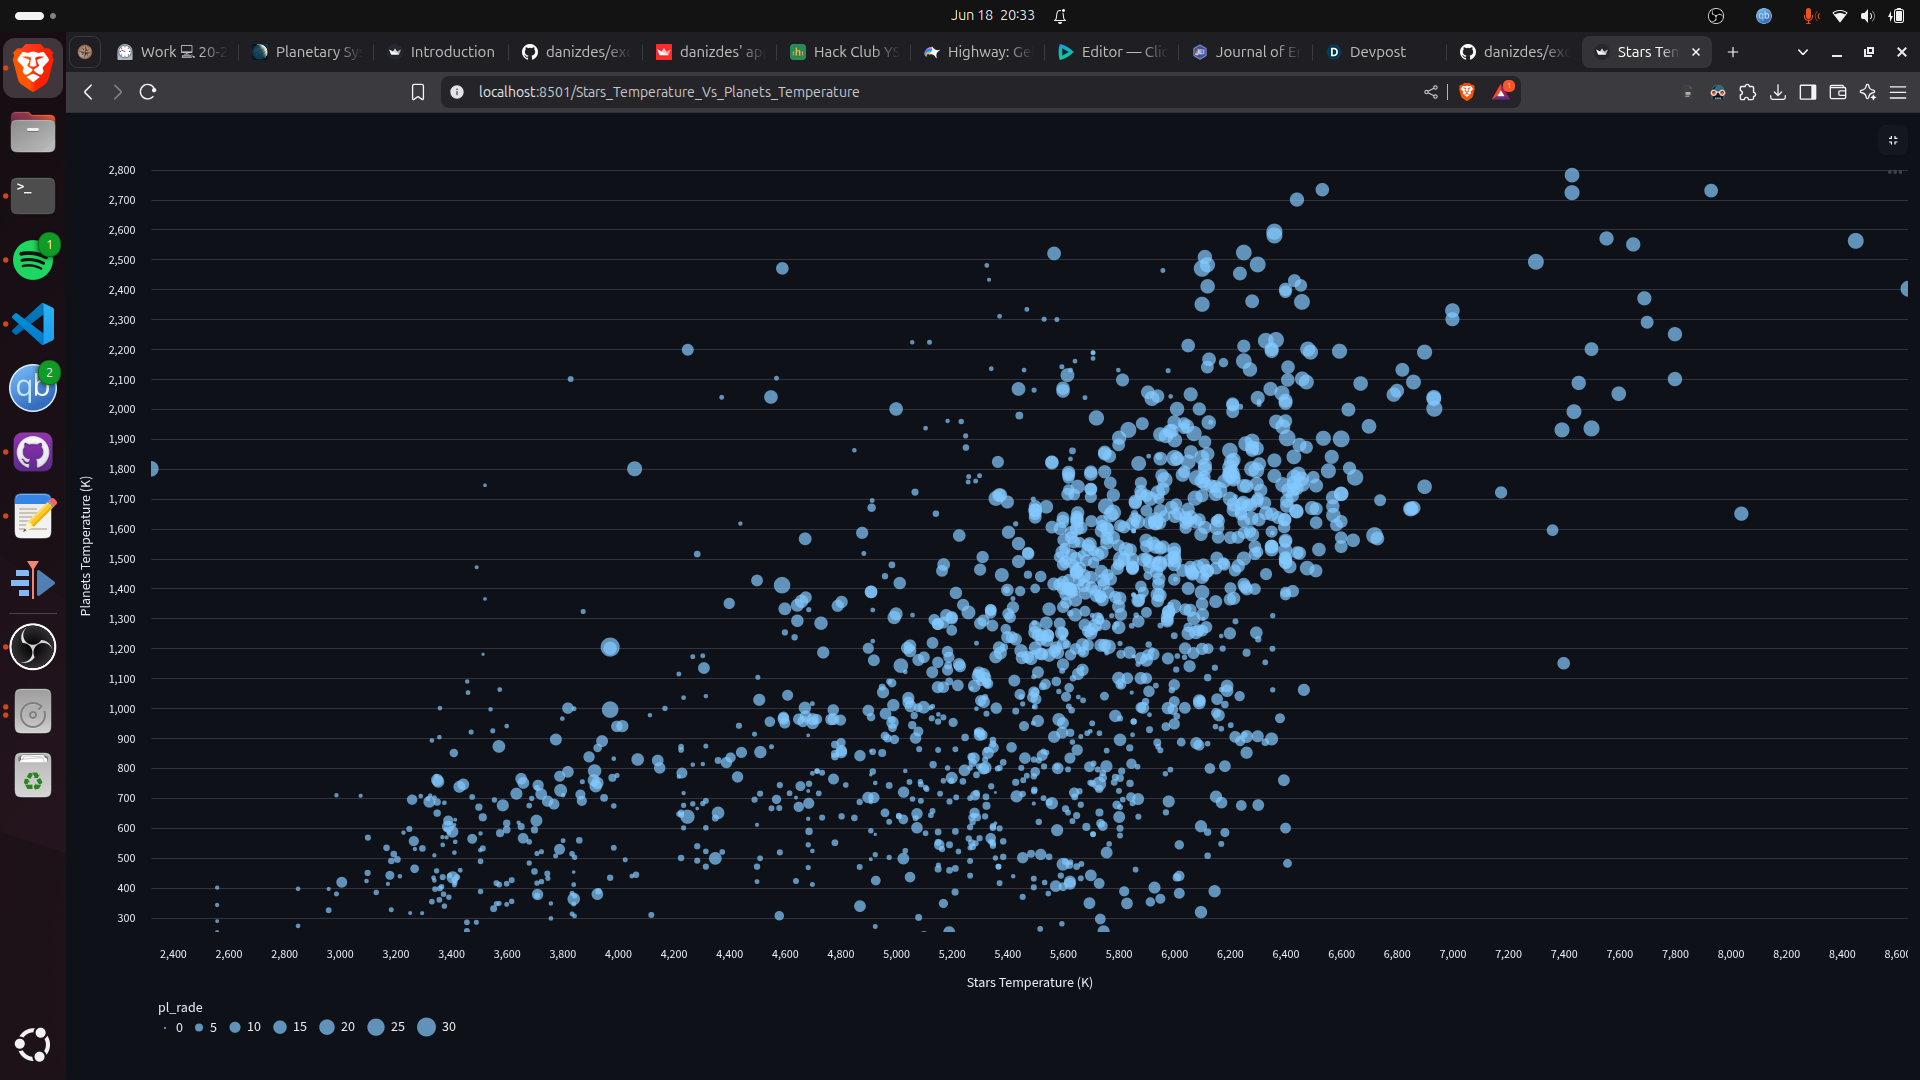
- Stars Temperature (in Kelvin) vs Planets Temperature (in Kelvin)
- Years by exoplanet discoveries
- Planets Radius (compared to earth) vs Planets Orbital Period
How we built it
I used Pandas & Numpy to effectively filter and analyse the data. We then used streamlit to display all the data beautifully in a web app. For more complex graphs, such as logarithmic ones, I used matplotlib to display them
Challenges we ran into
For some comparisons, I couldn't properly display the graph. After spending hours without any solution, I figured out we needed to use logarithmic graphs to effectively display the data
Accomplishments that we're proud of
I am personally very proud in how I handled the data, making appropriate graphs to see relationships and then also finding out the relationships between different properties from the graphs themselves.
What we learned
I have all effectively honed my skills in all the above mentioned frameworks. On top of that I have also learned how to bring them together and use them properly to build something big.
What's next for Exoplanet-analysis
If I win the .xyz domain award, I plan on self hosting the web application on my raspberry pi with the .xyz domain. I also plan on comparing more properties of these planets in the future. And possible even publish a research paper with a testable hypothesis.

Log in or sign up for Devpost to join the conversation.