-
-
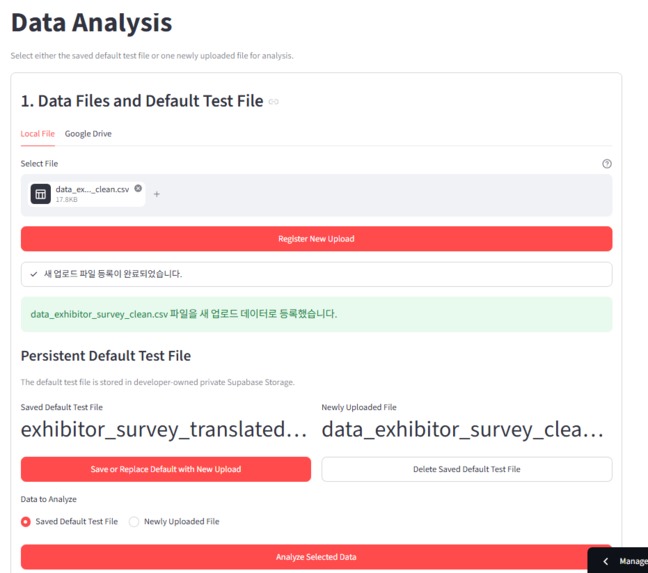
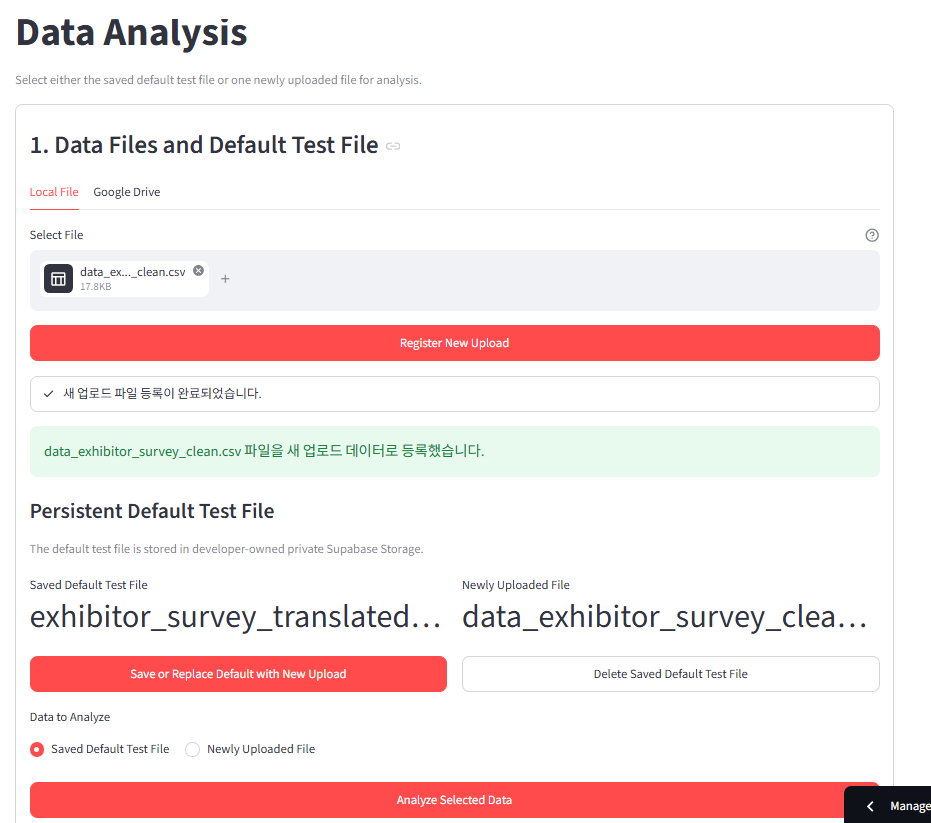
Data Load
-
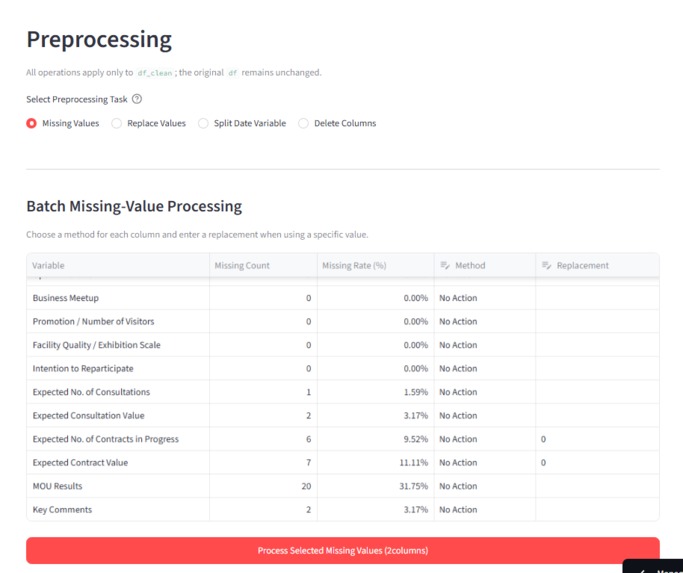
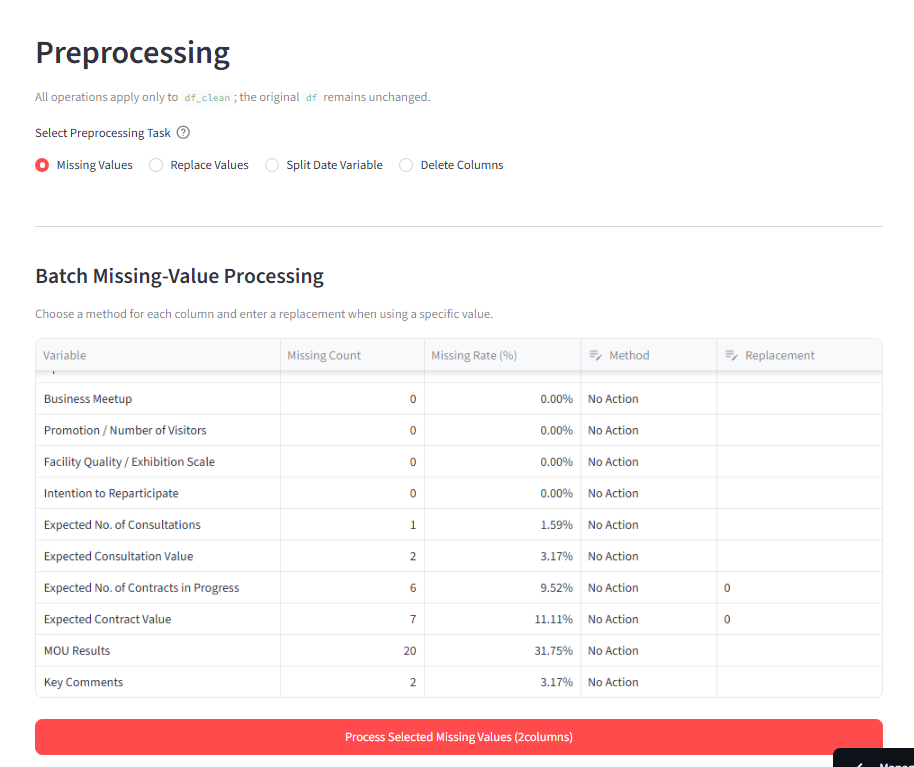
Pre-processing
-
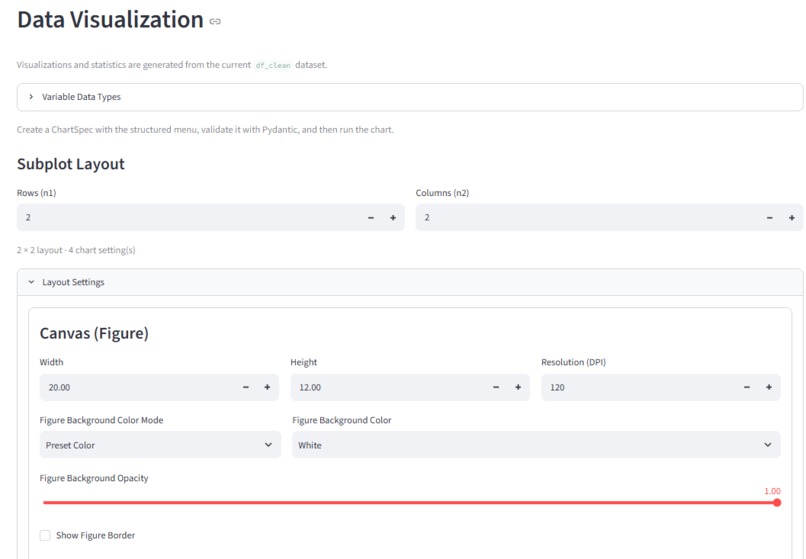
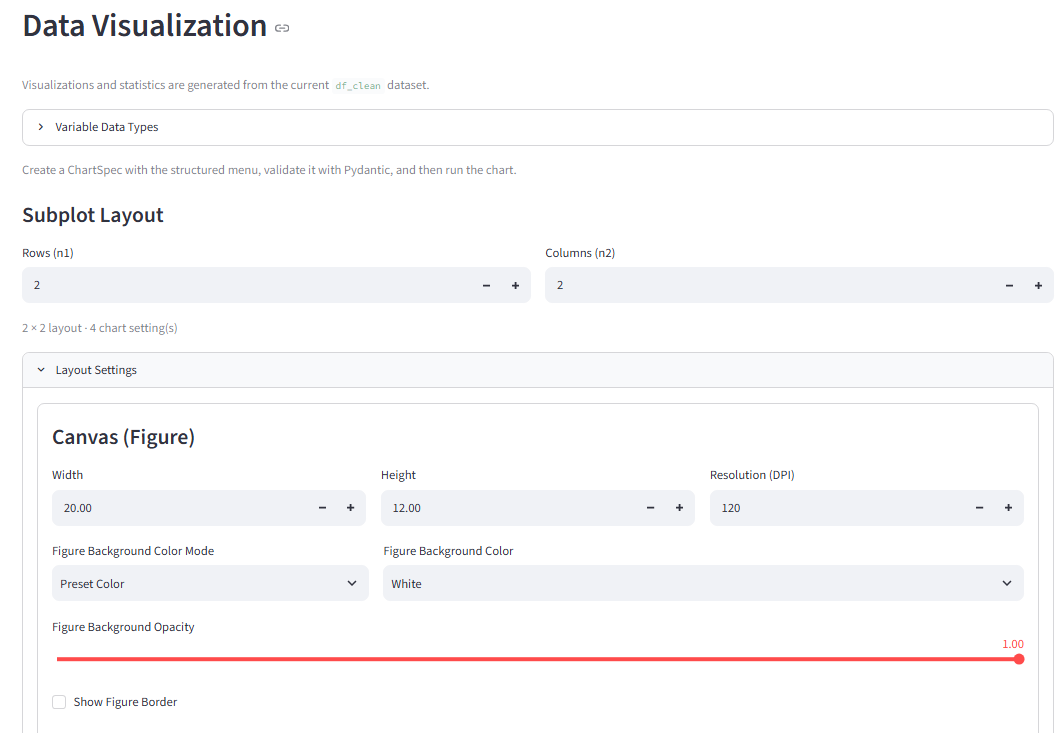
Chart Specification1
-
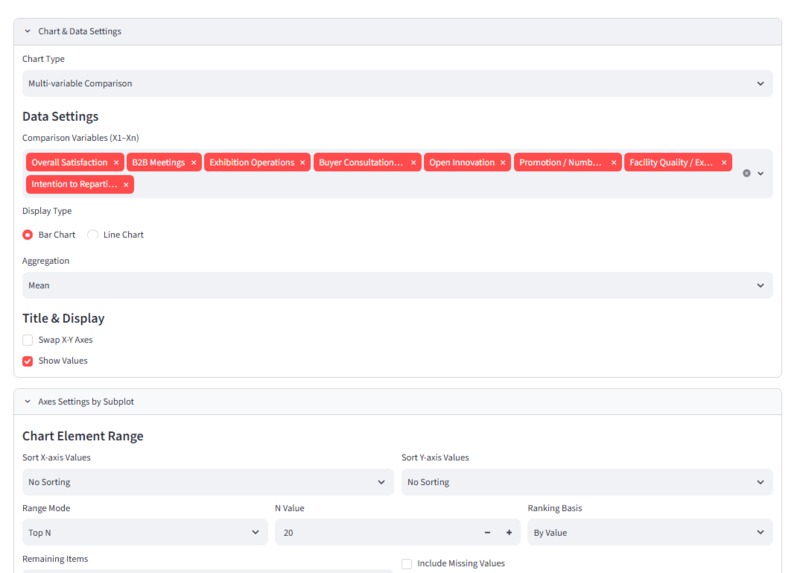
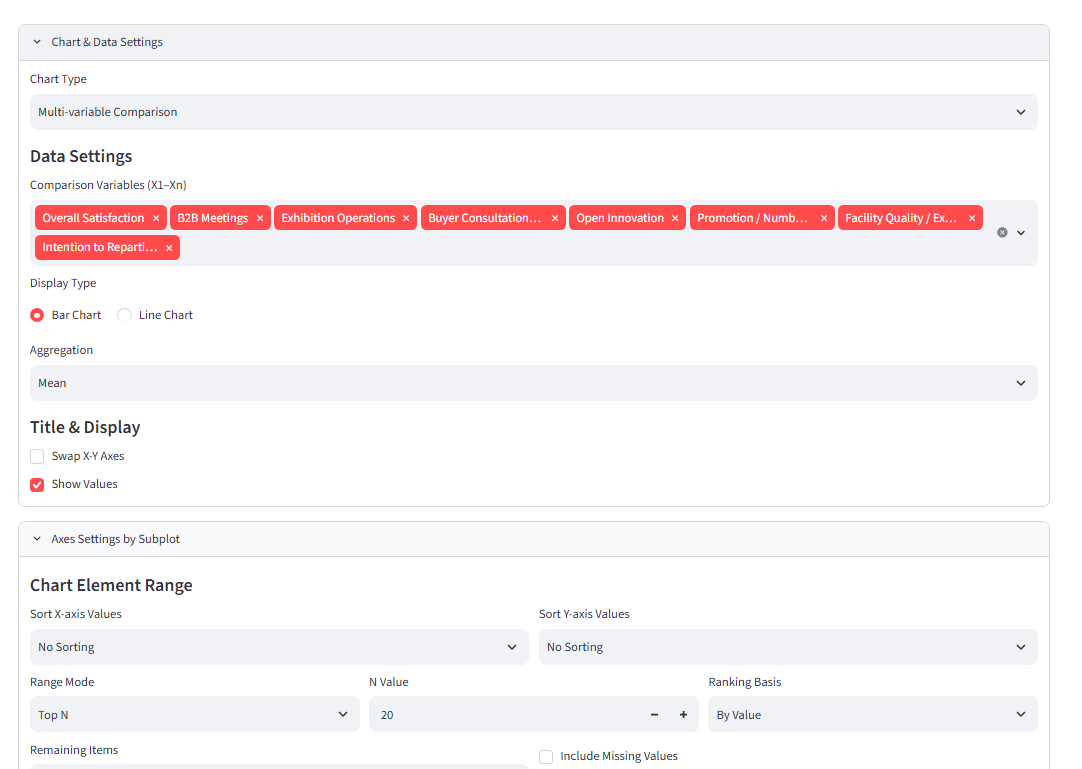
Chart Specification2
-
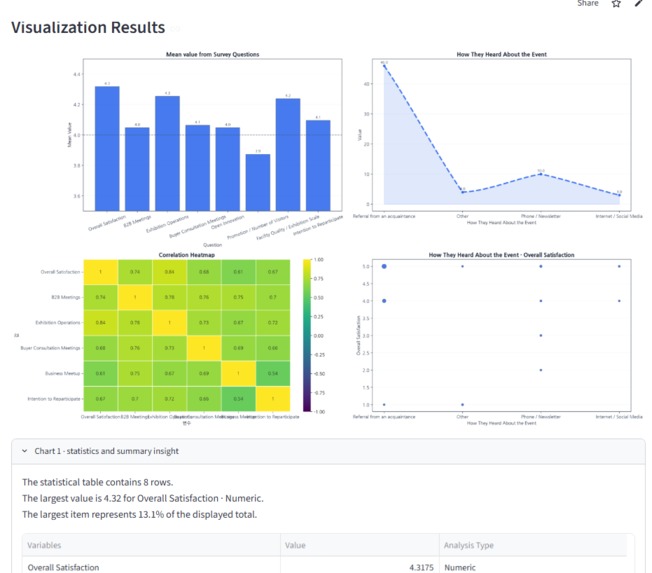
Chart Rendering
-
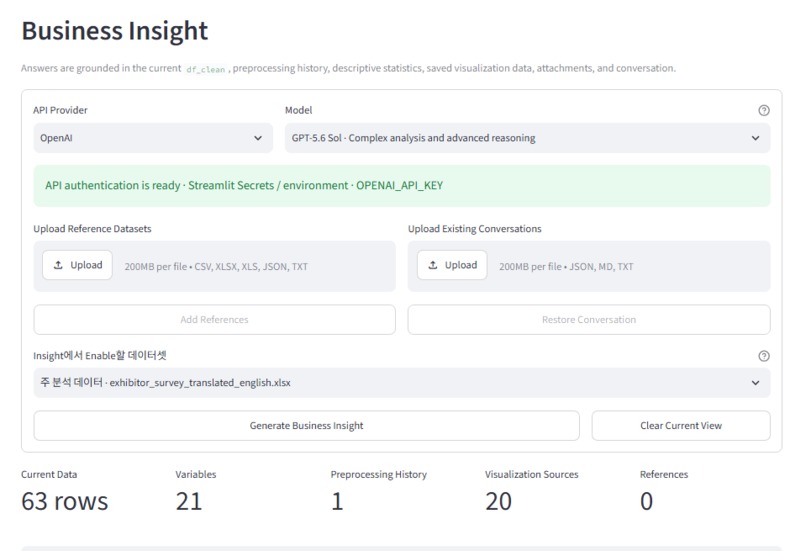
OpenAI API model
-
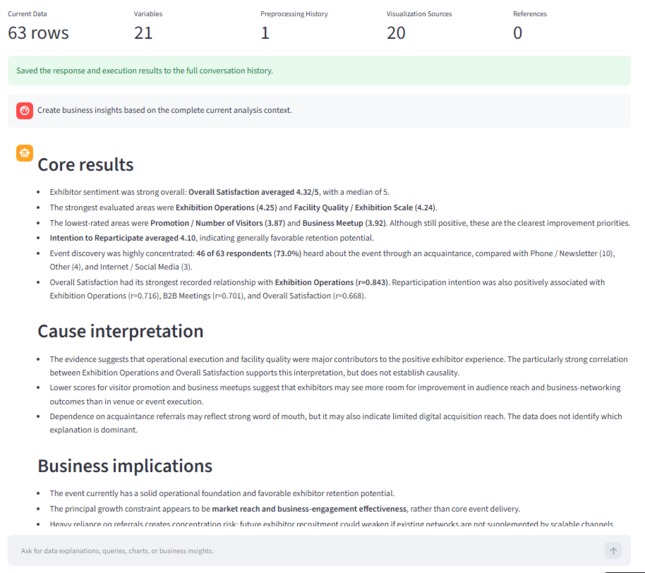
Business Insight
-
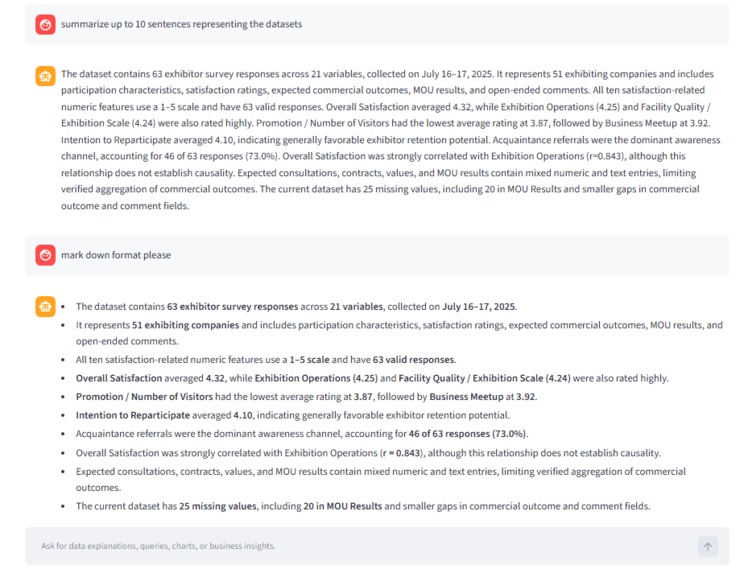
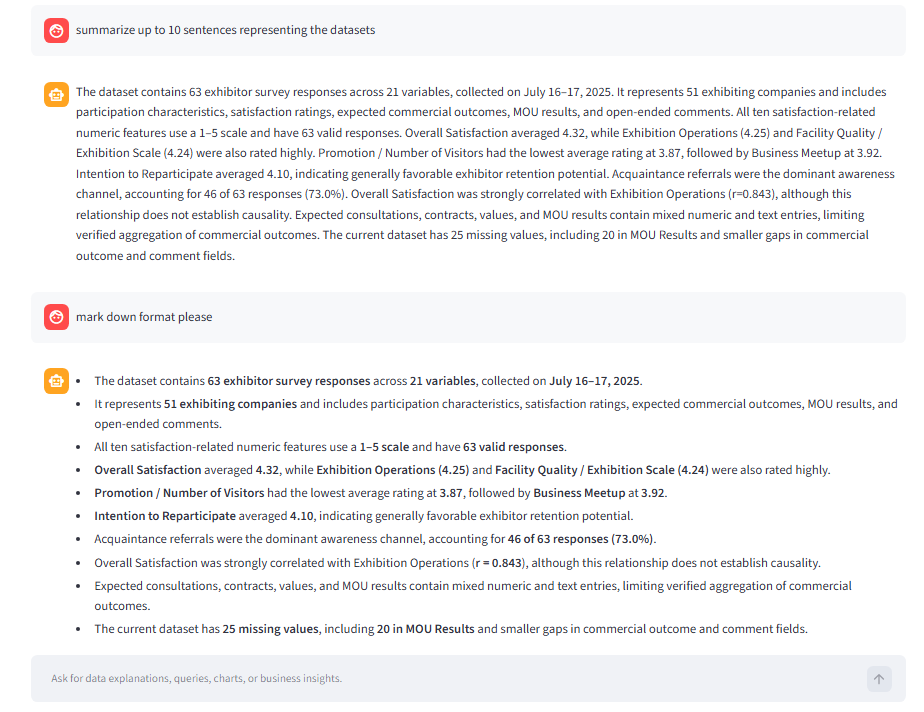
Chat with API model
Inspiration
Exhibition organizers collect valuable data from visitor registrations, surveys, booth scans, exhibitors, and consultations. However those data remains in spreadsheets and is difficult to analyze without programming knowledge.
I built Exhibition Data Analysis to help exhibition professionals analyze data, create charts, and generate business insights through a simple web interface and natural-language conversation. This is not only limited to exhibition area but also very powerful to get the insights from spreadsheet dataset.
What it does
Users can upload Excel or CSV files and:
- Data Load : Review data structure, missing values, and descriptive statistics
- Preprocessing : Clean missing values, duplicates, outliers, and inconsistent data
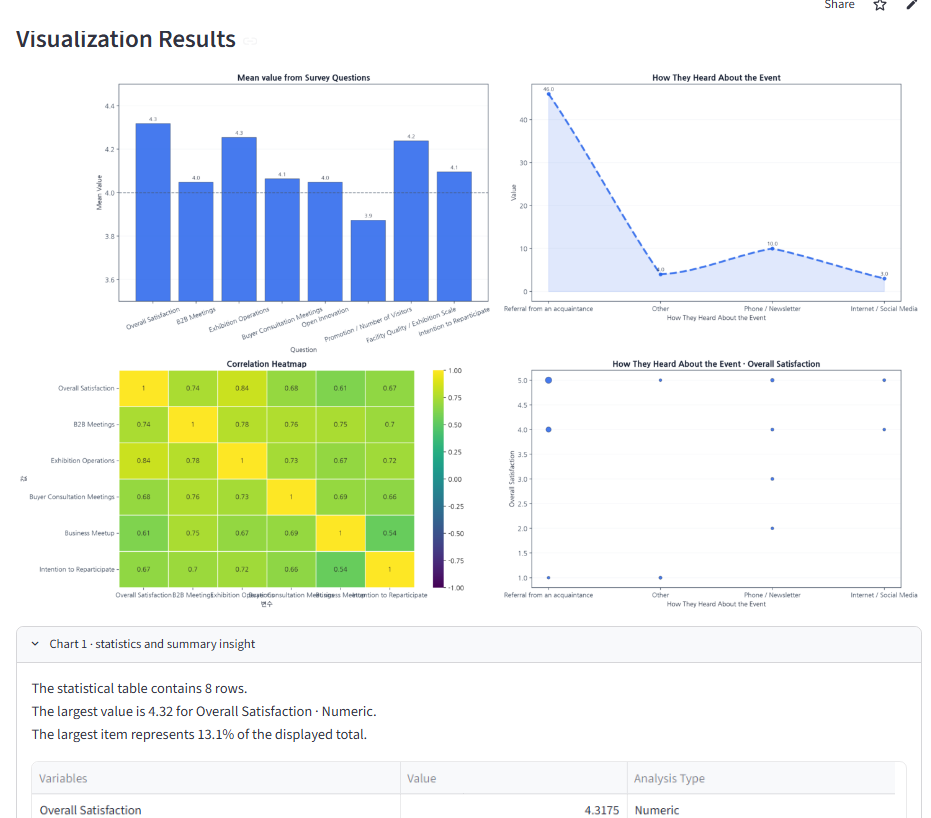
- Visualization : Create statistical tables and charts
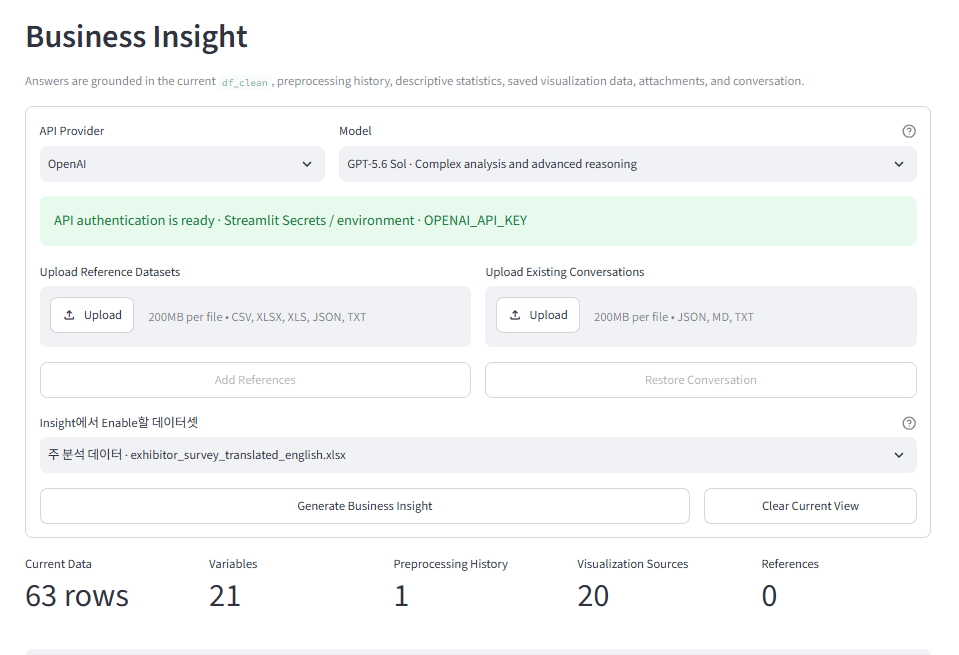
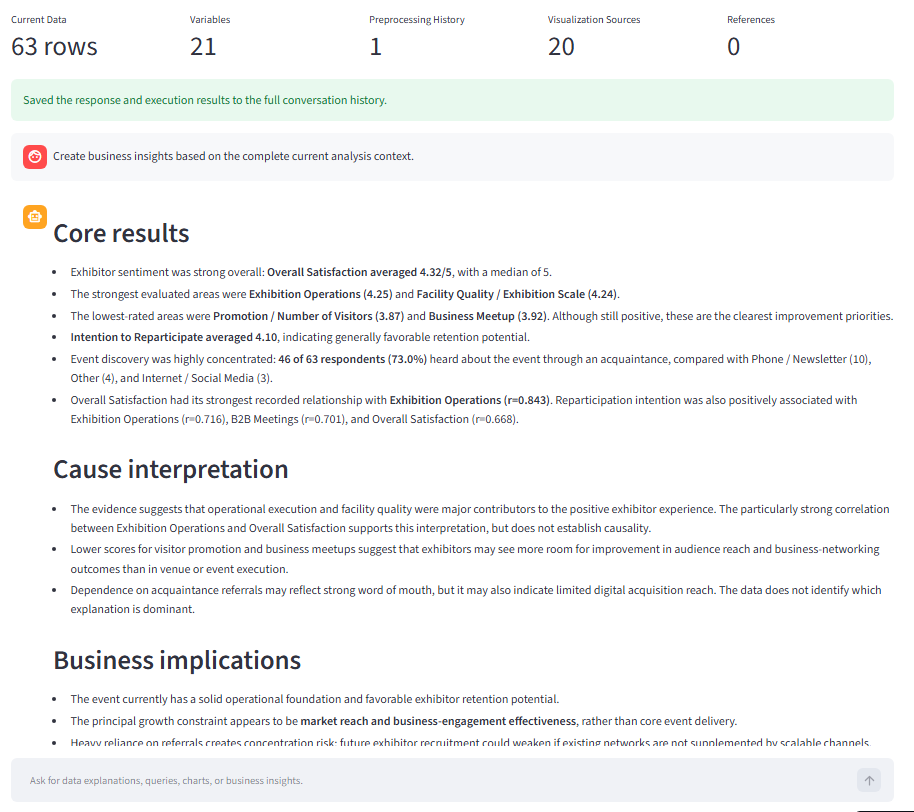
- Business Insight : 1) Compare visitor, exhibitor, satisfaction, marketing, and consultation results 2) Ask analysis questions in natural language 3) Generate interpretations based on actual calculated results
How I built it
The project was planned and guided by GPT 5.6 and Codex and details with:
- Python and Pandas for data processing
- Streamlit for the web interface
- Matplotlib for visualization
- Pydantic for validating analysis and chart settings
- OpenAI API for understanding requests and generating insights
- GitHub for source control
Instead of allowing the AI to generate arbitrary chart code, the AI creates a structured ChartSpec. The specification is validated before predefined statistical and visualization functions are executed.
Challenges
The main challenges were:
- Converting natural-language requests into valid statistical operations
- Supporting different variable types and aggregation methods
- Preventing unsupported or incorrect AI-generated chart settings
- Managing Streamlit state, conversation history, and uploaded datasets
- Designing detailed chart controls without making the interface too complex
What I learned
I learned that AI-powered analysis becomes more reliable when it is combined with structured outputs, validation, predefined functions, and actual calculation results.
I also learned that domain knowledge is the first pilar. Exhibition & conference professionals need practical insights about visitor flow, satisfaction, marketing effectiveness, exhibitor performance, and revisit intention—not only charts.
What's next
The next steps are to add predictive analysis(supervised, un-supervised for predictions), text analysis, automated reports, PPT and PDF exports.
The long-term goal is to develop an AI-powered exhibition intelligence platform covering planning, marketing, onsite operations, analysis, and reporting.


Log in or sign up for Devpost to join the conversation.