Inspiration
Many organizations rely on static reports and spreadsheets that make it difficult to quickly understand financial performance. We were inspired to build a clean, interactive dashboard that transforms raw financial data into meaningful insights, allowing decision-makers to instantly identify trends, strengths, and problem areas without technical complexity.
What it does
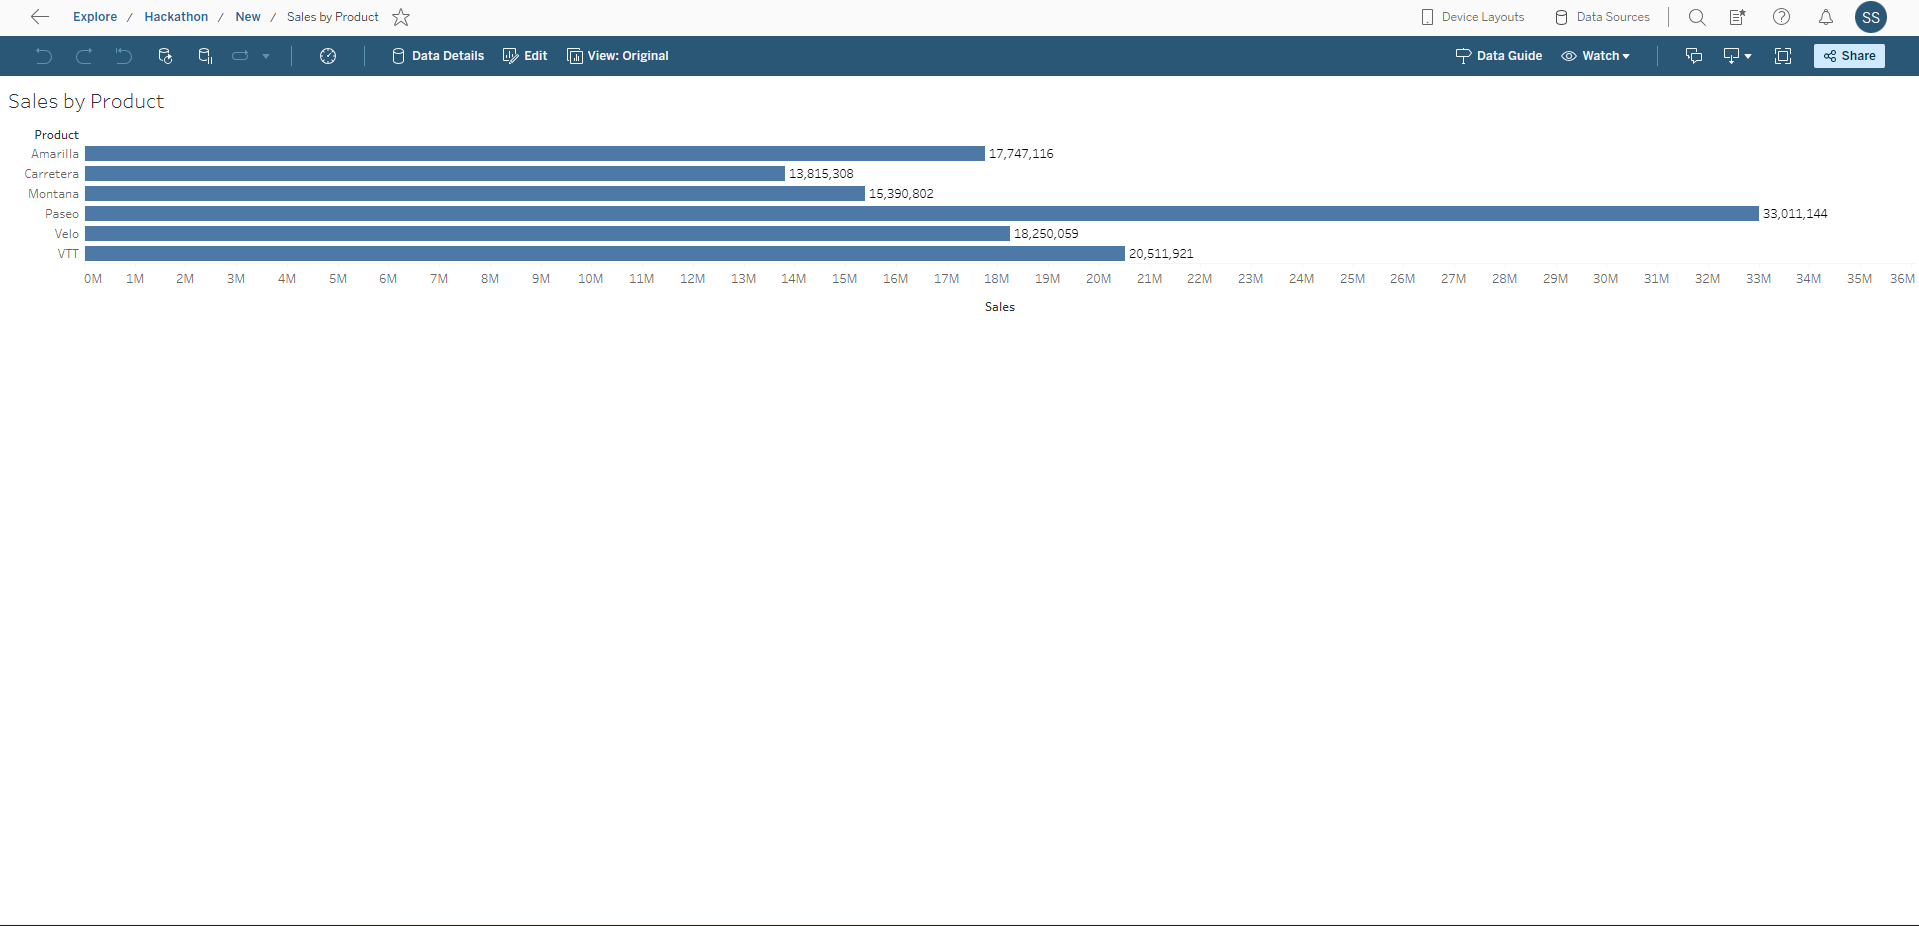
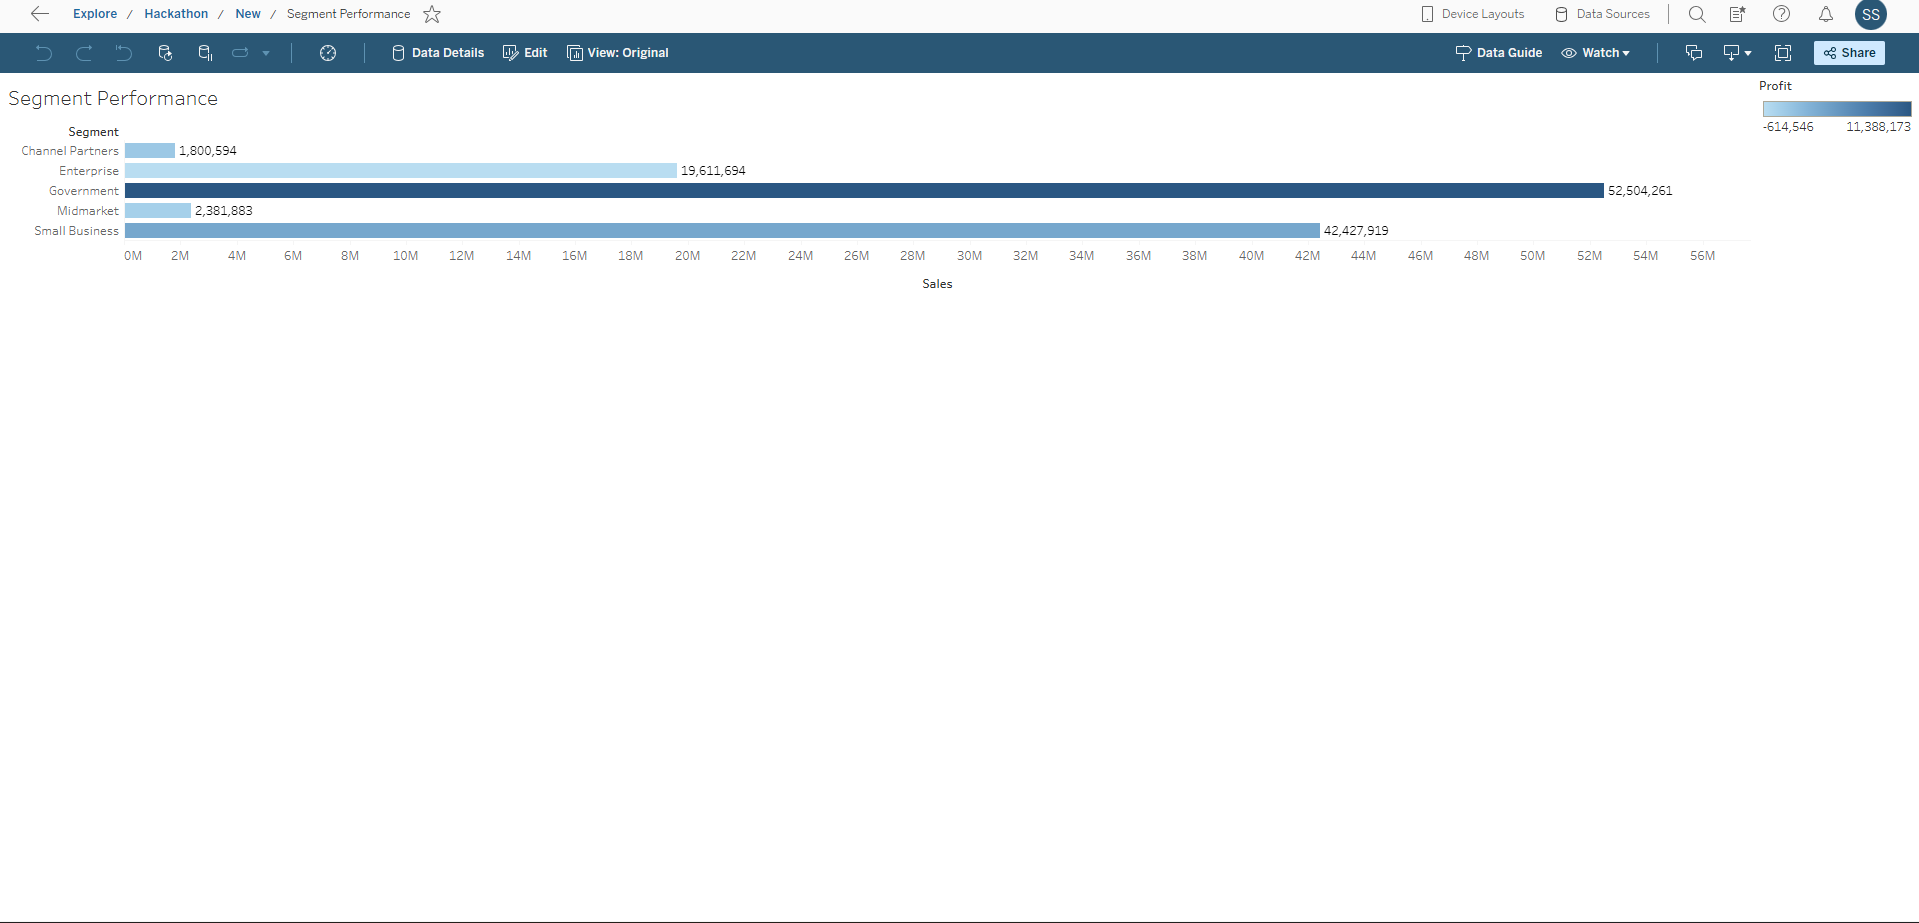
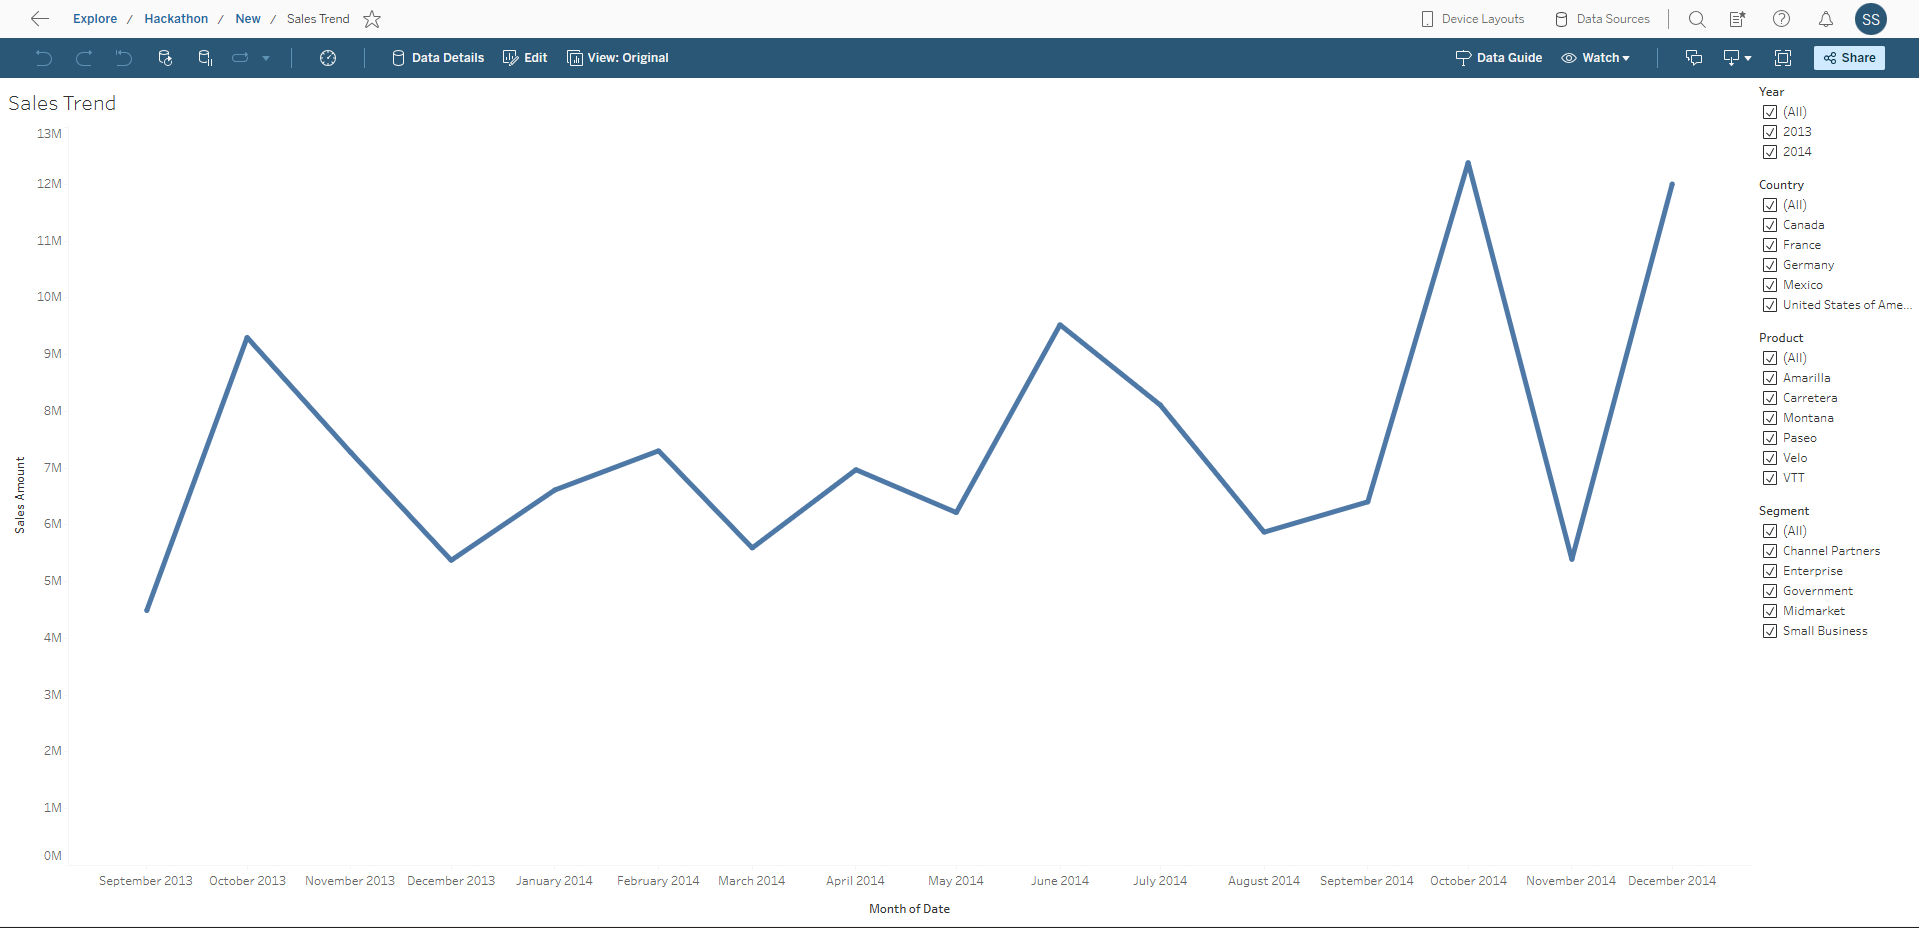
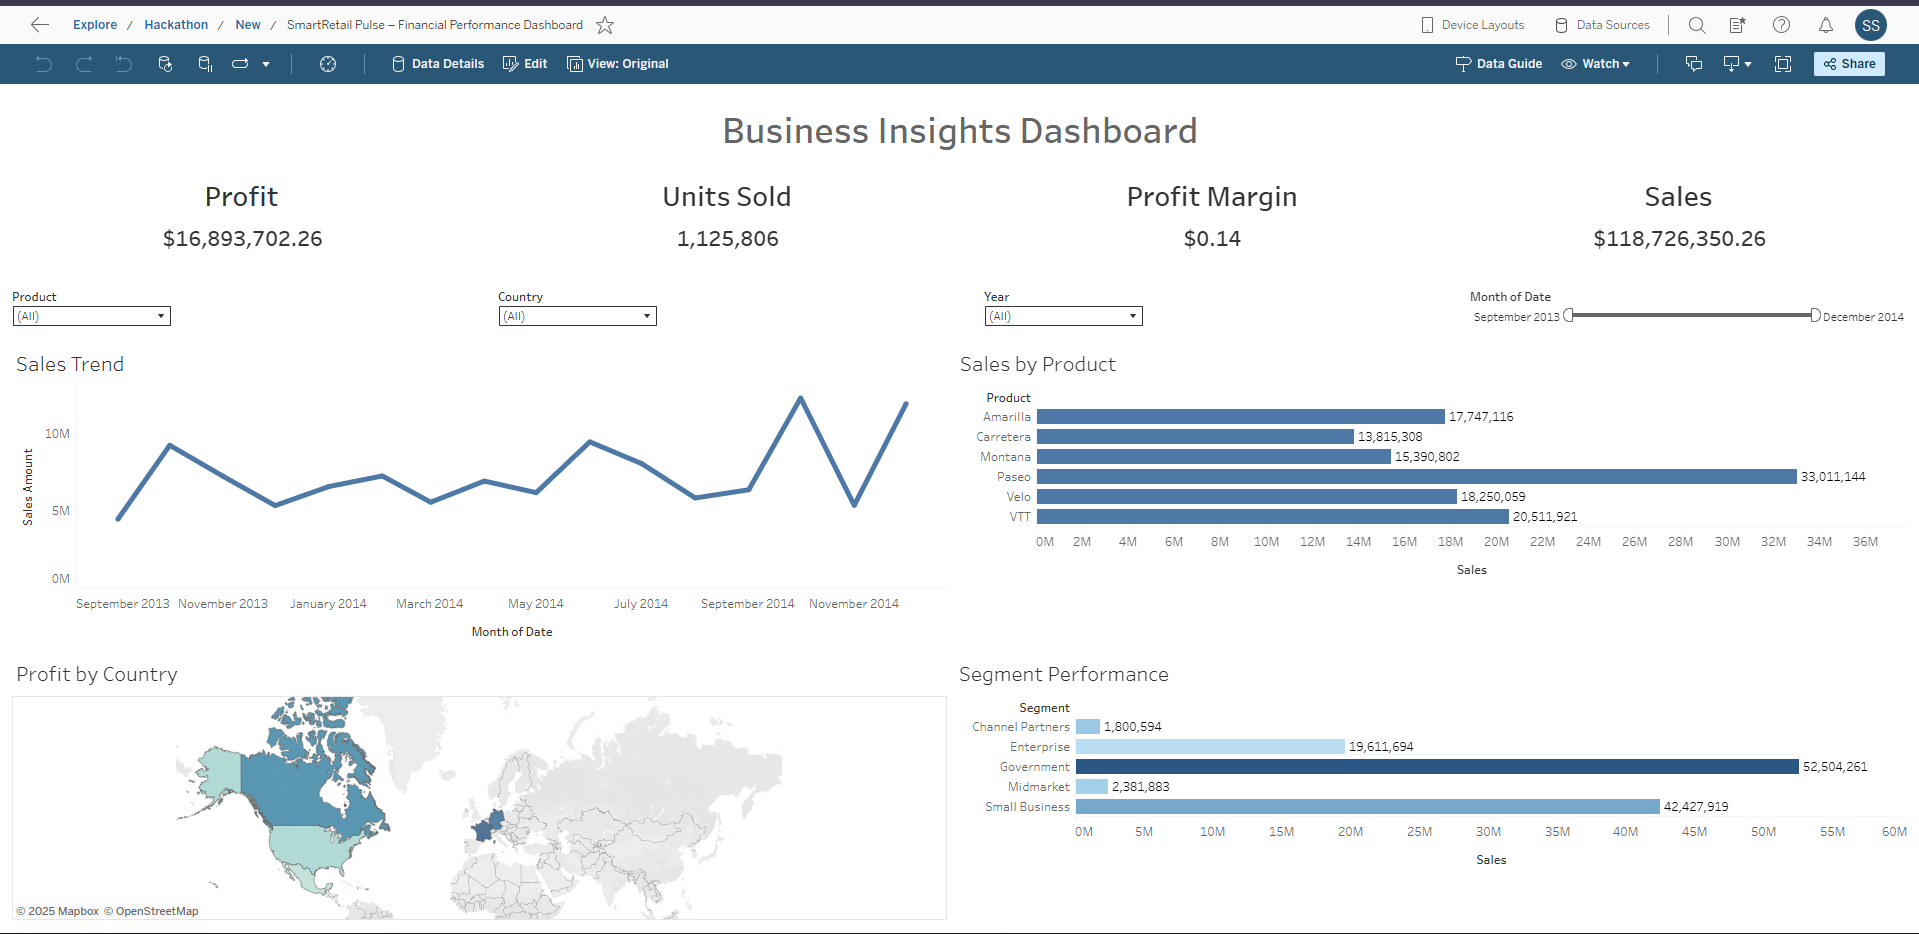
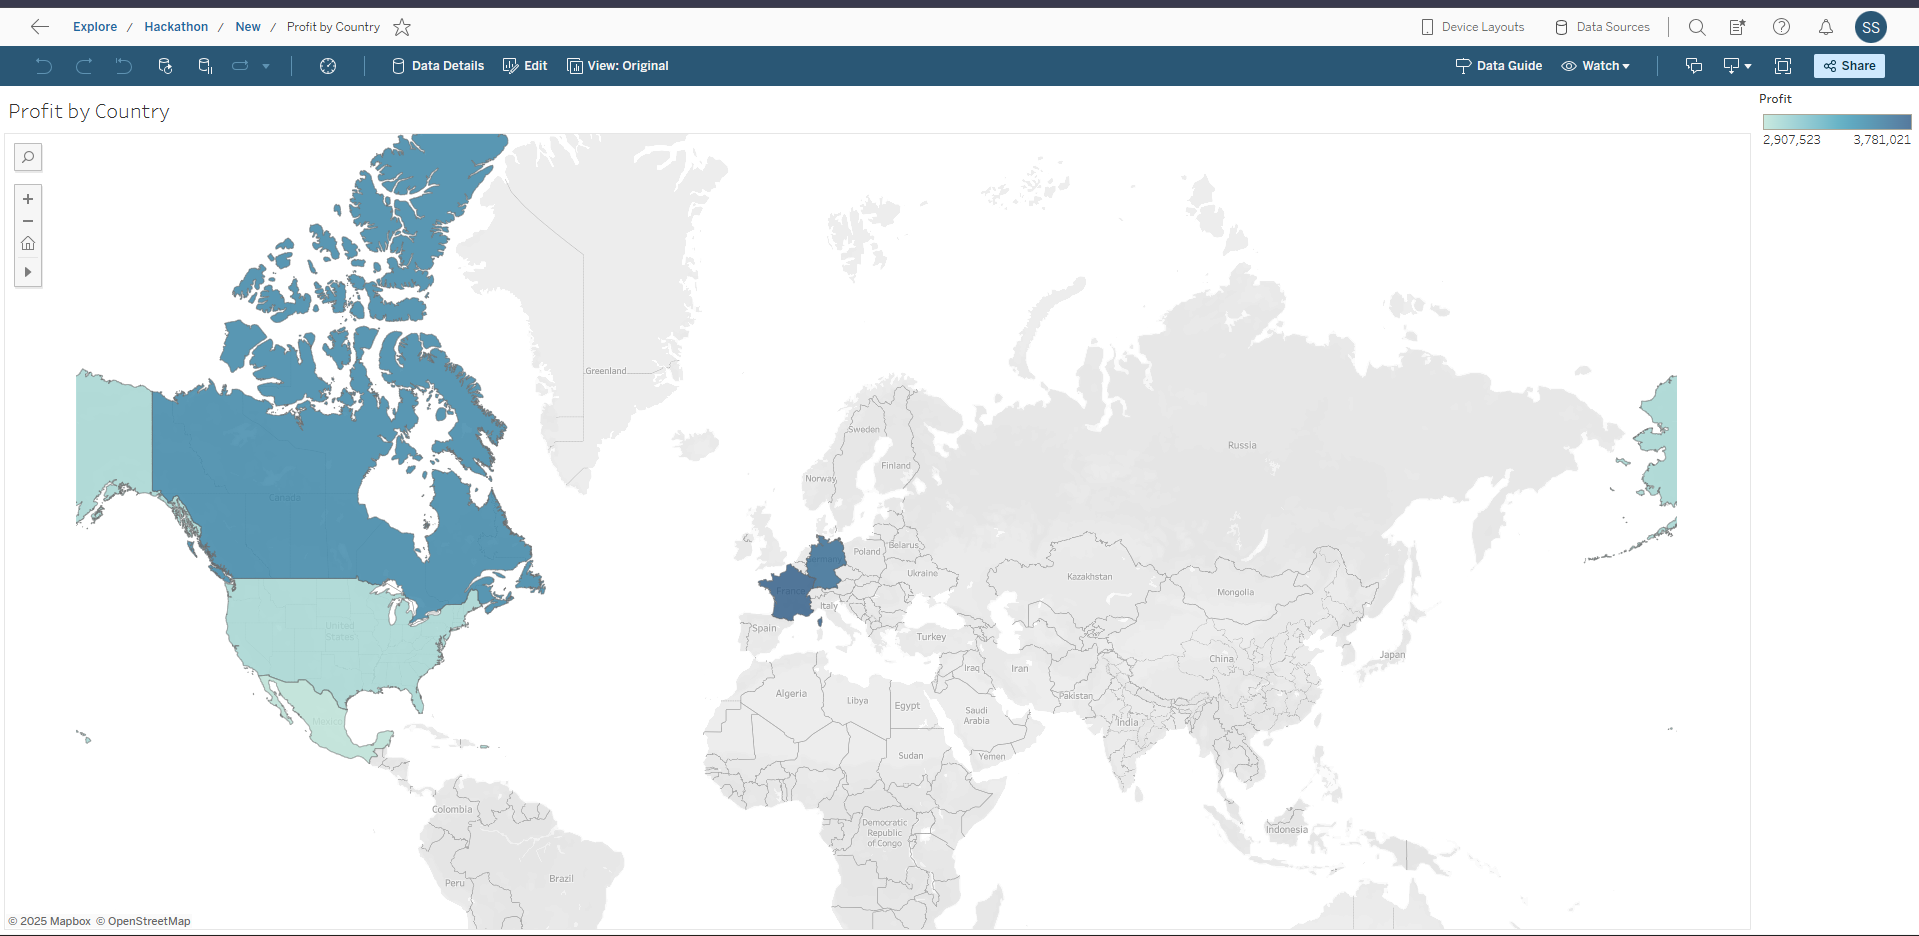
The Financial Performance Dashboard provides a centralized view of key business metrics such as Sales, Profit, Units Sold, and Profit Margin. Users can interactively explore performance across products, countries, business segments, and time periods. With dynamic filters and intuitive visualizations, the dashboard enables fast, data-driven decisions.
How we built it
We built the solution using Tableau Desktop for data modeling, calculated fields, and visualization design. The dashboard was structured using layout containers to ensure consistency and responsiveness. KPIs, trend analysis, bar charts, and map visualizations were combined into a single dashboard and published on Tableau Cloud / Tableau Public using the Tableau Developer Platform.
Challenges we ran into
One of the main challenges was designing a dashboard that balances rich insights with visual simplicity. Choosing the right charts, maintaining consistent formatting, and aligning KPIs while ensuring smooth interactivity required multiple design iterations. Optimizing performance while keeping the dashboard clean was also a key challenge.
Accomplishments that we're proud of
Built a professional, executive-ready dashboard Successfully integrated multiple financial metrics into one view Implemented intuitive filters and interactions Created a clean, business-focused design suitable for real-world use Delivered a complete end-to-end Tableau solution within hackathon constraints
What we learned
This project reinforced the importance of storytelling in data visualization. We learned how thoughtful layout design, font consistency, and clear KPIs significantly improve dashboard usability. We also gained hands-on experience with Tableau’s developer tools and best practices for building scalable business dashboards.
What's next
With more time, we plan to add predictive analytics and forecasting, integrate real-time data sources using APIs, and build role-specific dashboards for finance, sales, and management teams. We also aim to enhance insights using Tableau extensions and advanced analytics features.
Built With
- tableau-cloud

Log in or sign up for Devpost to join the conversation.