-
-
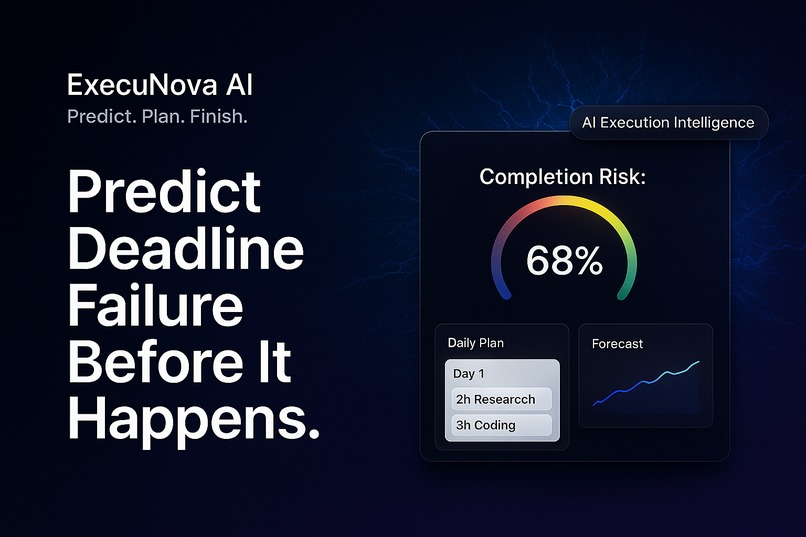
ExecuNova AI: Predict. Plan. Finish
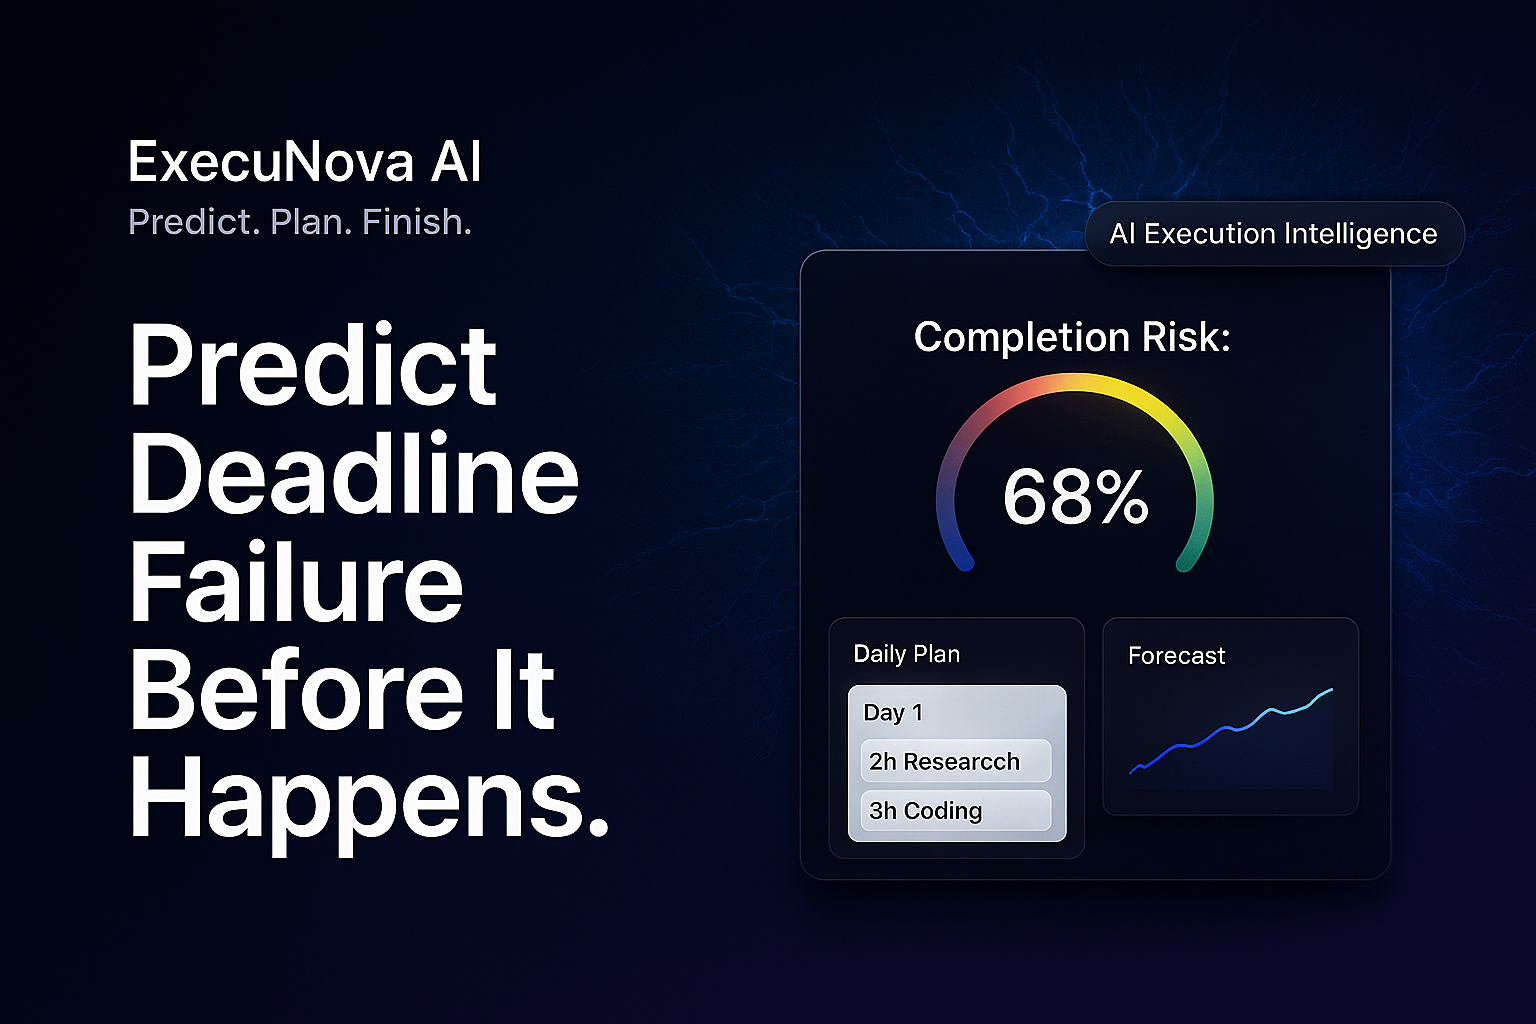
ExecuNova AI — Predict. Plan. Finish.
AI-Powered Deadline Prediction & Adaptive Task Planning System
ExecuNova AI is a next-generation productivity tool that predicts whether you'll meet your deadlines, breaks tasks into actionable daily plans, and dynamically adjusts your schedule to maximize completion success.
Features
Core Capabilities
AI-Powered Task Breakdown
- Automatically parses complex tasks into actionable subtasks
- Intelligent estimation of time requirements
- Priority-based task classification (high, medium, low)
Completion Probability Prediction
- Real-time risk scoring (0-100% success rate)
- Planning fallacy correction (1.4x buffer factor)
- Energy level and productivity adjustments
- Visual risk meter with color-coded feedback (Green → Yellow → Red)
Optimized Daily Plans
- Smart task allocation across available days
- Balanced workload distribution
- Capacity utilization tracking
- Prevents burnout and overload
Dynamic Recalibration
- Real-time schedule adjustments
- Progress-based risk updates
- Adaptive recommendations
- Interactive task completion tracking
Visual Analytics
- Workload distribution charts (Chart.js)
- Daily execution cards with expandable details
- Progress tracking with completion percentages
- Risk trend visualization
Persistent Storage
- Local storage integration (no backend required)
- Task history tracking
- Session persistence
- Privacy-focused client-side storage
Configuration
This instance has been configured with the following parameters:
- Application Name: ExecuNova AI
- Planning Fallacy Factor: 1.4 (40% time buffer)
- Default Hours Per Day: 6 hours
- Risk Thresholds: Low ≥70%, Medium ≥40%, High <40%
- AI Recommendation Style: Detailed recommendations with actionable insights
- Task History: Enabled (stores last 5 tasks)
- Analytics Charts: Enabled (interactive workload visualization)
User Interface
- Clean, Professional Design: Modern gradient UI (indigo → purple)
- Intuitive Navigation: Tab-based interface for Input → Analysis → Plan
- Interactive Components: Click to complete tasks, expand daily cards
- Responsive Layout: Works on desktop and mobile
- Color-Coded Feedback: Visual risk indicators throughout
- Smooth Animations: Transitions and hover effects for better UX
AI Engine
Task Parsing Algorithm
The AI engine analyzes task descriptions and generates structured subtask breakdowns:
// Example: "Build Dashboard"
{
  "subtasks": [
    { "name": "Design wireframe and layout", "hours": 3, "priority": "high" },
    { "name": "Implement component structure", "hours": 4, "priority": "high" },
    { "name": "Add interactive charts", "hours": 5, "priority": "medium" },
    { "name": "Style with CSS/Tailwind", "hours": 3, "priority": "medium" },
    { "name": "Test responsiveness", "hours": 2, "priority": "low" }
  ]
}
Risk Calculation Formula
Total Hours = Σ(subtask hours)
Corrected Hours = Total Hours × 1.4 (planning fallacy correction)
Effective Hours = Days Until Deadline × Hours Per Day × Energy Level
Raw Probability = (Effective Hours / Corrected Hours) × 100
Uncertainty Penalty = min(20, subtask_count × 2)
Final Probability = max(0, min(100, Raw Probability - Uncertainty Penalty))
Risk Levels
- Low Risk (Green): 70-100% completion probability
- Medium Risk (Yellow): 40-69% completion probability
- High Risk (Red): 0-39% completion probability
Detailed AI Recommendations
This instance provides detailed recommendations including:
- Specific hour adjustments needed to improve success probability
- Deadline extension suggestions with exact day calculations
- Task prioritization strategies for high-risk scenarios
- Break scheduling to maintain energy levels
- Project complexity assessments with granularity recommendations
- Timeline-specific advice for tight deadlines
- Success reinforcement for well-planned projects
How It Works
Step-by-Step Flow
User Input
- Task description
- Deadline date
- Available hours per day (1-16h slider)
- Energy level (Tired 50% / Normal 100% / Peak 150%)
AI Processing
- Parse task into subtasks
- Estimate time requirements
- Calculate completion probability
- Generate detailed AI recommendations
Plan Generation
- Allocate tasks across available days
- Optimize workload distribution
- Identify overloaded periods
- Create daily execution cards
Interactive Tracking
- Check off completed subtasks
- Real-time risk recalculation
- Progress visualization
- Adaptive schedule updates
Technical Stack
- Frontend: React 18 (via CDN)
- Styling: Tailwind CSS
- Charts: Chart.js
- State Management: React Hooks (useState, useEffect)
- Data Persistence: LocalStorage
- AI Simulation: Custom JavaScript algorithms
- No Backend Required: Fully client-side application
Quick Start
Option 1: Open Directly
Simply open index.html in your web browser. No installation required!
Option 2: Local Server
# Using Python 3
python -m http.server 8000

# Using Node.js
npx serve

# Then open http://localhost:8000
Usage Guide
Creating Your First Task
Enter Task Details
- Task description (e.g., "Build responsive dashboard with charts")
- Set deadline date
- Adjust available hours per day (default: 6h)
- Select energy level
Analyze with AI
- Click "Analyze Task with AI"
- Wait for AI processing (1-2 seconds)
- View generated subtasks and risk analysis
Review Risk Analysis
- Check completion probability percentage
- Review risk level (Low/Medium/High)
- Read detailed AI recommendations
- Track metrics (total hours, days remaining, etc.)
View Daily Plan
- Switch to "Daily Plan" tab
- Review workload distribution chart
- Expand daily cards to see task details
- Monitor capacity utilization
Track Progress
- Click subtasks to mark as completed
- Watch risk score update in real-time
- Get adaptive recommendations
Use Cases
For Students
- Assignment Planning: Break down research papers, projects
- Exam Preparation: Allocate study time across topics
- Deadline Management: Prevent last-minute cramming
For Developers
- Sprint Planning: Realistic task estimation
- Feature Development: Break down complex features
- Bug Fixing: Prioritize and schedule fixes
For Professionals
- Project Delivery: Ensure on-time completion
- Presentation Prep: Plan research, design, rehearsal
- Report Writing: Structure multi-day writing tasks
For Teams
- Capacity Planning: Distribute work across team members
- Risk Assessment: Identify bottlenecks early
- Timeline Forecasting: Realistic deadline predictions
Example Scenarios
Scenario 1: Overambitious Student
Input:
- Task: "Write 20-page research paper"
- Deadline: 3 days from now
- Hours per day: 7h
- Energy: Normal (100%)
Output:
- AI breaks into 6 subtasks (research, outline, draft sections, edit, format)
- Total estimated: 24 hours
- Risk: HIGH (35% completion probability)
- Recommendation: "Increase daily hours to 11h to improve success probability"
Scenario 2: Realistic Developer
Input:
- Task: "Implement user authentication"
- Deadline: 5 days from now
- Hours per day: 6h
- Energy: Peak (150%)
Output:
- AI breaks into 5 subtasks (design, backend, frontend, testing, docs)
- Total estimated: 18 hours
- Risk: LOW (85% completion probability)
- Recommendation: "Excellent planning! You have comfortable margin for quality and refinement"
Scenario 3: Burnout Prevention
Input:
- Task: "Build complete dashboard"
- Deadline: 7 days from now
- Hours per day: 12h
- Energy: Tired (50%)
Output:
- Risk: MEDIUM (55% completion probability)
- Recommendation: "Schedule regular breaks every 90 minutes to maintain energy and productivity"
- Daily plan shows overload warnings
Research Foundation
ExecuNova AI is built on established psychological research:
Planning Fallacy
- Source: Buehler, Griffin, & Ross (1994)
- Finding: Humans underestimate task time by 40%+
- Solution: ExecuNova applies 1.4× correction factor
Procrastination Studies
- Source: Steel (2007)
- Finding: 20-25% of adults are chronic procrastinators
- Solution: Structured daily plans with clear actionable steps
Capacity Planning
- Source: Productivity research literature
- Finding: Overloaded schedules lead to burnout
- Solution: ExecuNova detects and warns about capacity issues
Design Philosophy
Why This UI?
- Gradient Background: Reduces eye strain, enhances focus
- White Cards: Clean separation of content
- Color-Coded Risks: Instant visual feedback
- Minimal Interface: No clutter, maximum clarity
- Smooth Animations: Professional feel, improved UX
- Glow Effects: Highlights important AI insights
Accessibility
- High contrast text
- Clear visual hierarchy
- Responsive design
- Keyboard navigation support
- Screen reader friendly
Customization
Modifying AI Behavior
Edit the AIEngine object in app.js:
// Adjust planning fallacy factor
const planningFallacyFactor = 1.4; // Default: 1.4 (40% buffer)

// Change uncertainty penalty
const uncertaintyPenalty = Math.min(20, subtasks.length * 2);

// Modify risk thresholds
if (probability >= 70) riskLevel = 'low';
else if (probability >= 40) riskLevel = 'medium';
else riskLevel = 'high';
Styling Modifications
All styles are in index.html <style> section and Tailwind classes.
Data Structure
Task Object
{
  "id": 1234567890,
  "name": "Build Dashboard",
  "deadline": "2026-02-20T23:59:00",
  "hoursPerDay": 6,
  "energyLevel": 1.0,
  "subtasks": [...],
  "risk": {...},
  "plan": [...],
  "createdAt": "2026-02-17T10:00:00"
}
Risk Analysis Object
{
  "probability": 68,
  "riskLevel": "medium",
  "riskColor": "#f59e0b",
  "recommendations": [...],
  "metrics": {
    "totalHours": 17,
    "availableHours": 24,
    "daysRemaining": 4,
    "hoursPerDay": 6
  }
}
Daily Plan Object
{
  "date": "2026-02-18",
  "tasks": [...],
  "plannedHours": 6,
  "utilization": 100,
  "riskLevel": "medium"
}
Troubleshooting
Issue: AI analysis not working
Solution: Check browser console for errors. Ensure JavaScript is enabled.
Issue: Data not persisting
Solution: Check if browser allows localStorage. Clear cache and reload.
Issue: Charts not displaying
Solution: Ensure internet connection (Chart.js loaded via CDN).
Issue: Dates not working correctly
Solution: Ensure deadline is set to future date.
License
This project is open source and available for educational and personal use.
Acknowledgments
- Research: Buehler et al., Steel et al.
- Inspiration: Planning fallacy and productivity research
- Design: Modern web design principles
- Technology: React, Tailwind CSS, Chart.js
Support
For questions, issues, or feature requests, please create an issue in the repository.
ExecuNova AI — Because predicting failure is the first step to preventing it.
Predict. Plan. Finish.


Log in or sign up for Devpost to join the conversation.