

Inspiration
India's EV adoption is growing rapidly, but building an EV charging station is not as simple as finding an empty location. The important question is: Where should a charging station be built so that it has strong demand, less infrastructure competition, and good business potential?
We wanted to solve this problem by combining EV registration data, existing charging-station locations, geospatial information, machine learning, and AI into one platform.
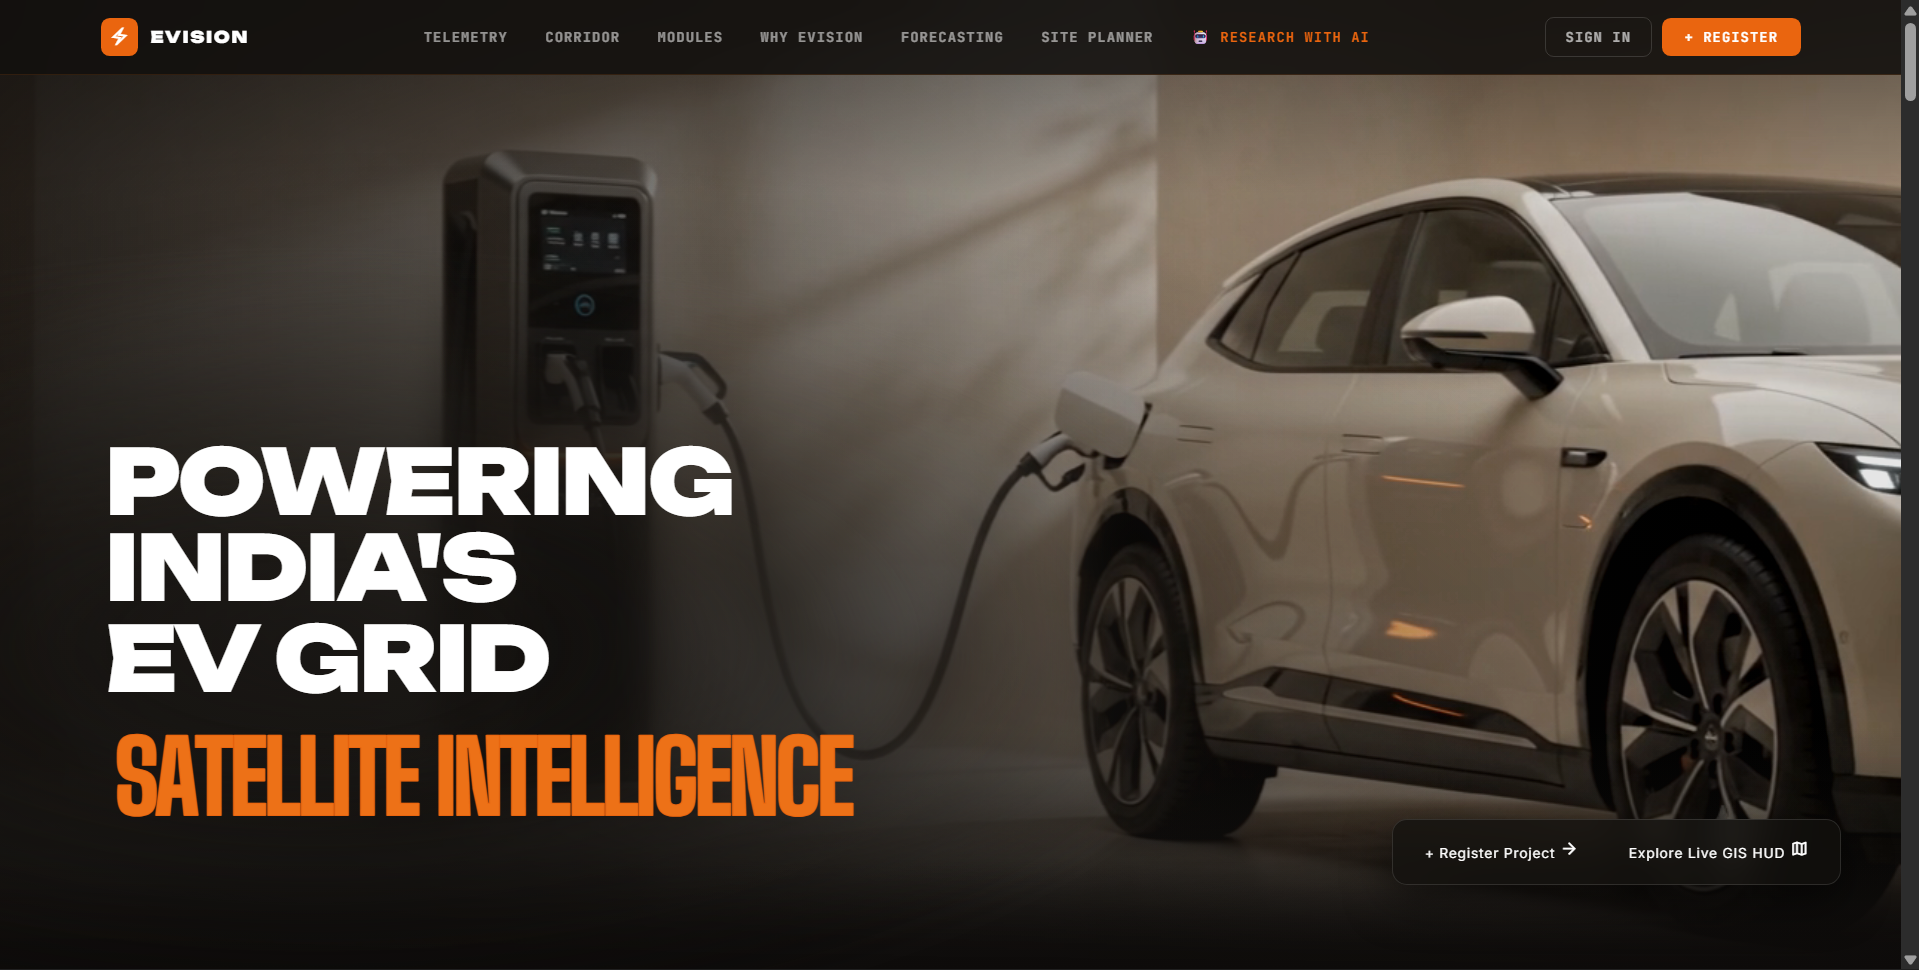
This led us to build EVision — an intelligent EV charging infrastructure planning platform that helps users discover, evaluate, and compare potential charging-station locations.
What it does
EVision helps a user go from location discovery to investment decision.
The user can:
- Select a two-wheeler, four-wheeler, or combined charging station.
- Search for a city or hometown such as Pune.
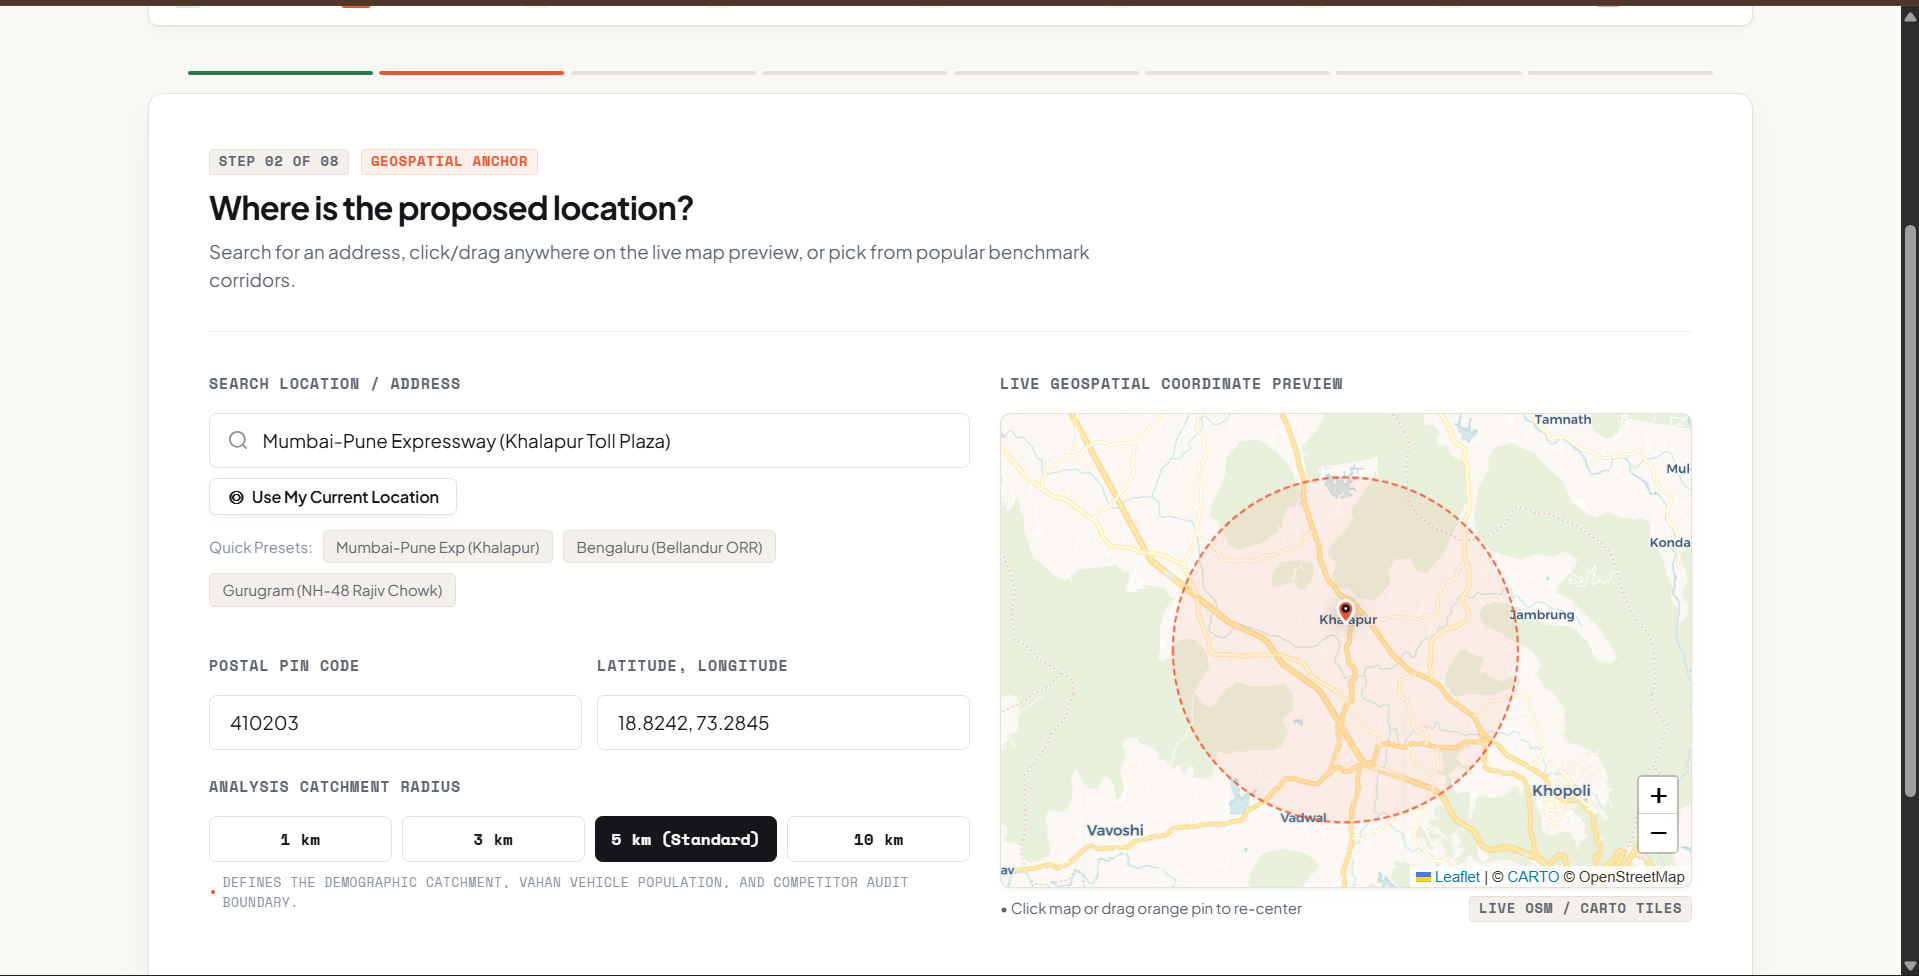
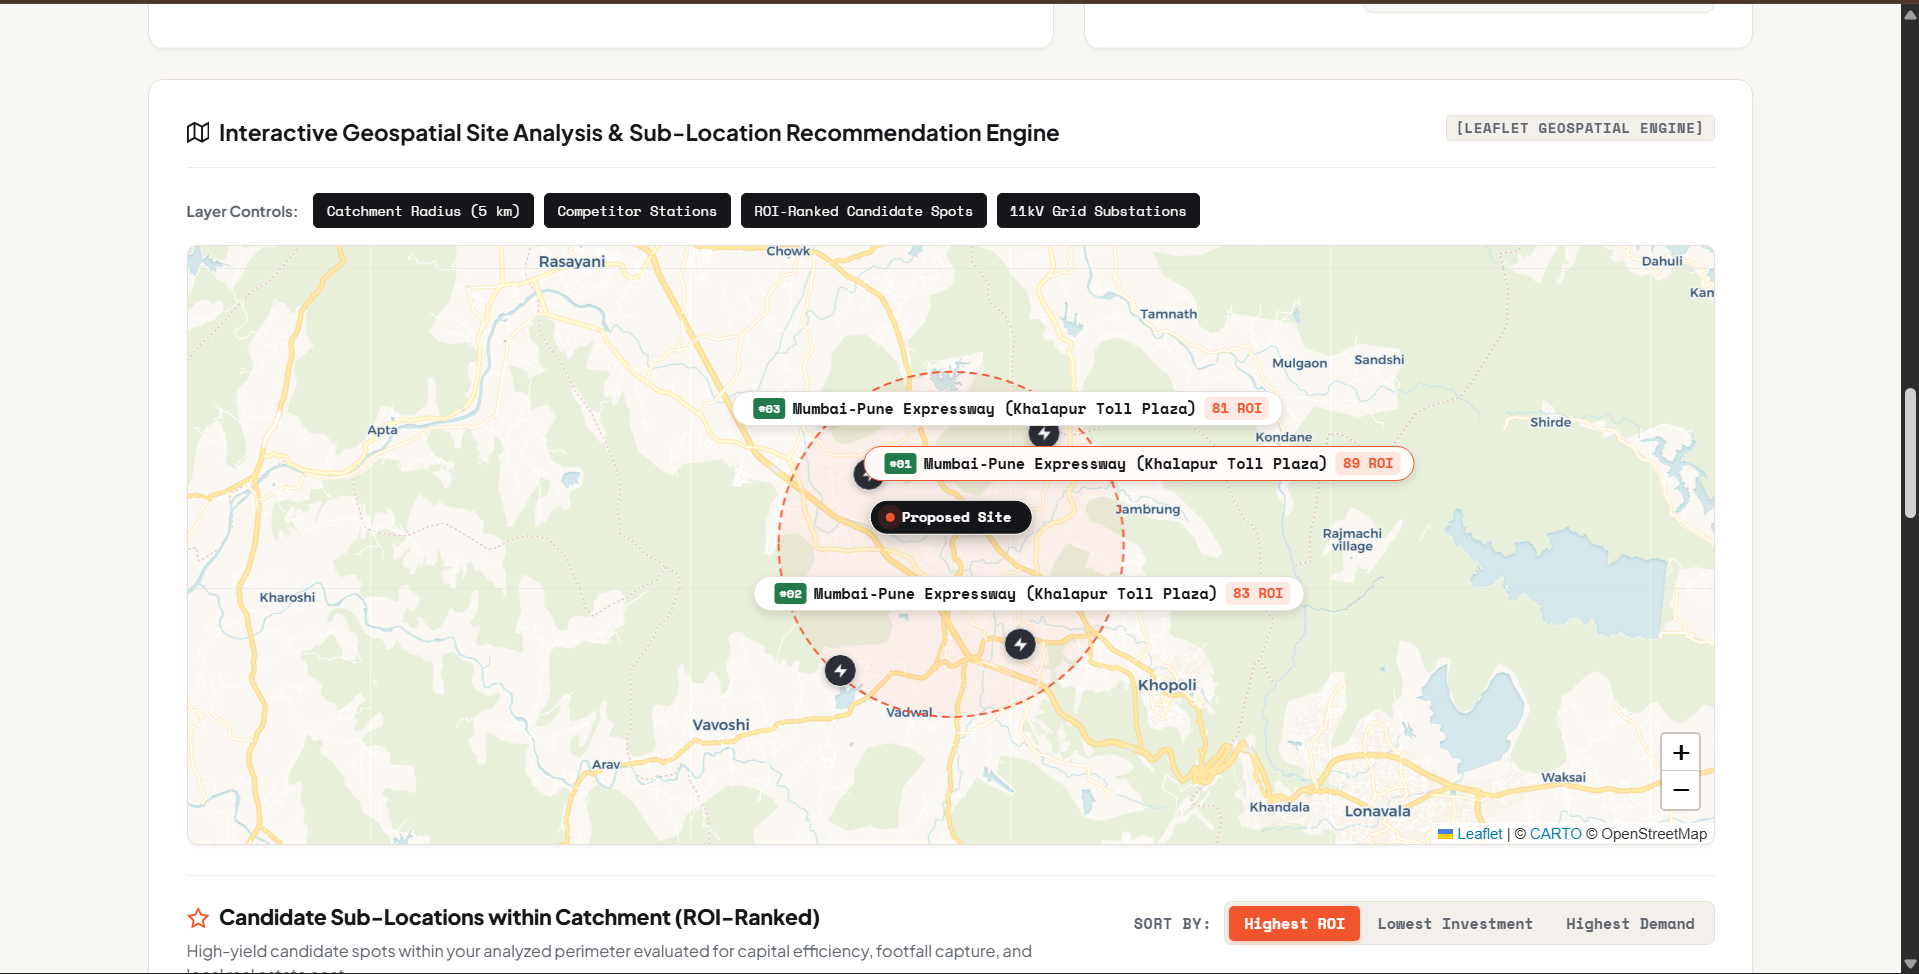
- View existing EV charging stations on an interactive map.
- Identify areas where charging infrastructure is limited.
- Get AI/ML-based recommendations for promising locations.
- View a hotspot score for potential locations.
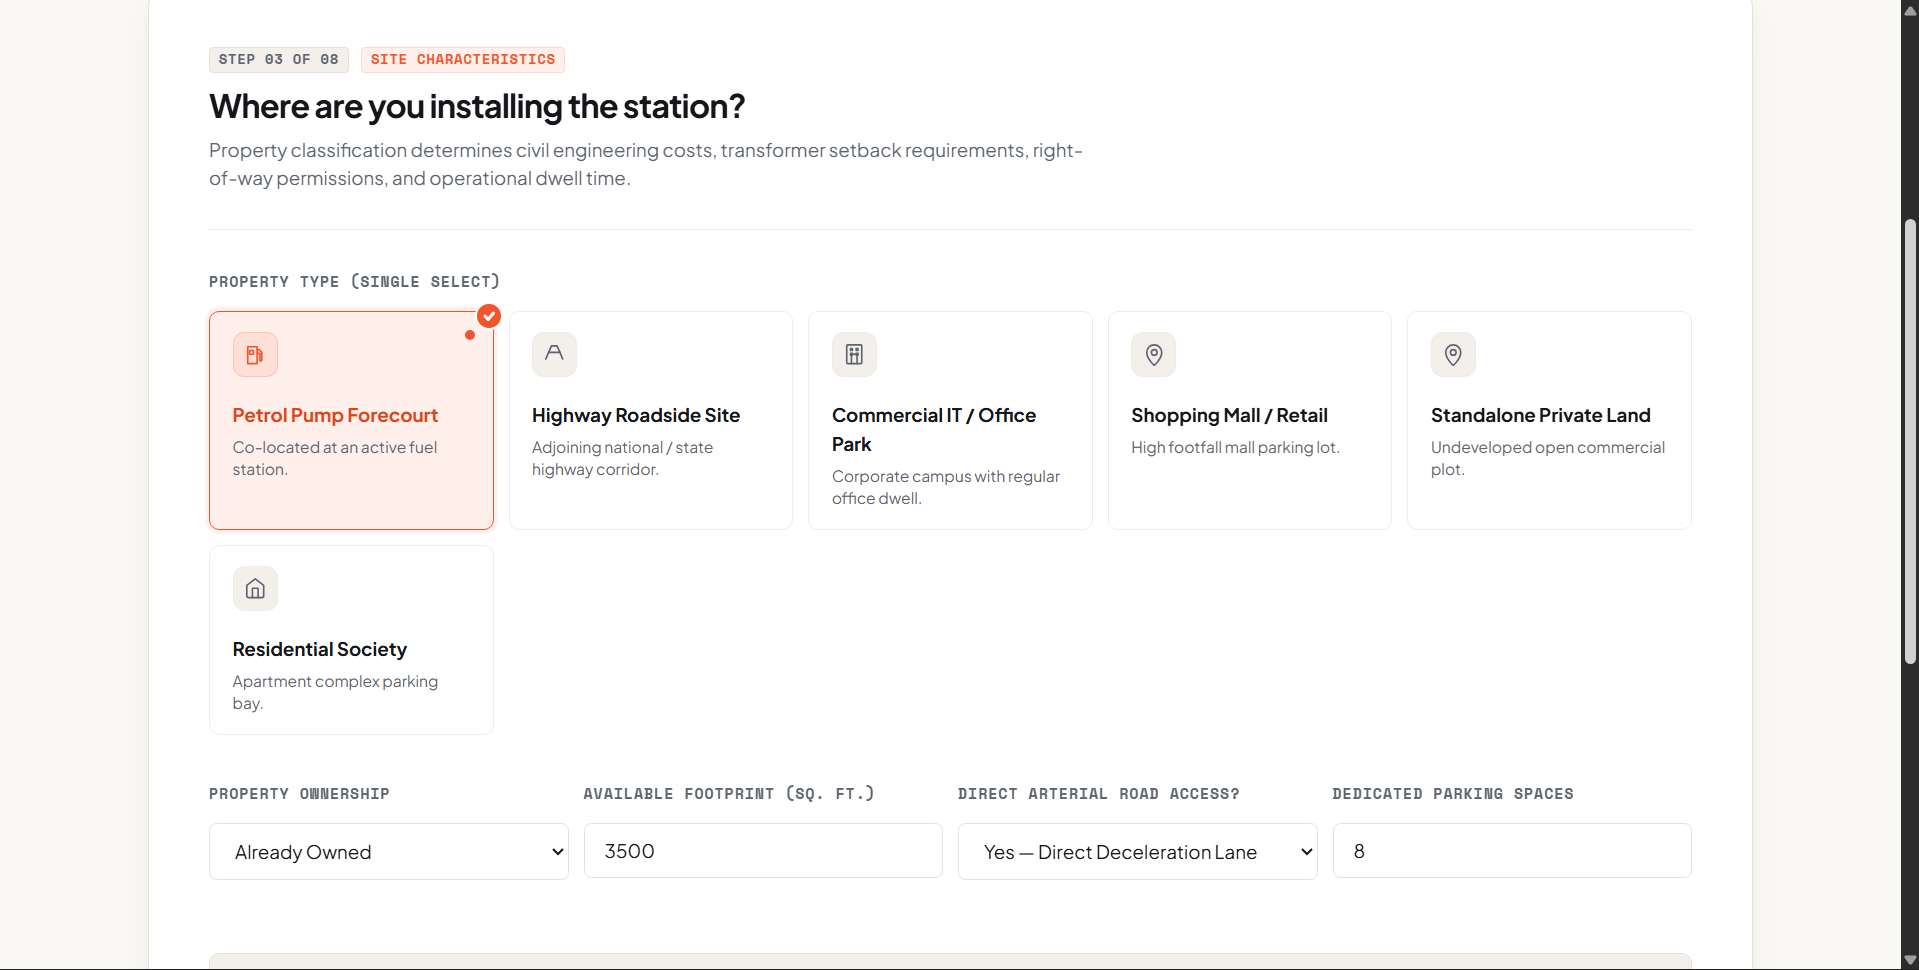
- Select a specific location for a proposed station.
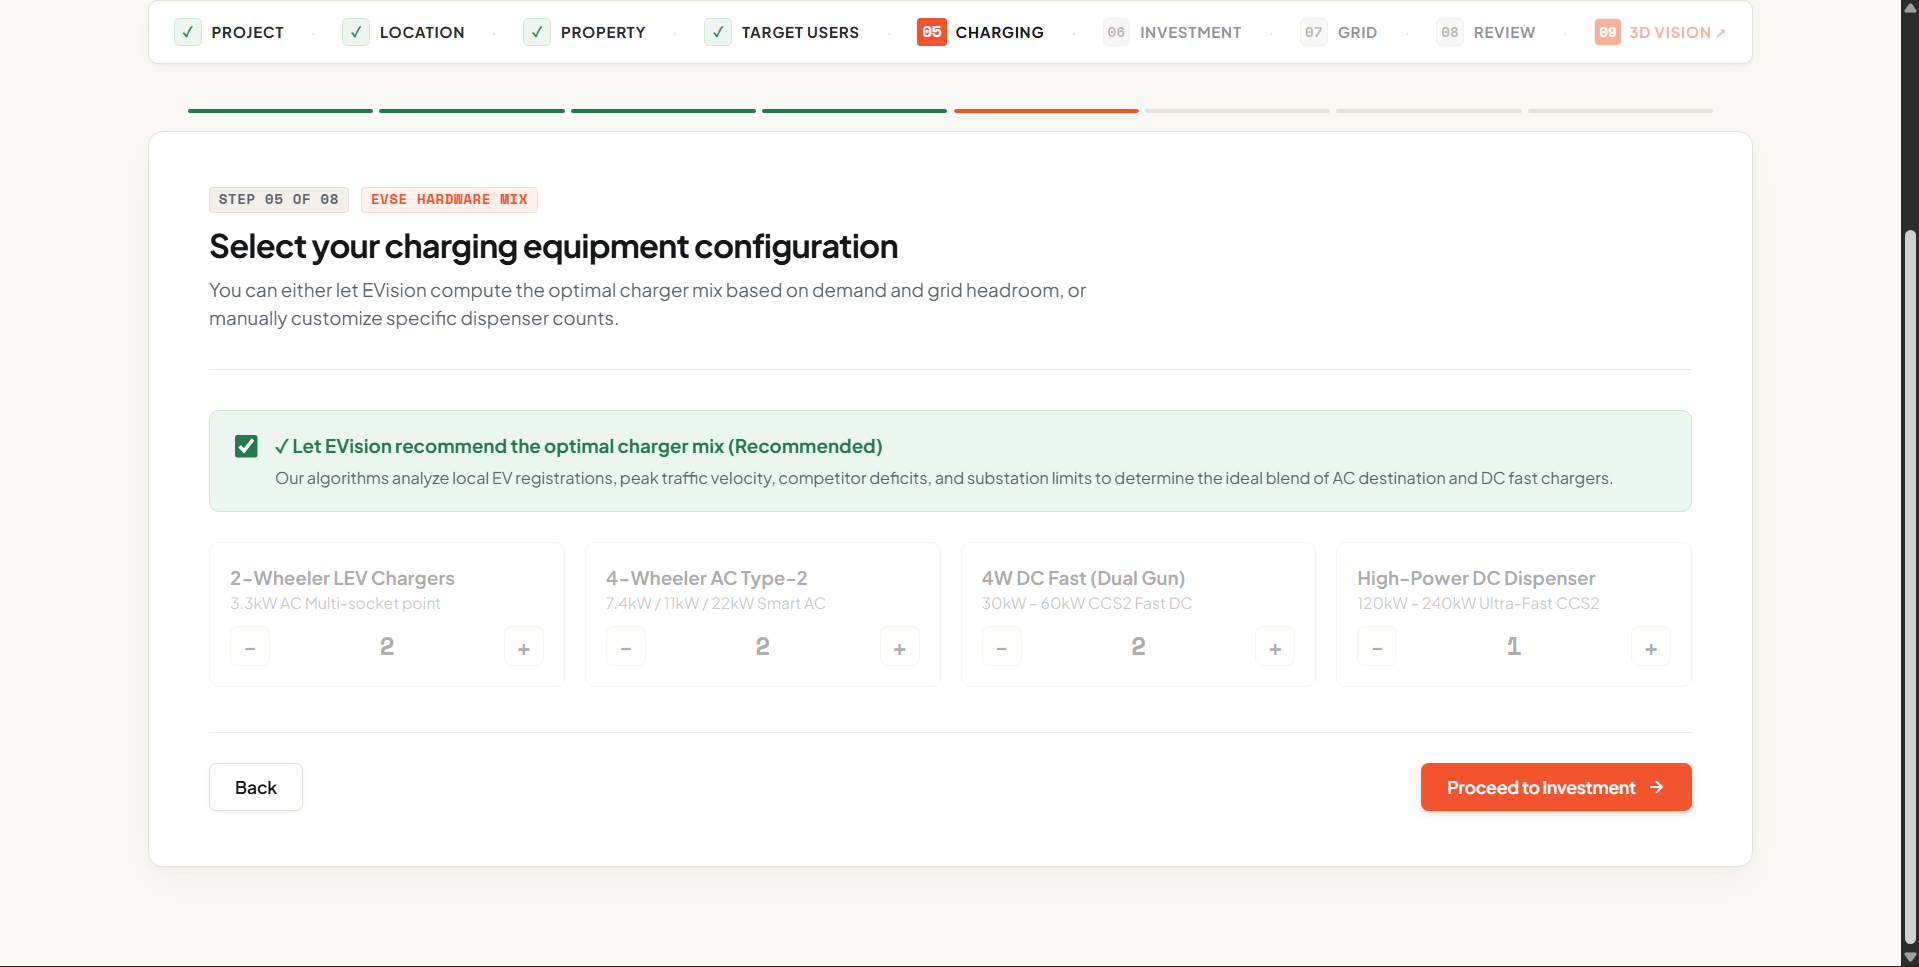
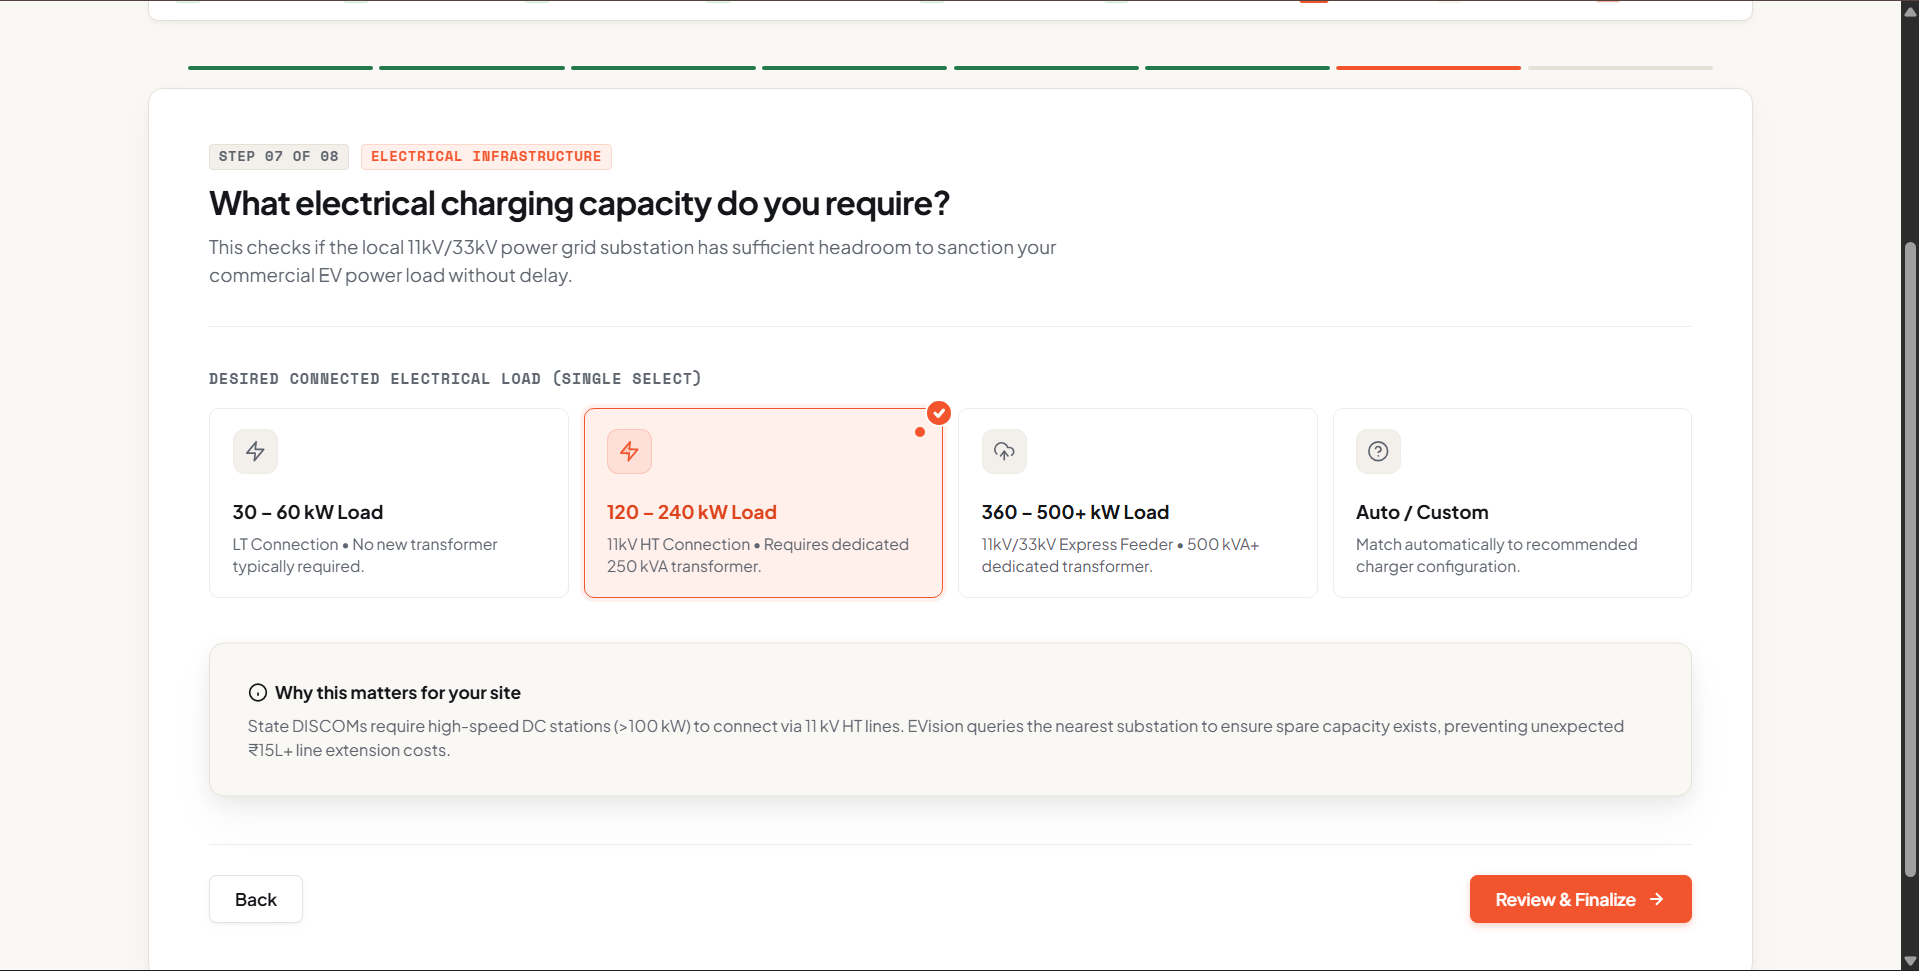
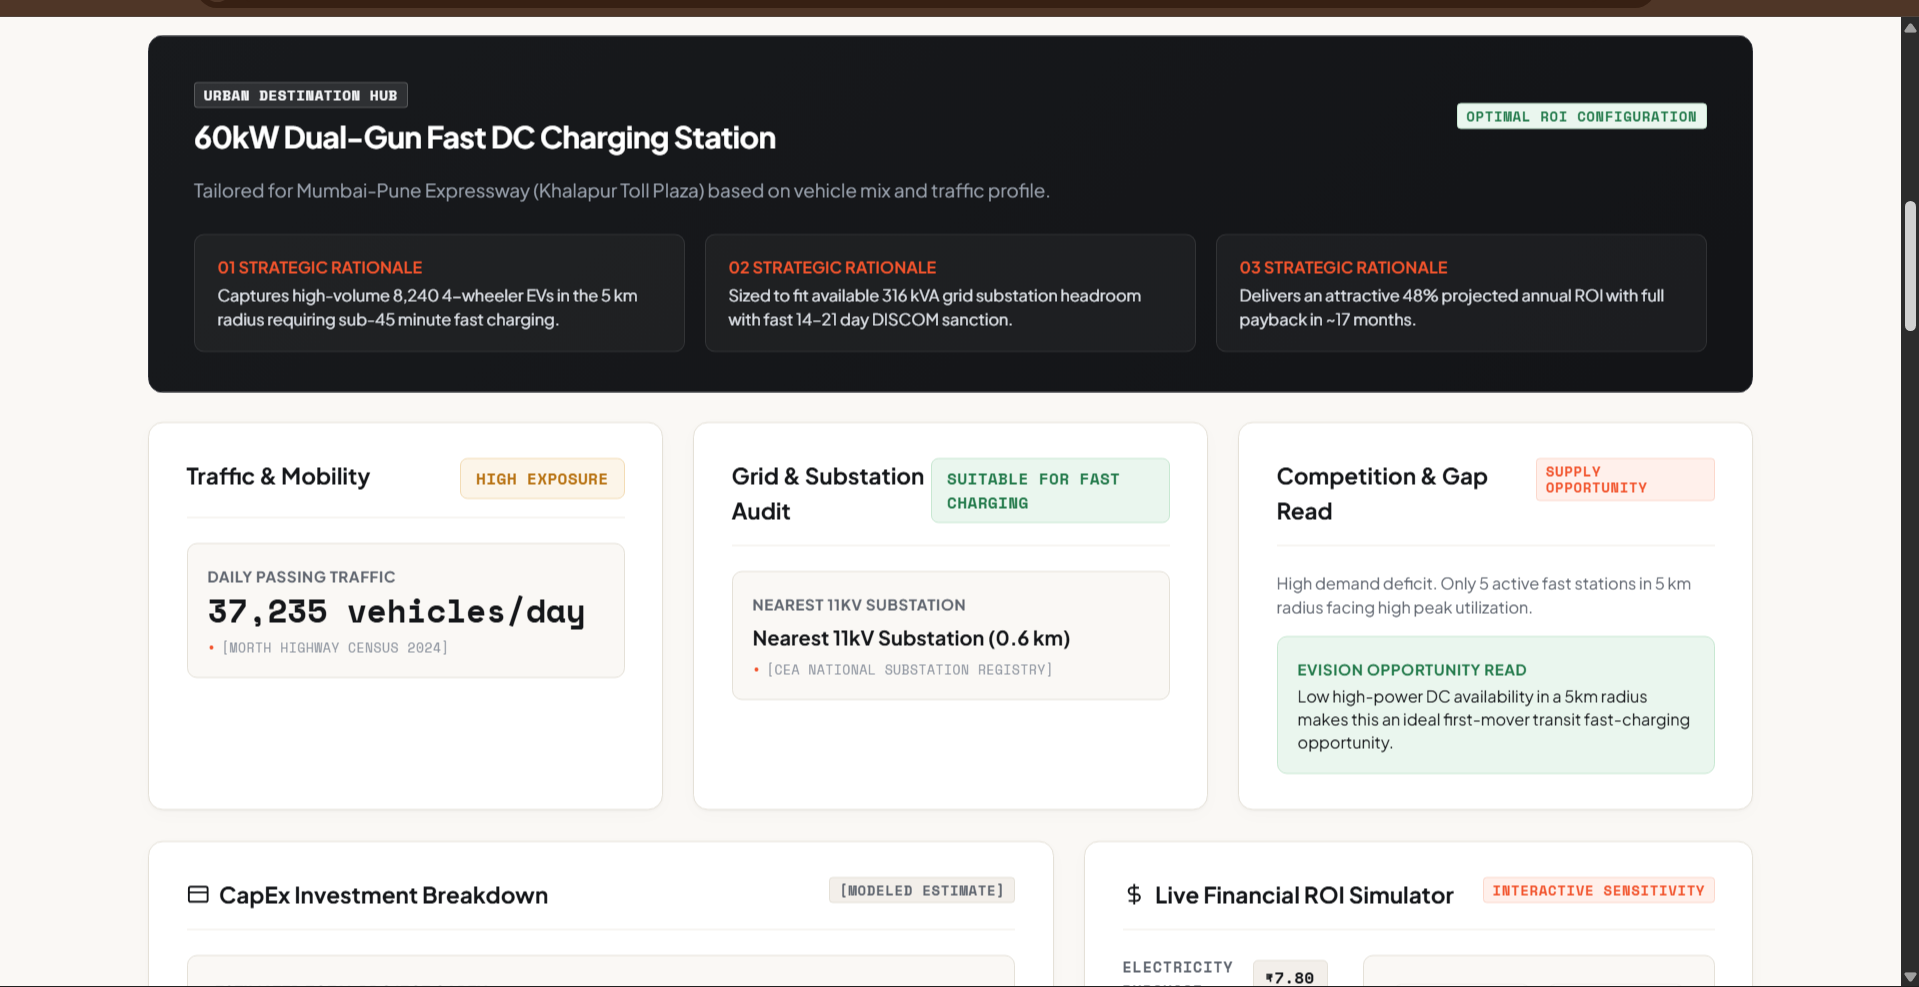
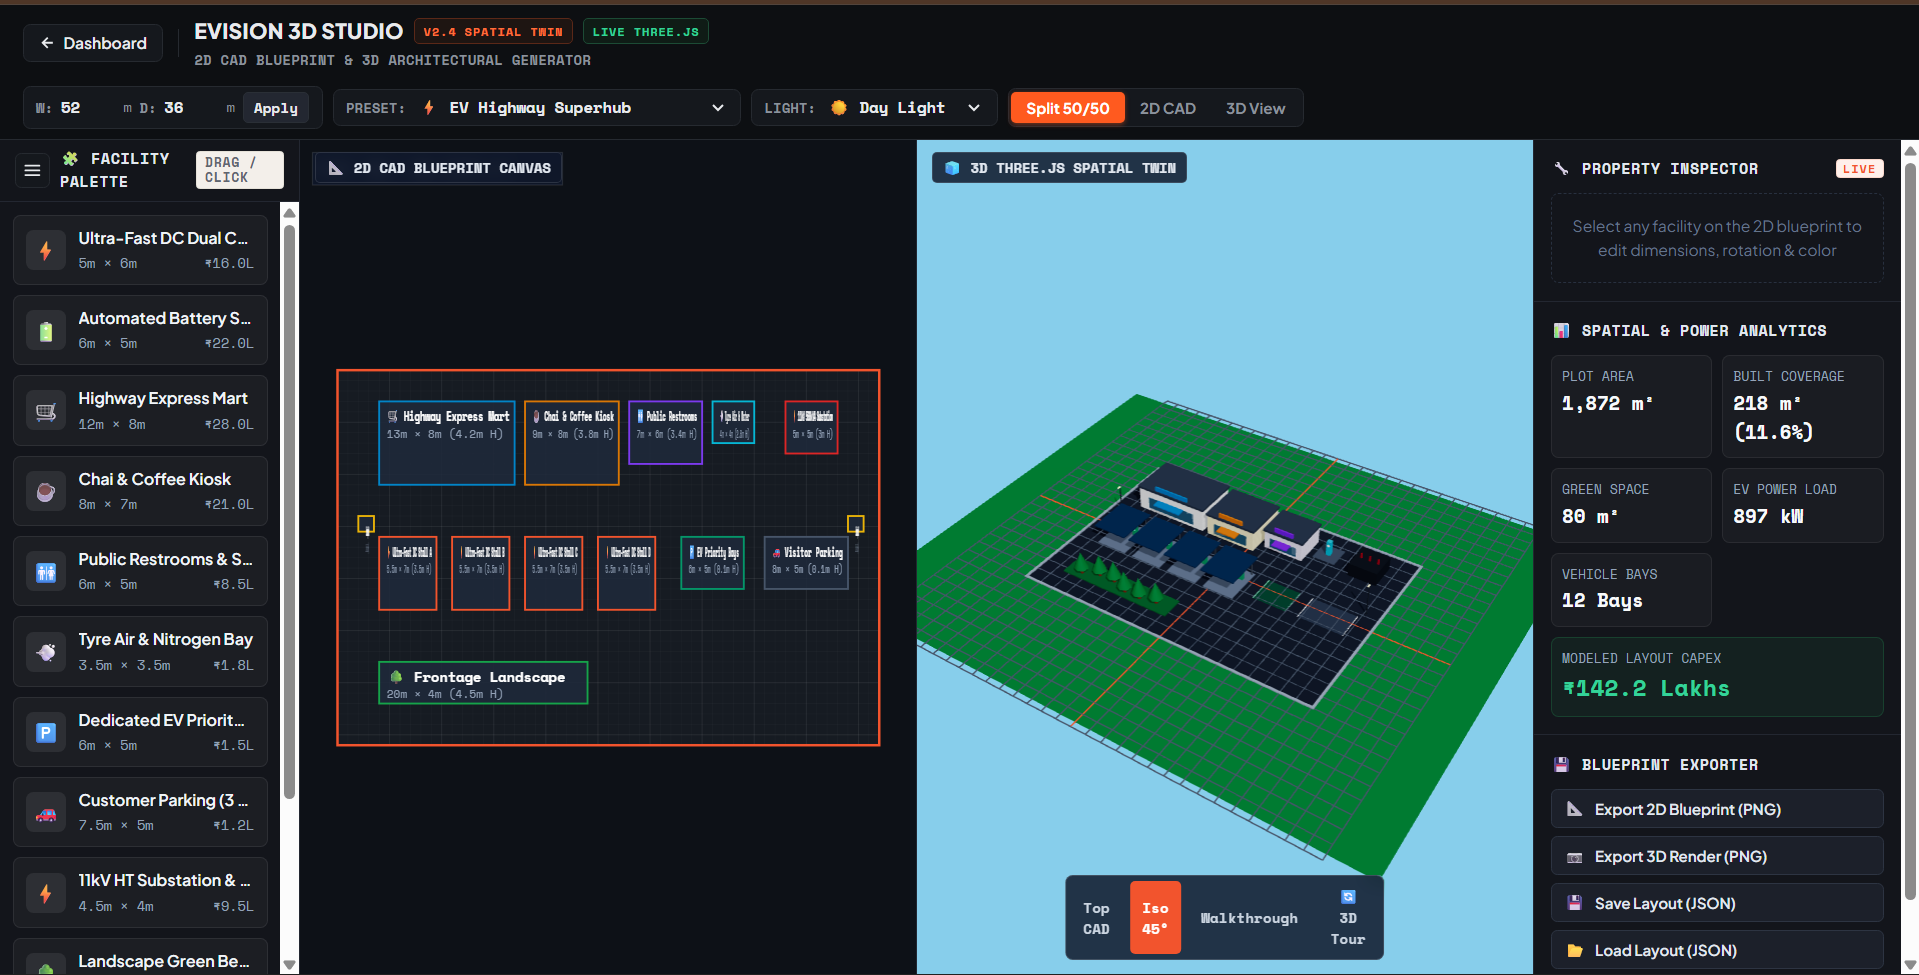
- Configure the charging setup, including charger type, number of charging points, and investment budget.
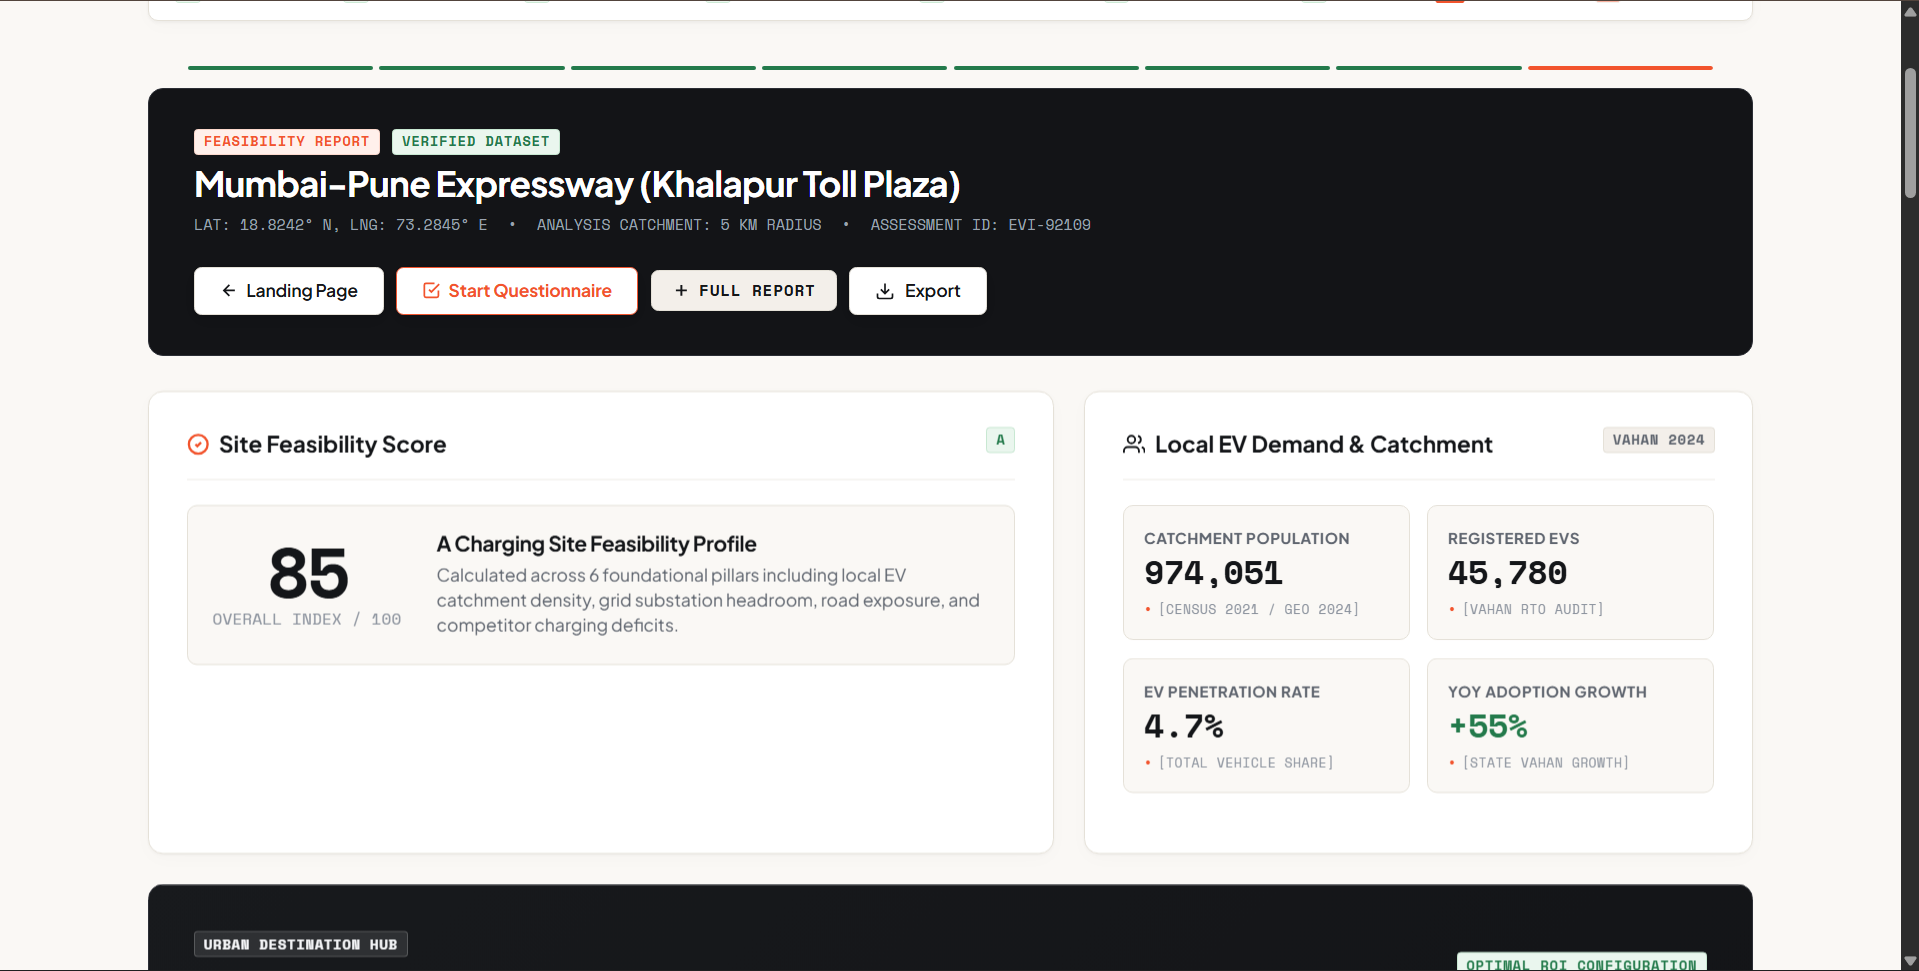
- Estimate potential revenue, demand, ROI, and payback.
- Compare different locations and configurations before making a decision.
The goal is not simply to find locations with many EVs. We want to identify locations where EV demand and infrastructure gaps create a meaningful opportunity.
How we built it
We built EVision as a full-stack data and AI platform.
The system combines several data sources, including Indian vehicle registration data, RTO information, OpenStreetMap geographic data, and charging-station information.
For the location recommendation system, we engineered a Hotspot Score from 0–100 using factors such as EV volume, EV penetration, vehicle-category volume, and EV growth.
We trained and compared multiple regression models:
- Random Forest
- XGBoost
- LightGBM
- Ridge Regression
The Random Forest model was selected as our final model because it achieved the highest R² score on our group-based test set.
The final model achieved:
- MAE: 2.7347
- RMSE: 4.2075
- R²: 0.8744
The trained model is saved and served through our backend, allowing the website to request predictions dynamically rather than using hardcoded results.
We then connected the model to an interactive map so that predictions can be displayed geographically.
We also added an AI research layer using the OpenAI API. This provides features such as:
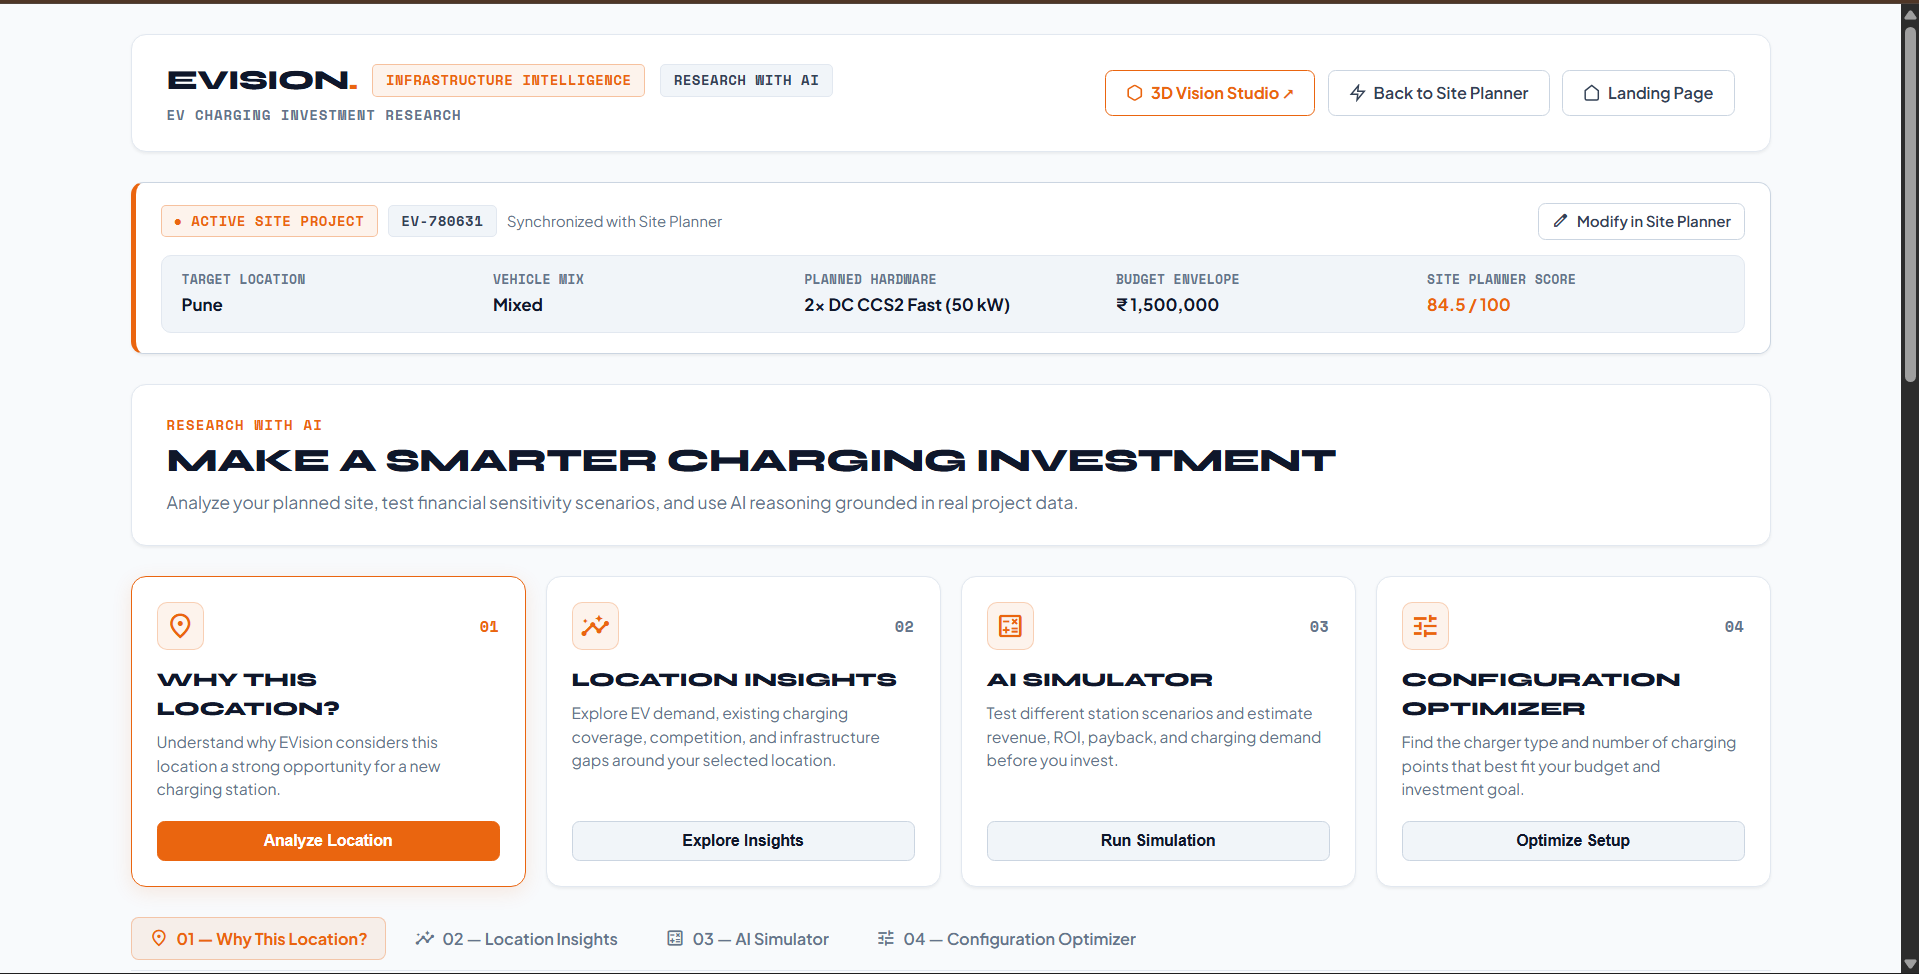
- Why This Location?
- Location Insights
- AI Simulator
- Configuration Optimizer
This allows users to understand the recommendation instead of simply seeing a number.
Challenges we ran into
Creating a meaningful prediction target
The vehicle-registration dataset did not contain a ready-made target saying which location was the "best" place for an EV charging station.
We therefore had to engineer our own hotspot score using multiple demand-related factors.
Preventing data leakage
The dataset contained repeated information for the same RTO offices over time.
A normal random train/test split could allow information from the same RTO to appear in both training and testing data.
To reduce this problem, we used a group-based train/test split based on RTO offices.
Combining different types of data
Another challenge was connecting structured vehicle-registration data with geographic information.
The registration data identifies RTOs, while the map requires geographic coordinates. We therefore had to connect the RTO information with geographic locations before displaying the results on the map.
Turning ML predictions into something useful
A model score by itself is not very useful to a business owner.
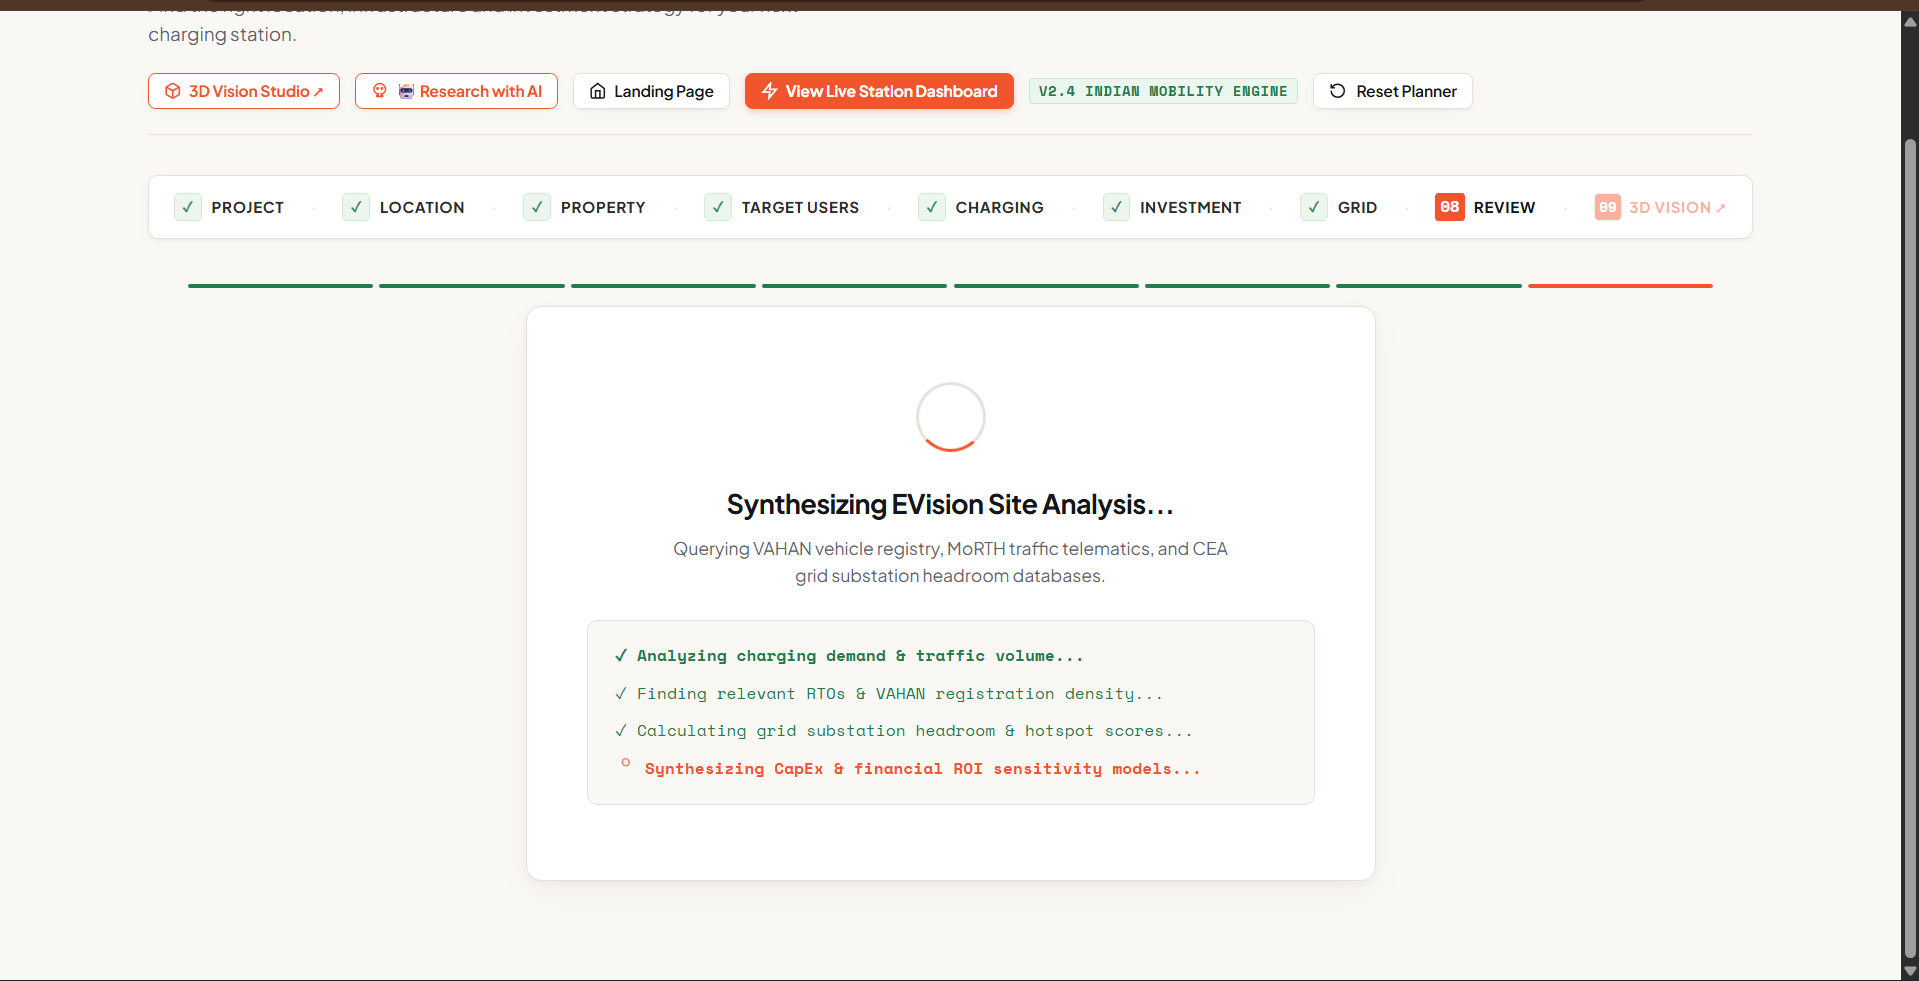
We therefore built the project around a complete workflow:
Discover → Compare → Select → Configure → Simulate → Decide
This turns the machine-learning output into an actual decision-support tool.
Accomplishments that we're proud of
We are proud that EVision became more than just a machine-learning model.
We connected:
Real-world data + Machine Learning + Backend APIs + Interactive Maps + AI + Business Simulation
into one working platform.
Some of the things we are particularly proud of are:
- Building a complete EV charging location recommendation workflow.
- Training and evaluating multiple ML models.
- Achieving an R² of 0.8744 with the final Random Forest model.
- Using a group-based split to evaluate the model on unseen RTO groups.
- Connecting the trained model to a backend API for real-time predictions.
- Visualizing charging infrastructure and recommendations on an interactive map.
- Adding an AI layer that can explain and analyze locations.
- Building a station configuration and financial simulation workflow.
What we learned
The biggest thing we learned is that building an AI product is much more than training a model.
We learned how to take a problem from:
Raw Data → Data Processing → Feature Engineering → Model Training → Evaluation → Backend API → Frontend → User Decision
We also learned about:
- Regression models
- Feature engineering
- MAE, RMSE and R²
- Data leakage
- Group-based model evaluation
- Model serialization
- API-based ML inference
- Geospatial visualization
- Combining ML with generative AI
- Turning technical predictions into understandable business insights
Most importantly, we learned that a technically accurate model is only useful when the user can actually understand and act on its results.
What's next for EVISION
EVision can be expanded by adding more real-world data and making the predictions increasingly location-specific.
Future versions could incorporate:
- Real-time EV charging-station availability
- Traffic density
- Electricity tariffs
- Land and rental costs
- Grid capacity
- Real-time EV movement
- Local business activity
- Weather conditions
- Historical charging demand
We also want to improve the financial simulator so users can test different business scenarios and compare multiple locations side-by-side.
Our long-term vision is to turn EVision into a complete EV infrastructure intelligence platform that helps businesses, investors, and infrastructure planners answer one question:
"Where should the next EV charging station be built to create the greatest impact and business value?"
Built With
- api
- artificial
- css
- geospatial
- html
- intelligence
- javascript
- joblib
- leaflet.js
- learning
- lightgbm
- machine
- numpy
- openai
- pandas
- python
- scikit-learn
- xgboost


Log in or sign up for Devpost to join the conversation.