About the Project
Inspiration
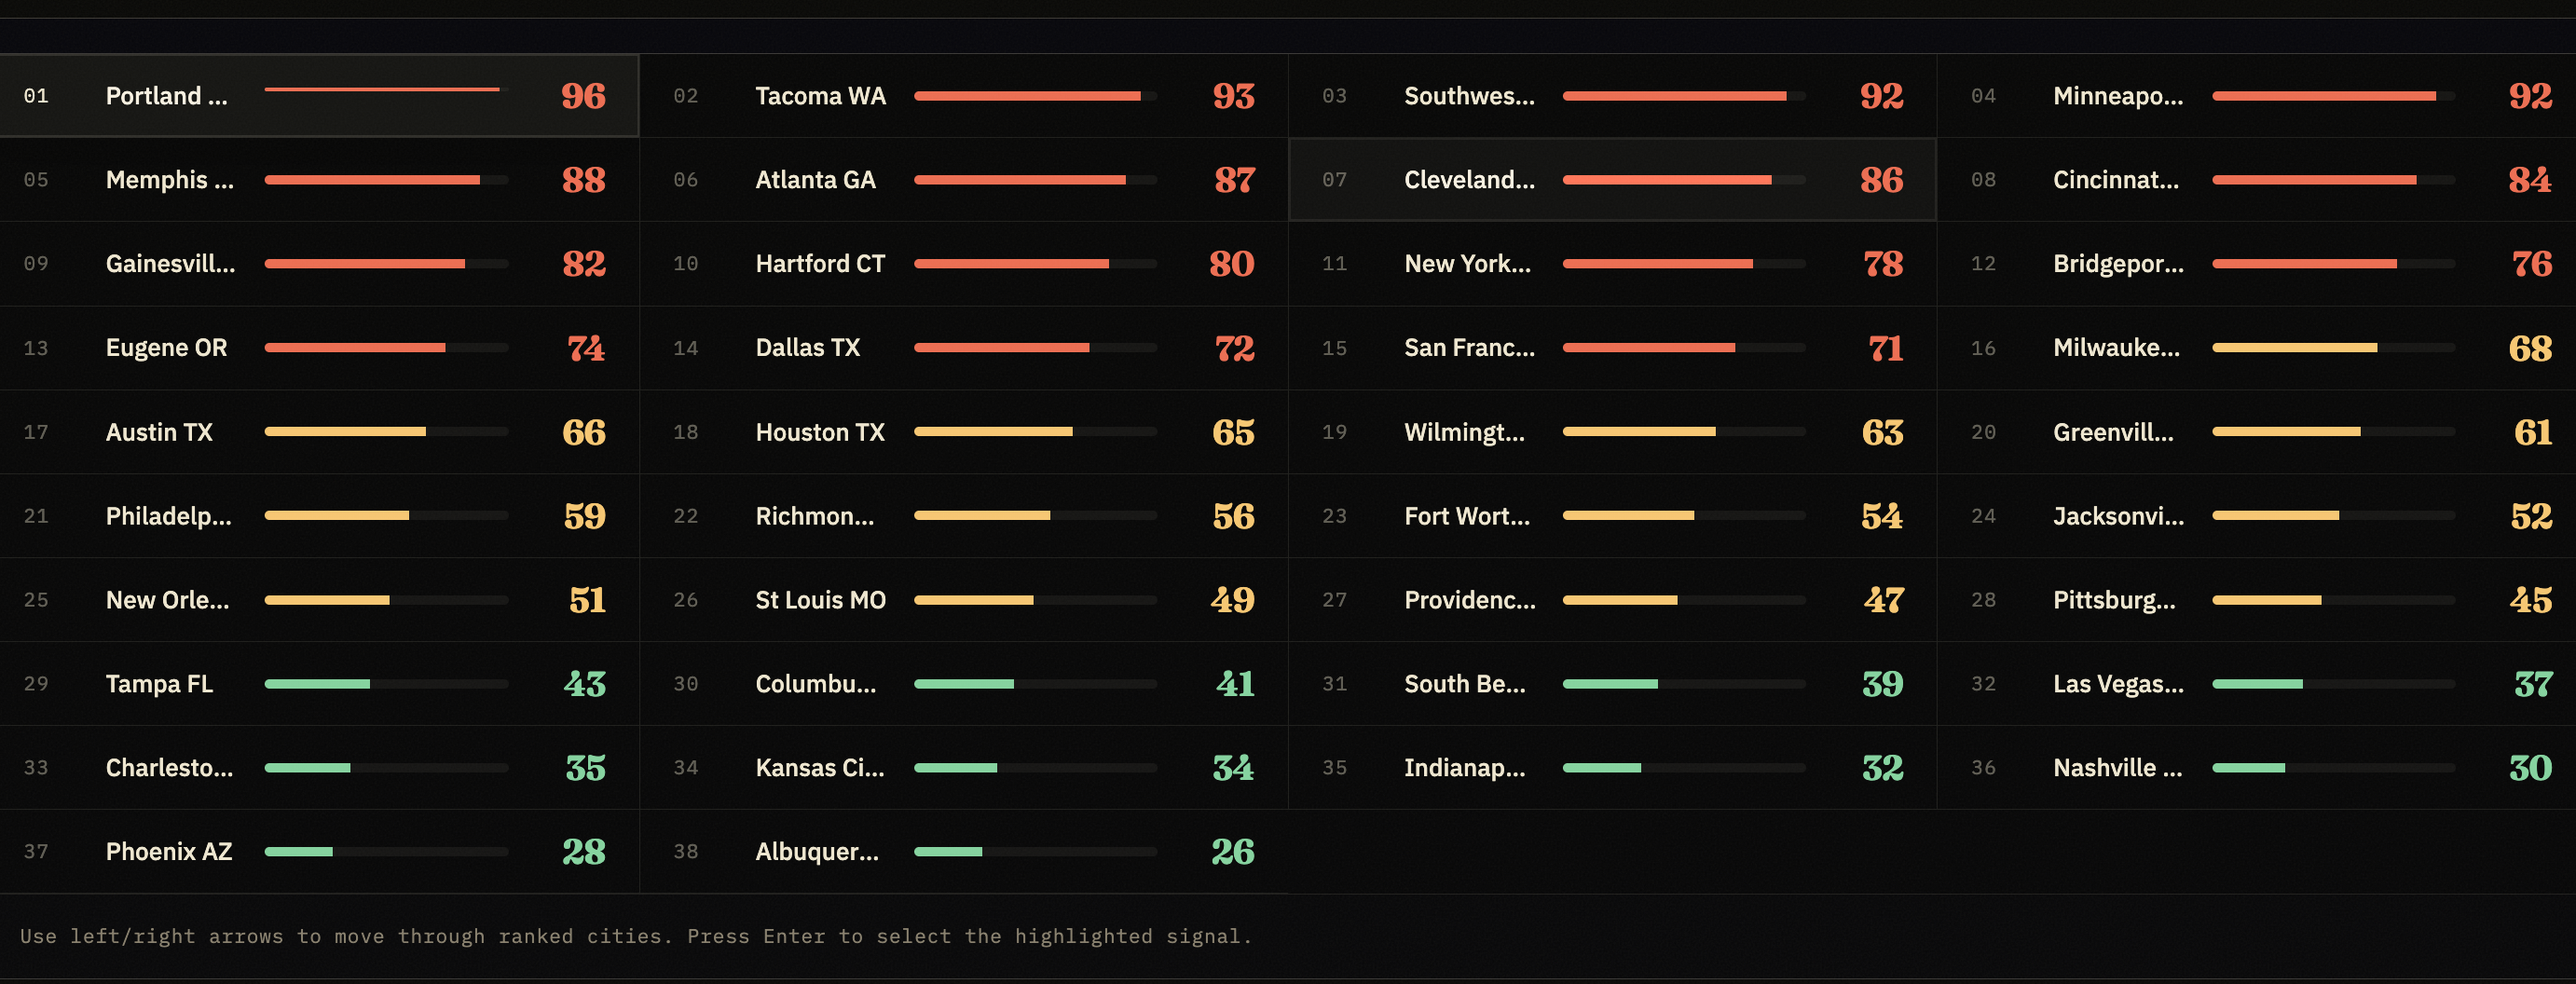
Every one of America's 3.6 million annual evictions starts as a data signal weeks before they reach court. For the first time, legal aid teams and city housing offices can see that signal, ranked through rent burden, poverty, and filing momentum, before families lose their homes.
What I Built
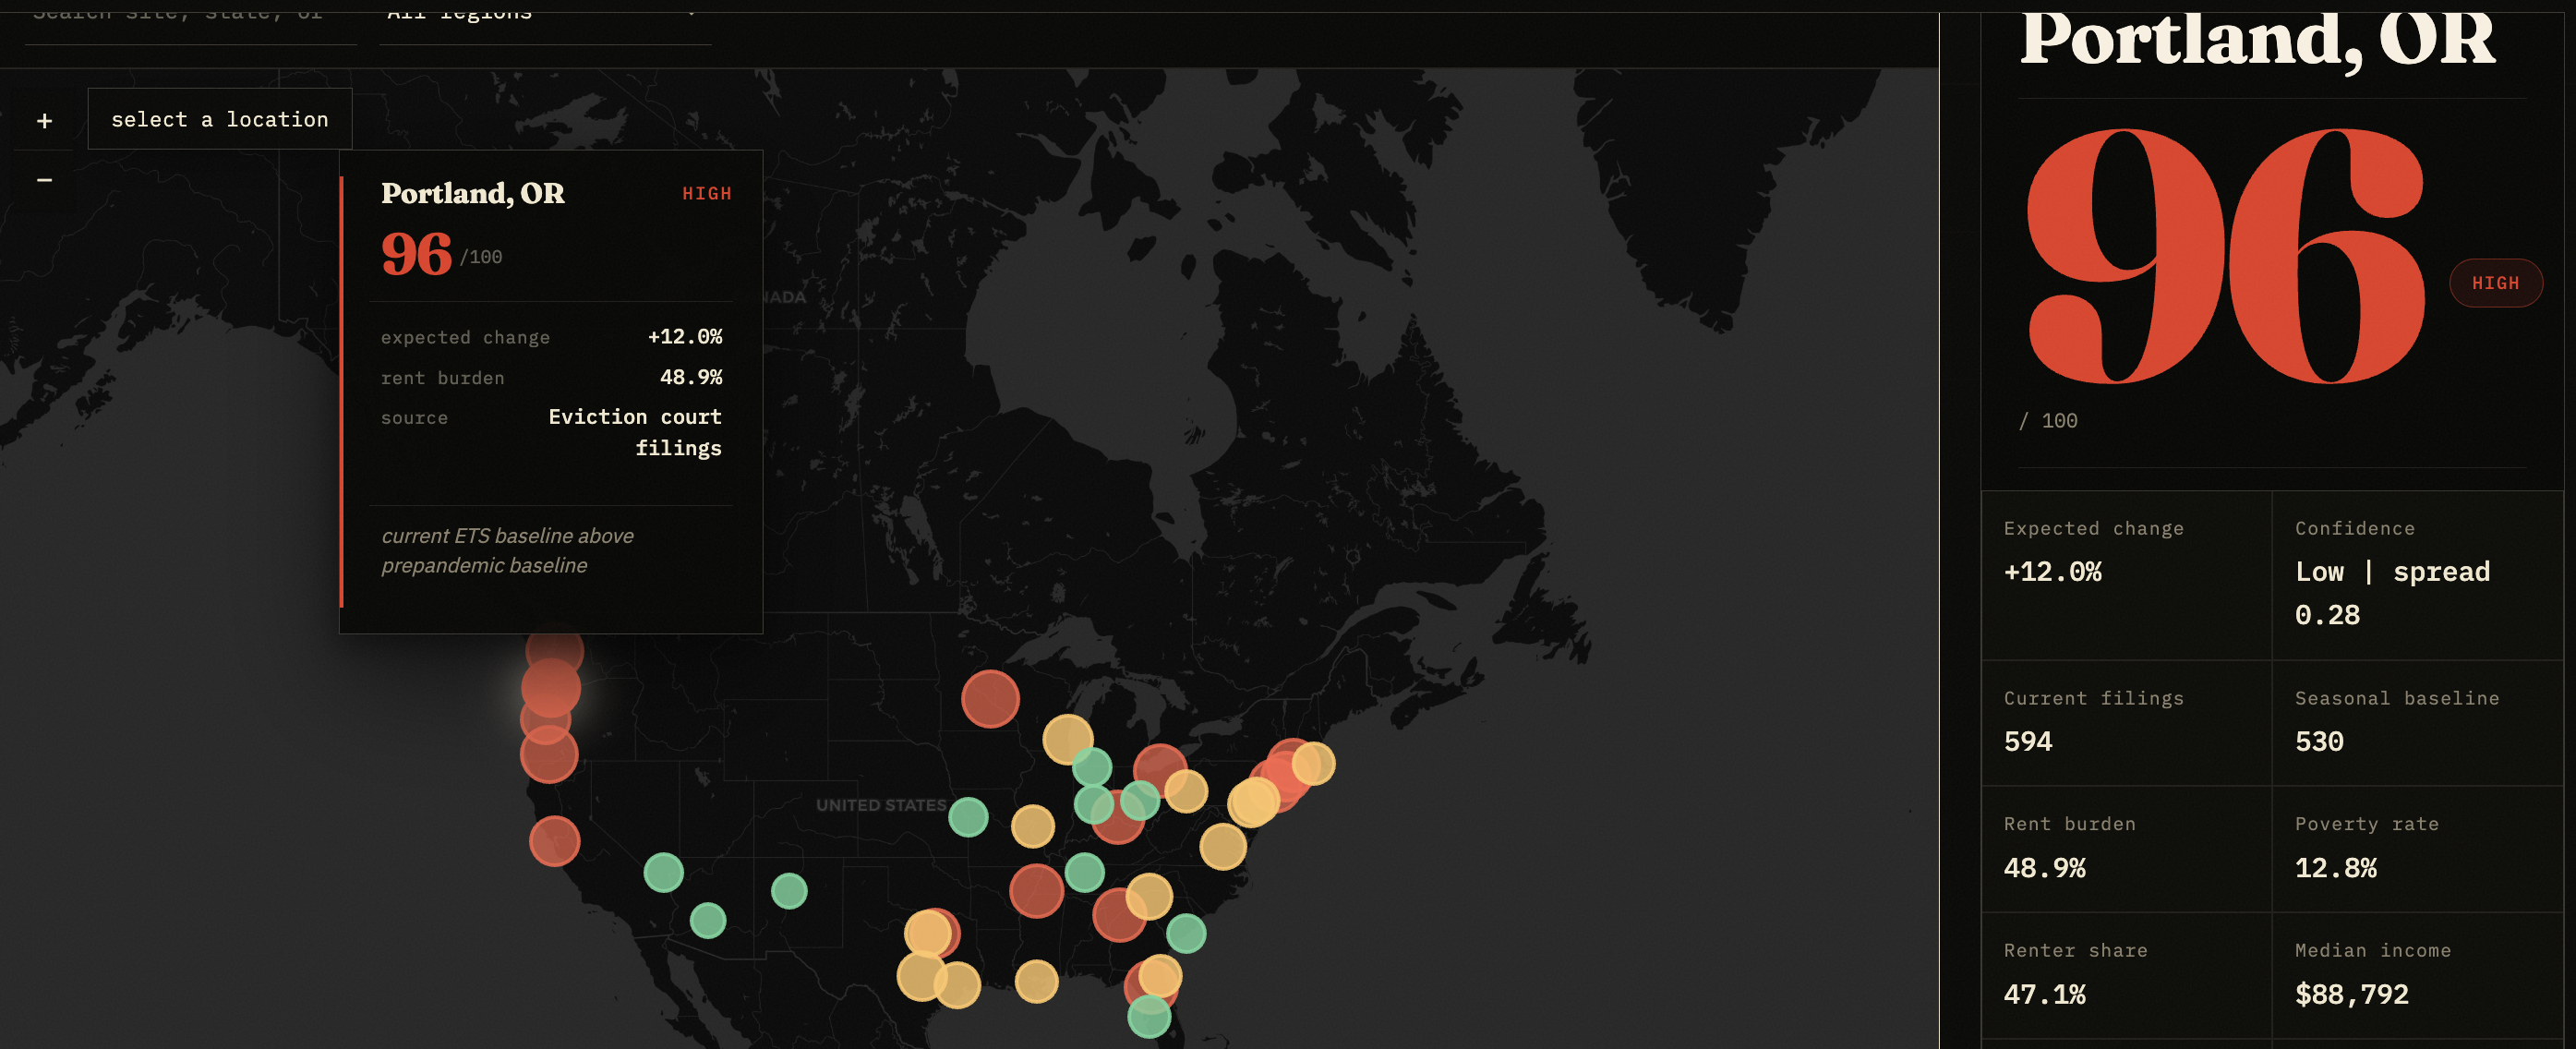
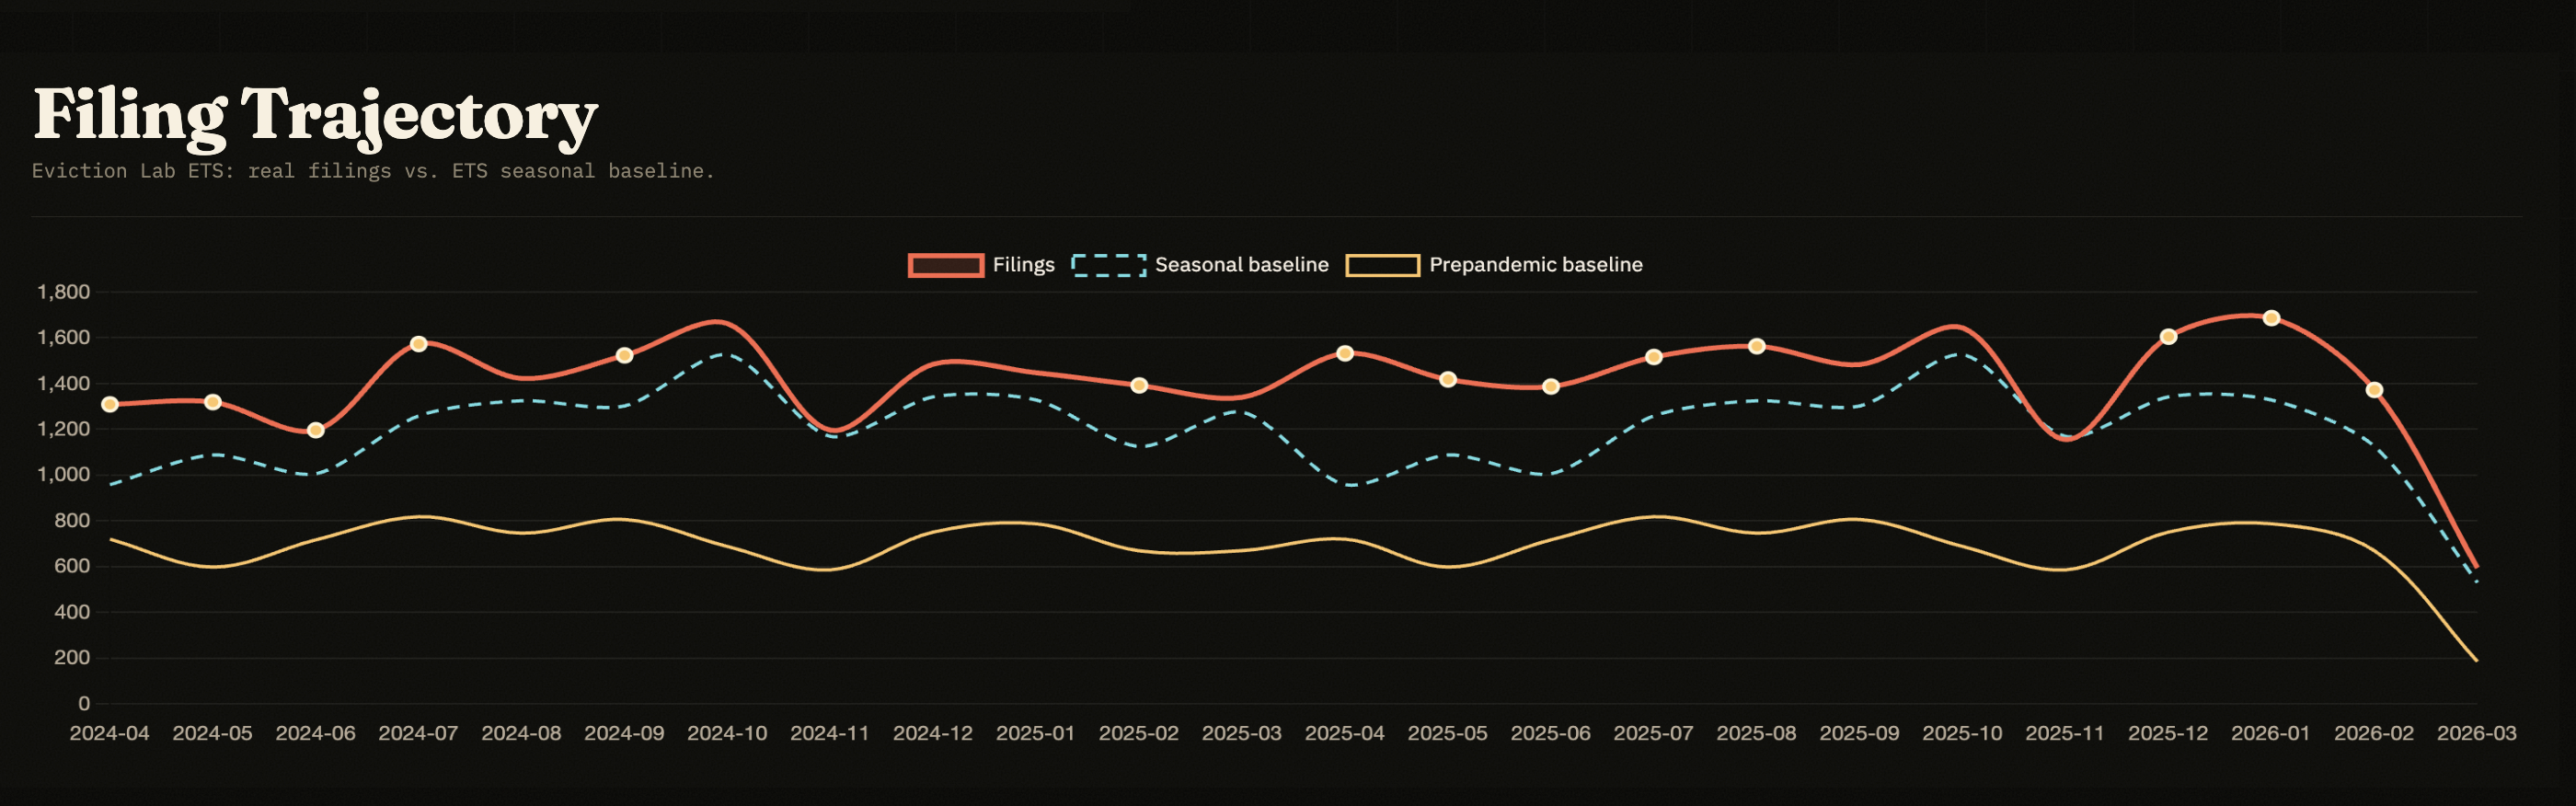
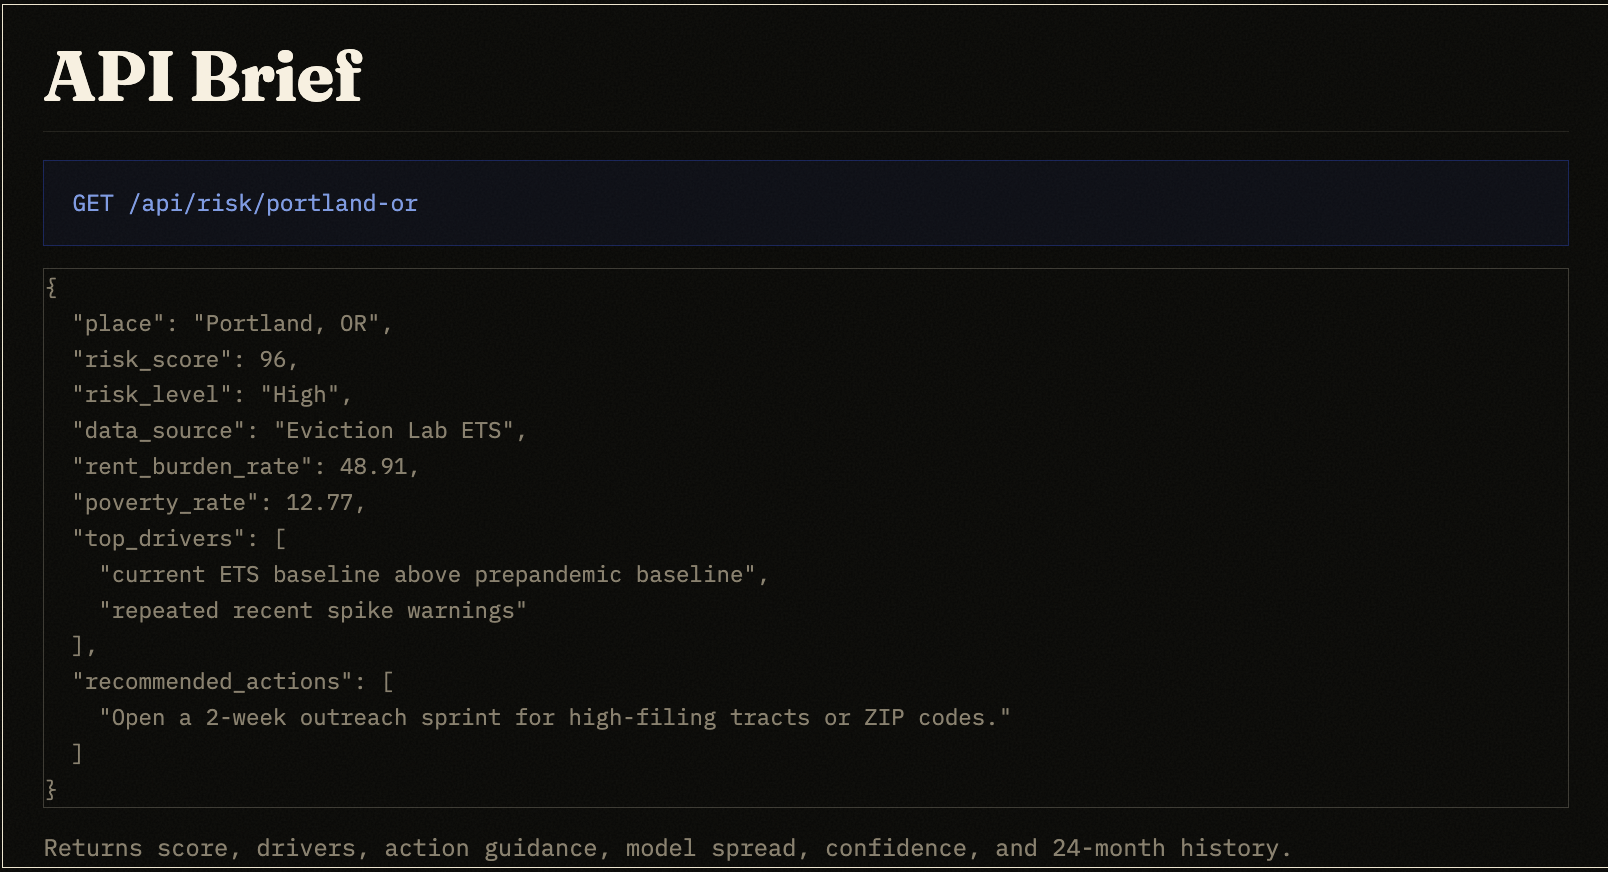
Eviction Pressure Radar covers 38 U.S. cities. It combines Eviction Lab ETS court filings, San Francisco Rent Board eviction notices, and Census ACS renter vulnerability data to produce an explainable 60-day Eviction Pressure Score, with top drivers, a confidence label, recommended actions, and a 24-month filing history, for each tracked site.
How I Built It
Flask backend, pandas + scikit-learn pipeline, Leaflet, and Chart.js frontend. The model uses 14 signals per site-month, including filing momentum, baseline breaks, volatility, and an ACS vulnerability index:
$$\text{ACS Vulnerability Index} = 0.42 \times \text{rent burden} + 0.32 \times \text{poverty rate} + 0.26 \times \text{renter share}$$
A balanced logistic regression handles explainability; a balanced random forest (220 trees, depth 6) adds predictive power. The ensemble is backtested against a naive momentum baseline with recall prioritized so outreach teams miss fewer emerging signals.
Challenges
The hardest challenge was deciding which cities to include. The Eviction Lab ETS covers dozens of tracked sites, but coverage quality varies; some cities have dense tract-level filing records, others have sparse or inconsistent monthly data. I filtered to the 38 cities with the strongest 12-month filing volume, then added San Francisco as a supplemental source using official Rent Board eviction notices to fill the California gap the ETS doesn't cover.
What I Learned
The biggest thing I learned is that public data, stitched together the right way, can take on massive problems that feel too large and multifaceted to quantify.
Built With
- census-acs-api
- chart.js
- datasf
- eviction-lab-ets-api
- flask
- gunicorn
- leaflet.js
- numpy
- pandas
- python
- scikit-learn
- zerve


Log in or sign up for Devpost to join the conversation.