-
-
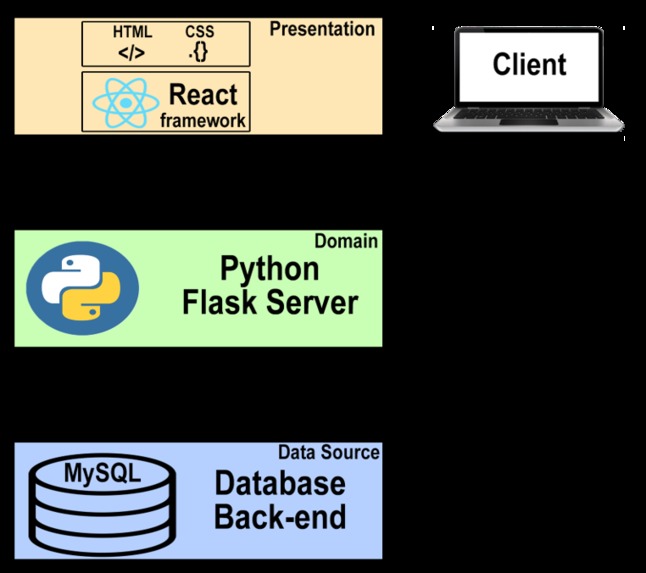
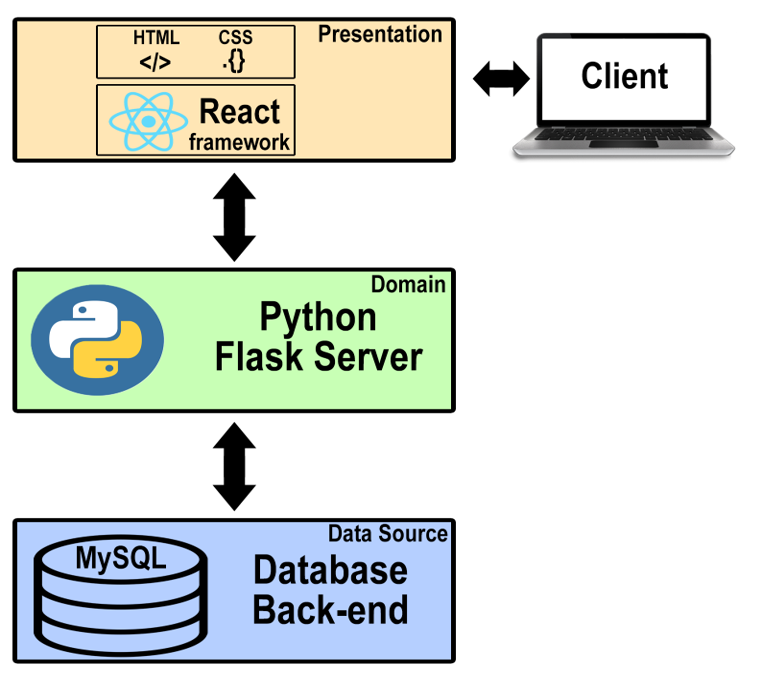
System Architecture
-

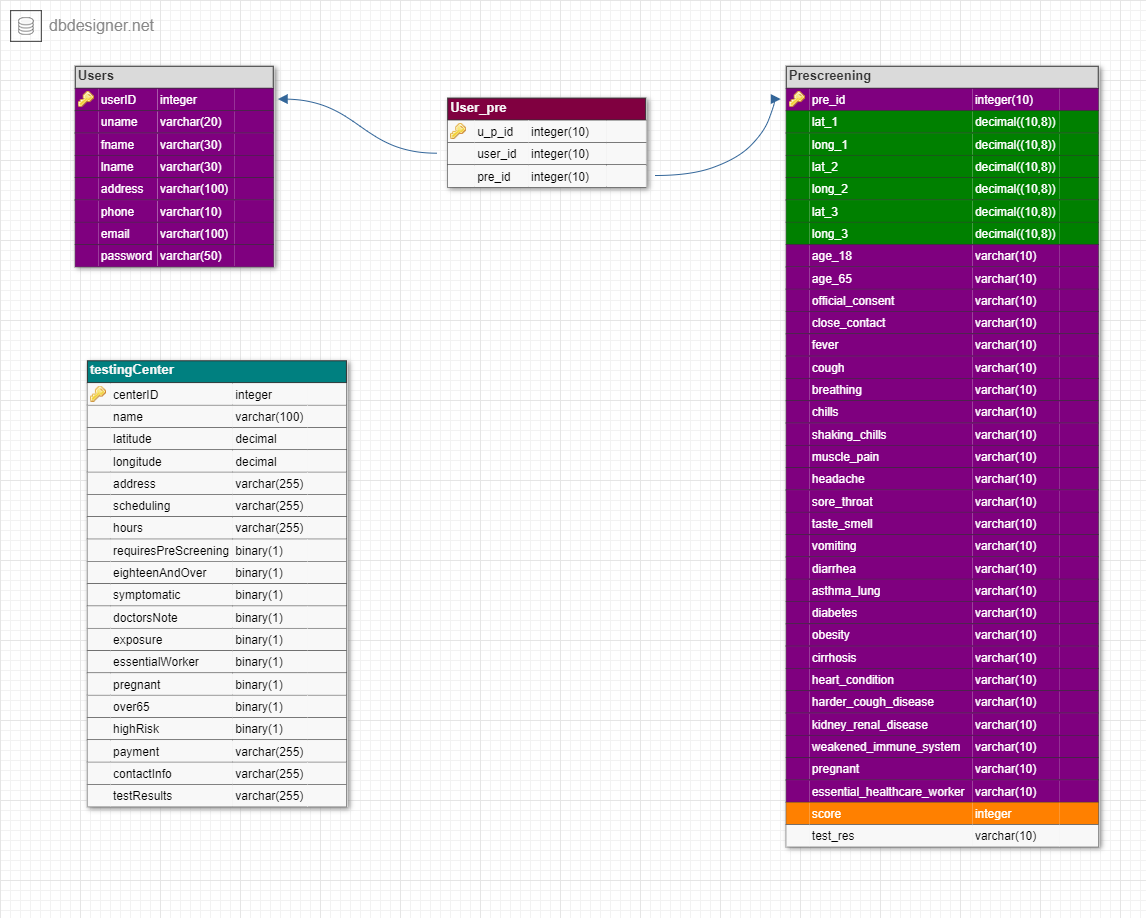
Database Schema
COVID-19, the illness caused by the novel coronavirus, has brought unprecedented conditions around our ever changing world. This pandemic has proven to have control over human habits, as it seemingly puts nations on pause during its surges. As case numbers fluctuate around the globe due to high transmission rates, many people find themselves fearful, anxious, overwhelmed, and unsafe. With the future seeming more unknown than ever, we wanted to focus on creating a solution that both mitigates the negative emotions caused by the coronavirus, and that limits the outbreak of this and future pandemics.
Our solution is a web application, called “Everything COVID-19”, that focuses its scope on Indianapolis, IN. With our research and IU Health interview, we realized that there are over 200 test sites around the state of Indiana; all of these test sites possess a variety of requirements and information. The problem here is not the lack of tests available, but rather the average citizen knowing what test site is best for him/her to visit. Everything COVID-19 will provide you with the test site best for you while factoring in location, symptoms, healthcare provider, test type, essential worker?, etc.
The secondary aspect of value brought through Everything COVID-19 is a data visualization map which shows symptomatic and positive cases of the coronavirus in Indianapolis; the unique part is the detail and intricacy that will show what grocery stores, gyms, restaurants, etc. have the most cases. This side of our solution is focused on not only mitigating outbreak surges, but also providing citizens of Indianapolis, IN with more positive emotions driven by an increased feeling of safety where you visit.
We collaborated as a team on the problem statement given by TechPoint on outbreak detection. As the Coronavirus has brought immense change and countless challenges around the world, we quickly agreed (as a team) that solutions aimed towards the problems created by COVID-19 are extremely valuable and impactful. When initially assessing the problems associated with COVID-19, we turned to testing across the state. When we were evaluating ideas, we had the privilege of interviewing Maura Newell at IU Health, who has been in charge of setting up satellite testing sites across Indiana. This meeting/discussion proved extremely valuable as we learned that, in contrast to our initial thought, testing sites are prevalent across the state with more than 200 locations. It is also easy to make an appointment to get a test versus simply a ‘drive-up test’. This led us to veer away from our idea focused around appointment creation (‘fast passes’) for a COVID-19 test. The first problem we defined was that COVID-19 pandemic data is lacking. There is no data beyond case numbers by county, and data is not being used to make the public feel/act safer. The second problem is that there is an underutilization of COVID-19 test site information. Test site requirements vary greatly and sometimes the closer sites are not necessarily the best fit. The typical Hoosier will feel overwhelmed by all of the test site choices and not knowing which one works for them based on the test requirements and the person’s needs. Thanks to Maura Newell, we were connected to a website and database which possesses all of the test site locations and their various requirements.
As our team analyzed the problem we came up with merit criteria, which included the following: easy/quick accessibility, informative, and understandable. With this criteria in mind, we planned on creating a web application that provides the user with a COVID-19 pre-screening form which includes questions allowing us to pair him/her with the best fit test site. The ‘best fit’ test site is generated for the user by a variety of factors taken into account through user input in the pre-screening form. The second aspect of our solution is visualizing intricate outbreak information for Indianapolis, Indiana. As users are matched with the ideal testing site for them, they provide their public whereabouts over the past 48 hours (of the pre-screening) if they are symptomatic. This allows us to visualize this information and show the citizens of Indianapolis where symptomatic people recently went out to eat, got groceries, casually shopped, etc. When users get their test results back, they can quickly notify us so that we can either remove their mark from the map, or change their ‘COVID-19 Symptomatic’ mark into a ‘COVID-19 Positive’ mark.
COVID-19 impacts any and all people of this world. As we focus on the scope of Indianapolis, Indiana, we are confident that our product and venture will make an impact on ALL of the people in the state’s capital. Our web application will prove beneficial to those that need tests for work, school, etc., are symptomatic, or are simply curious if they have or had the Coronavirus. This web application will also serve those who are cautious and worried about leaving their home and going out in public. The data visualization will help them see where they can go with less risk of being exposed to COVID-19; this will consequently lead to less negative and more positive emotions. In conclusion, our focus is to serve all of the people of Indianapolis, IN and help mitigate whatever impact COVID-19 has had on their lives. We know what groups will be most frequent in using our web application, but believe that everyone (in the city) is in our market space as COVID-19 has proven to affect the lives of all of us.
After our go-squad met up with Maura Newel with IU Health, we knew we had to tackle a different (bigger) problem. This ended up leading to the pro-squad stripping the previous work they had done in order to adapt to the new plan. After learning about the website ISDH, the pro-squad was able to gather information on testing sites and implement it into the webapp through data integration. Before we moved forward on building the web application and it’s features, we collaborated together (as an entire team) to discuss our idea, potential challenges and divided up tasks. The go-squad worked on developing a business plan and how to turn our solution into a venture. Our extremely supportive and helpful coaches from Cummins and Apex Benefits informed us of how imperative it is to have an ‘MVP’, or minimum viable product. This allowed us to clearly convey to the pro-squad what value the web application is intended to create.
Creating a complete pre-screening form that would serve its purpose was an important step of front-end development/design. This pre-screening form had to include questions to answer and provide clarification on all possible test site requirements in the ISDH database. It needed to be welcoming and simple for the user, while being effective in being able to generate the ‘best fit’ test site. The pre-screening form also needed to successfully collect public whereabouts information so that the web app can apply it to the data visualization map, making paths of navigation safer/less risky.
A general prototype was built first as a dummy structure for our web app which includes login, signup, home, test and about pages. A middle layer of python flask server was adjusted to grab the data from the user and insert it into the database. After coordinating with the team members we designed a database schema and then made proper tables with attributes and constraints. User authentication was then done in order to verify user emails and passwords for login and signup pages. Pre screening form was also created in accordance with COVID-19 symptoms and testing site requirements. We improved the CSS of the web application and made it user-friendly. The pre-screening data was then inserted into the database using stored procedures and the data from ISDH was inserted into the database to provide users with the testing site information which would fit their requirements. Pre screening form also asks the locations which the user visited recently, so we made a map feature to update the user location into a colored spot if a user goes to a testing site, takes a test and submits a positive test result. The user can view the map and see the infected places that are colored.
If we had an extra 5 weeks, we would have liked to have made a focus group composed of family and friends to have had a trial run on our app. With this focus team, we would plan to proceed on interviewing the group and getting feedback to see where we could improve. We ran a marketing campaign through LinkedIn which followed the team's progress on the project. Our future plan would be to also use more social media platforms such as Instagram to introduce the team and to update users every once in a while of how data visualization is changing on our webapp. Linkedin account and first of 4 weekly (marketing) articles is under the following link: https://www.linkedin.com/pulse/week-1-tasks-accomplishments-jake-hursh/?trackingId=uf1sICKHSPO7nDXmBseQ4w%3D%3DI.
Our webapp has a successful login page as well as is successfully storing users pre-screening information. It also provides the users with a score on their pre- screening exam based on the number of symptoms they checked off. The database that stores the information on testing sites has been successfully set up and optimized.
Our mapping visualization could be improved upon. The data visualization map is still in the process of being completed to display colorization based off the amount of symptomatic users who have visited the location in the past 48 hours of completing their pre-screening. We would also need to set up a timer for these markers on the data visualization map to change according to the time that has passed since the user has submitted their prescreening. This is in order to provide accurate data to our users. Additionally, we would like to support pagination in the loading of the data for these markers. Currently, all location data is loaded and rendered at once. However, we would like to implement a clever way of loading these markers based on zoom ( like google maps currently does ). Email notifications for users who wanted an update on high to low density of symptomatic users who visit locations that the primary user visits often. Expanding the app to be used throughout the U.S.A working with antibody research is part of our goal with scaling.The pre-screening asks if there has been a previous positive on antibody testing. We would like to expand that section and allow for users to give more information if the response is yes; we could then work with antibody research companies.


Log in or sign up for Devpost to join the conversation.