-
-

Hook
-
Problem
-
What we built
-
Gap

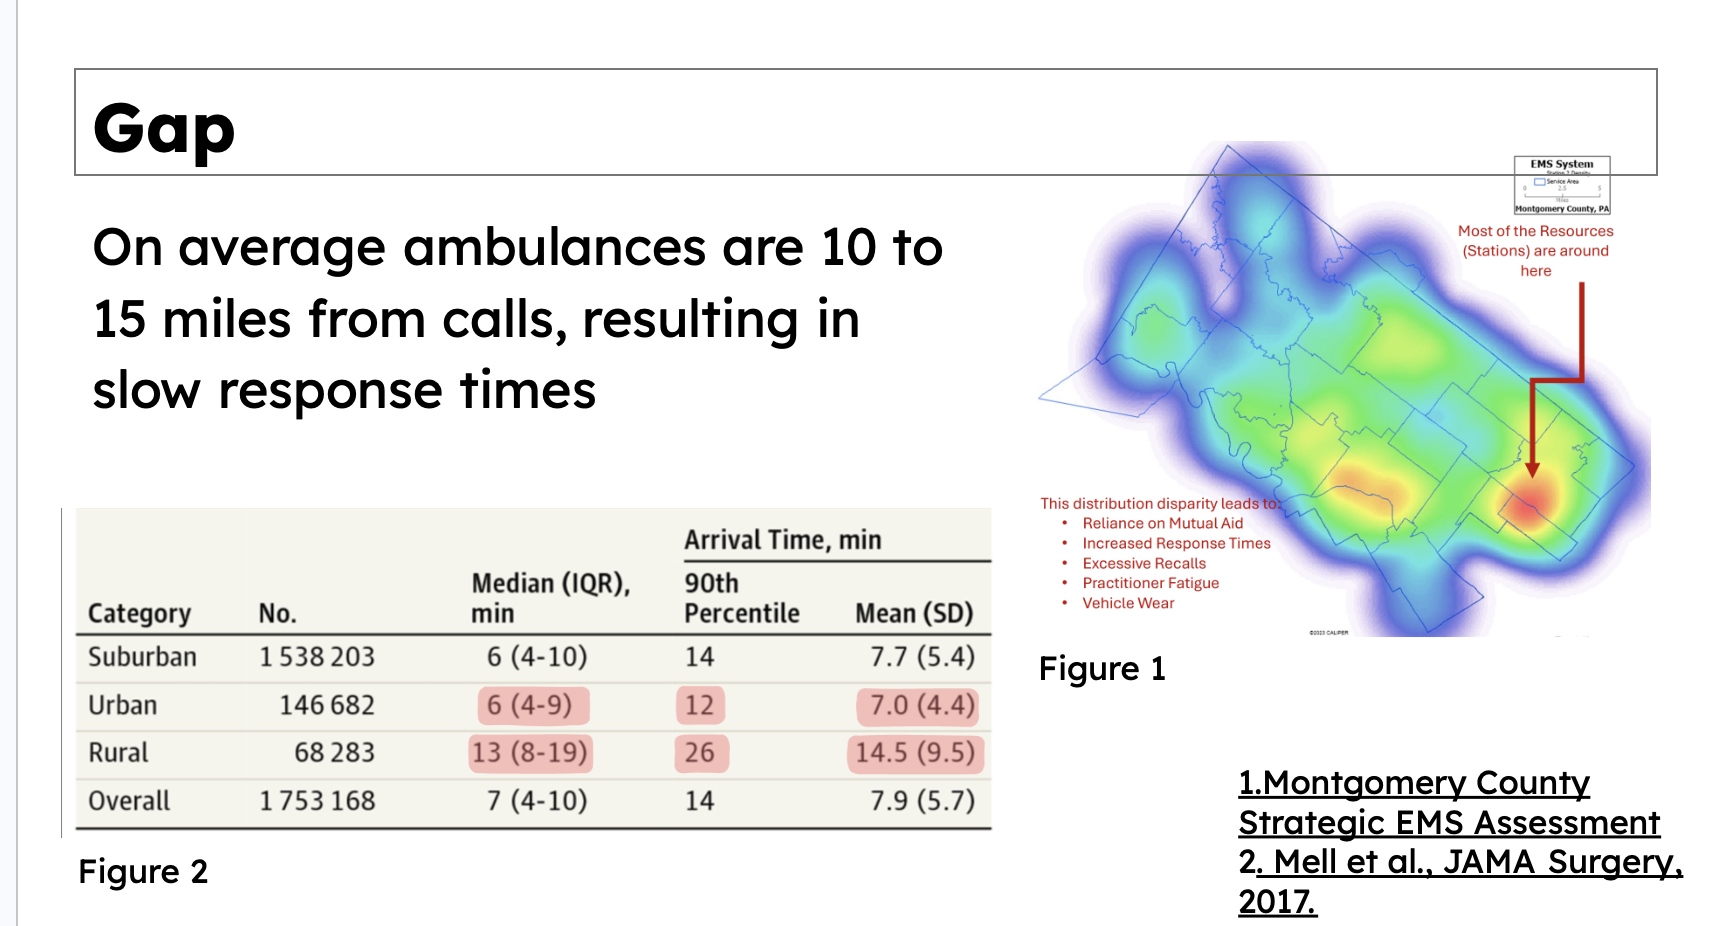
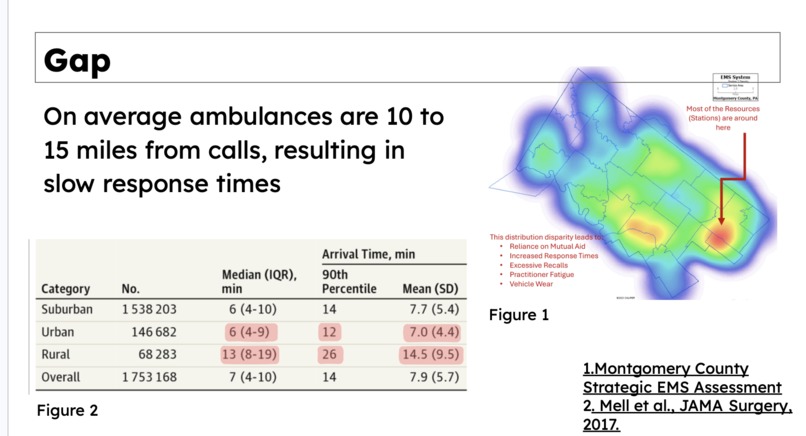
This one started for me in an EMR class at Sierra College, not in a textbook. Part of that class is spending real time around actual ambulance crews, and one thing came up over and over talking to them: they park at the same fixed station all shift, every shift, no matter when or where calls actually tend to happen that day. I asked a couple of the EMTs about it directly, and the honest answer was basically "that's just where the truck lives." Big cities and private EMS providers have used data driven ambulance repositioning since the 1980s. Almost no small or mid sized county does it, because they don't have a data science team sitting around. They run on dispatcher gut feel instead.
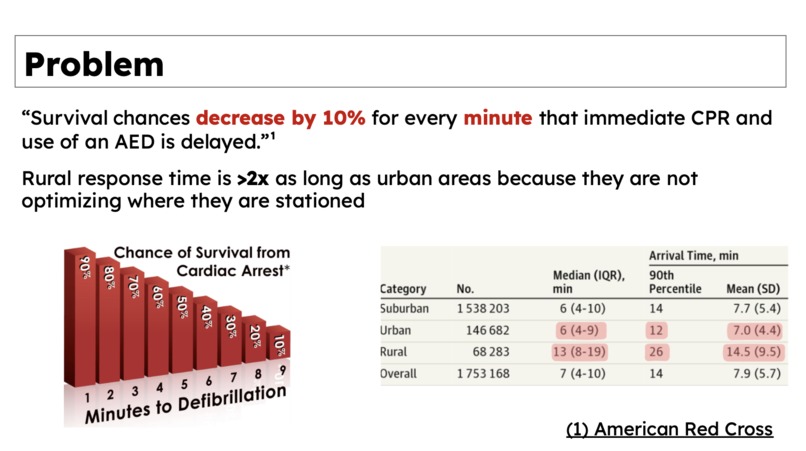
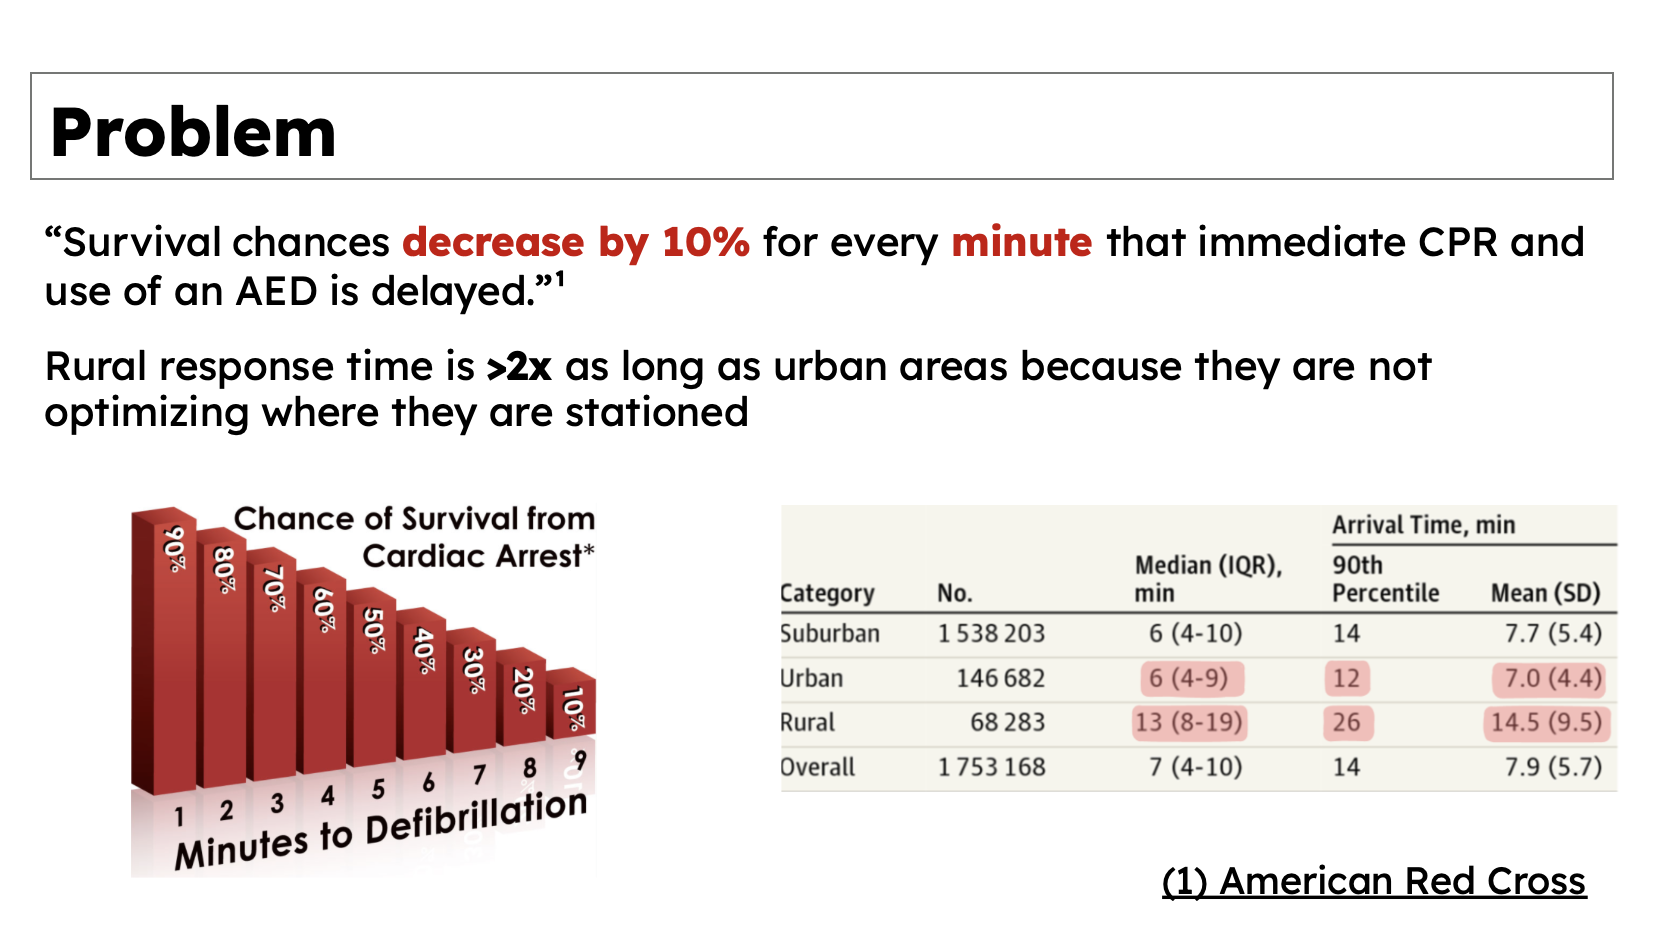
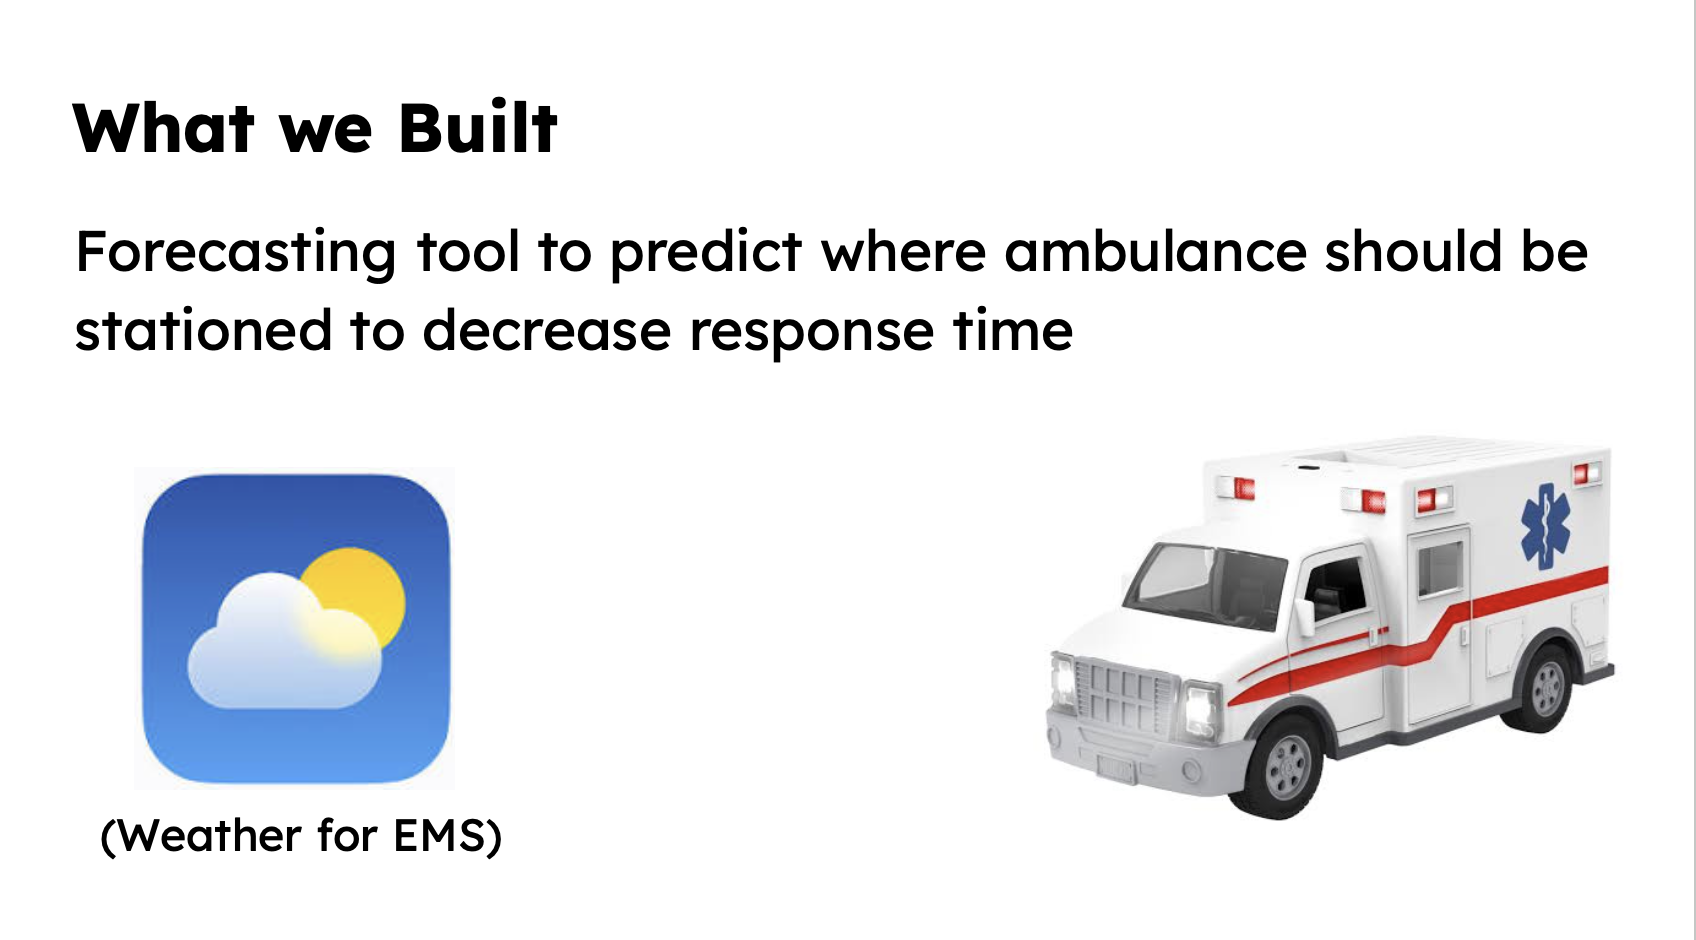
Ambulance response time is one of the strongest predictors of survival for cardiac arrest, stroke, and trauma. Every minute matters, and I'd heard that from people who actually do the job, not just read it in a paper. So I wanted to know if I could build the weather forecast for emergencies: something that tells you where to stage ambulances before the call even comes in, cheap enough and simple enough that a county with nobody on staff who knows data science could actually pick it up and use it.
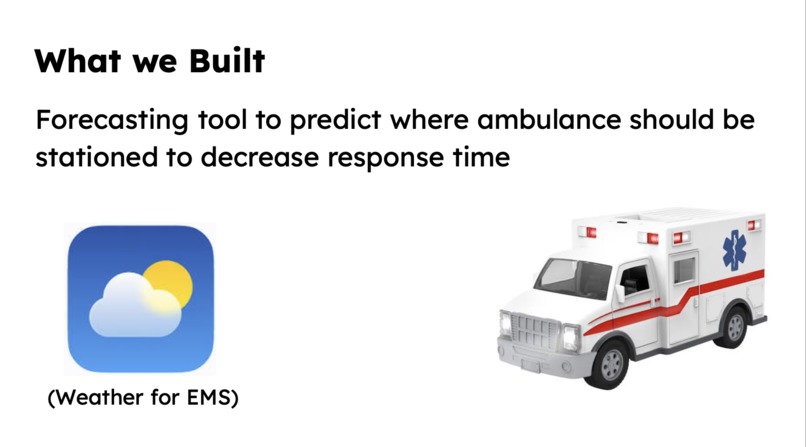
Every Second Matters predicts where ambulances should be staged before 911 calls arrive, instead of leaving them parked at static home bases. It's built on MEXCLP (Maximum Expected Covering Location Problem, Daskin 1983), the actual published method real EMS System Status Management uses. It ranks candidate staging posts by expected coverage, accounting for the probability that a covering unit is already busy on another call. The output is a compliance table, a ranked list of posts, so that as units go busy, the remaining idle units automatically re fill the highest priority posts first.
We tested it on 100% real 911 call data from two real cities, Seattle, WA (14,070 calls) and Cincinnati, OH (10,749 calls), each over a real 60 day window, using real road network driving times (via OSRM) instead of straight line distance. The result: 16.7% faster average response time in Seattle, 16.4% in Cincinnati, both statistically significant (p < 10⁻¹²⁰). For Cincinnati, we even validated the simulation against the department's real measured response times. Our simulated p90 response time landed within 0.07 minutes of the real one.
The deliverable is a two view interactive web app:
- Simple: a clean, ranked list of real street addresses for EMS staff to actually use, no jargon, no dashboards.
- Under the Hood: the full technical picture, including demand density maps, the MEXCLP compliance table, and a live animated replay of real 911 calls being dispatched under both a static and a dynamic strategy, side by side.
We also built a "Bring your CAD data" feature. Drop in any city's 911/CAD export (it just needs lat, long, and timestamp columns) and the entire pipeline (demand zone clustering, fleet sizing, the MEXCLP compliance table, both simulations, and the significance test) re runs from scratch, entirely in the browser. No server, no upload. The app isn't hard coded to Seattle and Cincinnati. It's a tool any county could point at their own data.
How we built it
- Data: Real 911 call logs pulled directly from Seattle's and Cincinnati's public open data APIs (Socrata), not synthetic or scraped data.
- Routing: Real driving durations from OSRM for every candidate post and every real call location, instead of haversine distance and a flat speed assumption.
- Model: Daskin's (1983) greedy MEXCLP algorithm for the compliance table, built from scratch in Python, driven by an empirically derived "busy fraction" computed directly from real call volume.
- Simulation: A discrete event queueing simulation comparing static fixed post dispatch against dynamic compliance table restaging, run over the identical real call stream for both strategies so the comparison is fully paired and fair.
- Frontend: A dark, dense interactive dashboard built with vanilla HTML, CSS, and JS, using Leaflet.js for mapping, with a live animated "race" mode replaying real call by call dispatch decisions.
- Client side pipeline: The entire modeling pipeline (clustering, MEXCLP, simulation, significance testing) was ported to run in browser in JavaScript so anyone can upload their own city's data with zero backend.
- Deployment: Live on Vercel.
Challenges we ran into
Finding real datasets to work with was harder than we expected. A lot of cities either don't publish their 911/CAD data publicly or the data is missing the fields we actually needed, so we had to dig around before landing on Seattle and Cincinnati . Getting the model itself right took a few tries too before we found an approach that actually held up on real data.
Accomplishments that we're proud of
- Every number in this project is either backed by real data or explicitly labeled as a disclosed assumption.
- We validated our simulation against real, independently measured department response times and landed within 0.07 minutes.
- We replaced an invented heuristic with the actual published academic method mid build, once we realized our first approach wasn't rigorous enough, and it improved our real, honest results.
- We built the pipeline to generalize to any city's data, not just the two we happened to test.
- We went beyond the textbook version of MEXCLP itself. The published 1983 method assumes one busy fraction for the whole city, applied uniformly all day. We computed a separate compliance table for every hour of the day, each with its own real, empirically derived busy fraction and its own real demand pattern, so the model's recommendation for where to stage the fleet actually changes through the day instead of staying fixed. You can drag a time slider in the app and watch the recommended posts shift in real time as the underlying data changes.
What we learned
Rigor is cheap. Rigor that survives you rerunning it on data that comes back and says "no" is not, and that's exactly what happened to us three times before it said "yes." An honest null result is not a wasted afternoon. It's how you know your eventual positive result actually means something.
I also learned that the best ideas in this project didn't come from staring at a dataset. They came from an EMT telling me, in plain language, what actually bugs them about their own job.
What's next for Every Second Matters
- Extend the per hour busy fraction further to a per post basis, not just city wide per hour.
- Integrate hospital location data (already collected) for "route to nearest appropriate trauma center" recommendations.
- Validate on a third city to strengthen the generality claim.
- The real next unlock isn't technical. It's getting a real small county EMS director's actual CAD export and running a genuine pilot, and honestly, going back and showing this to the crews at Sierra College who gave me the idea in the first place.
Built With
- computational
- data
- html
- javascript
- json
- jupitornotebook
- ml
- python
- react
- tailwind

Log in or sign up for Devpost to join the conversation.