Inspiration
Growing up in a small town in Oregon, I watched wildfires and droughts reshape the landscapes I loved. I realized so many of us take daily eco-actions—choosing public transit, signing petitions, saving water—but we never see the collective impact. That’s when I knew: we needed a way to turn fragmented efforts into tangible progress, to make climate action feel personal and powerful.
What it does
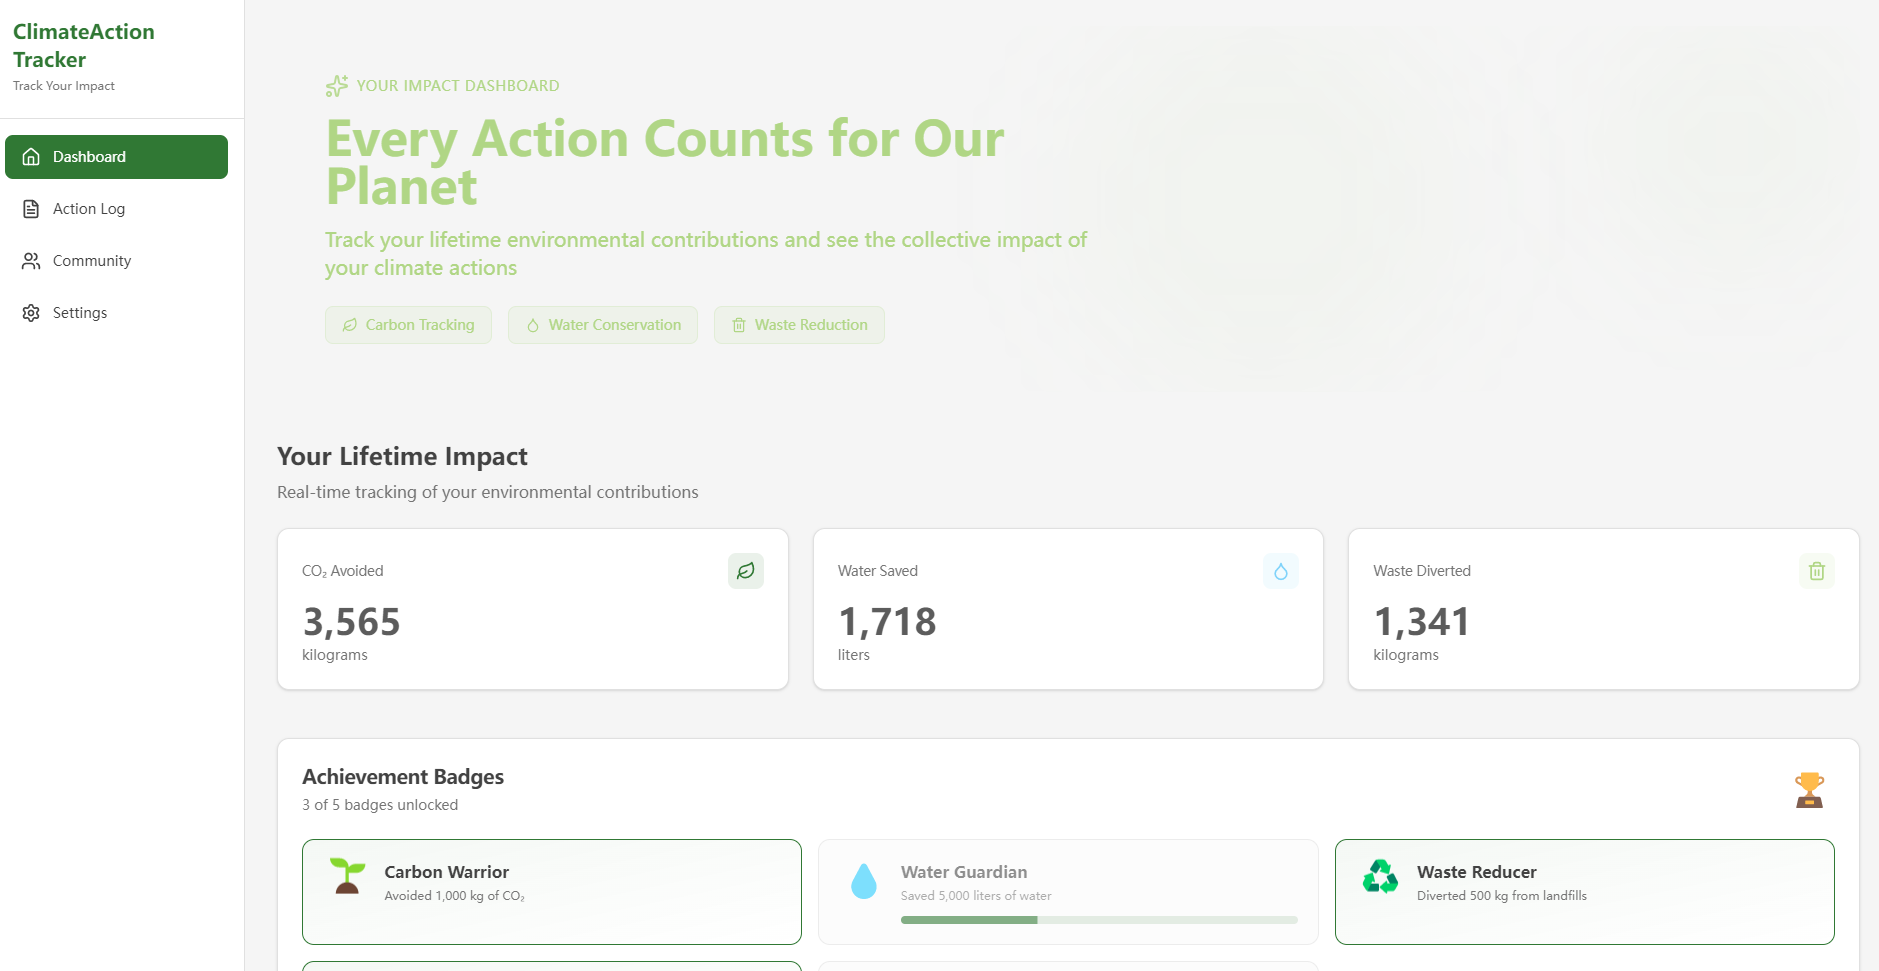
ClimateAction Tracker is a personal dashboard that centralizes all your climate efforts. It aggregates your carbon reduction, water savings, and waste diversion data, visualizes trends over time, and lets you compare your impact to national and global averages. You can log advocacy actions—petitions signed, events attended—and share your impact with your community to inspire others.
How we built it
I started by mapping core user needs: clarity, accessibility, and motivation. I used React for the front-end to create a modular, mobile-responsive UI, paired with D3.js and Chart.js for intuitive data visualizations. Firebase handled back-end data storage, ensuring seamless updates and user data management. Every component was designed with a earth-forward color palette to keep the mission at the center, and I built in logic to highlight cumulative impact to keep users engaged.
Challenges we ran into
The biggest hurdle was balancing simplicity with depth—we wanted the dashboard to be easy to use, but also rich enough to show meaningful trends. Early versions overwhelmed users with too much data; I had to iterate on the UI to prioritize core metrics (CO₂ avoided, water saved) while keeping secondary data accessible but not intrusive. Validating manual entry data also required fine-tuning to keep inputs user-friendly but accurate.
Accomplishments that we're proud of
We created a tool that makes climate impact feel tangible. Users tell us seeing their lifetime carbon reduction in a line graph—growing month after month—keeps them motivated to keep acting. The community impact feature, which lets users see their network’s collective contribution, has become a favorite: it turns individual action into a shared win.
What we learned
I learned that data storytelling is just as important as the data itself. Numbers alone don’t inspire—visualizing progress and framing impact in relatable terms (e.g., “your water savings equals 500 family showers”) makes all the difference. I also gained a deeper understanding of user-centric design: iterating based on feedback, even if it meant scrapping early work, led to a far more useful product.
What's next for this project
We’re expanding the advocacy tracking features to include local policy actions, so users can connect their daily choices to systemic change. We’re also adding a collaborative goal-setting tool for communities—letting groups set collective climate targets and track progress together. Finally, we’re refining the benchmark data to reflect regional differences, making comparisons even more relevant for users across Europe and North America.

Log in or sign up for Devpost to join the conversation.