Inspiration
We wanted to reimagine how people make sense of the world’s chaos. Feeds and calendars bury context, but maps have always been our most intuitive window into global activity. By starting with one of humanity’s oldest interfaces—the map—we set out to create a living, breathing visualization of real-time events. From a local street protest to a global sports final, you can zoom in and out to instantly see where the world is buzzing and, more importantly, why.
What it does
Our project turns streams of real-time event data into an interactive, intelligent world map that doesn’t just show you what’s happening — it helps you understand it.
Global Event Explorer – Pan and zoom seamlessly across the globe to discover events in real time. Smart Search – Find exactly what you’re looking for, from concerts in New York to protests in Berlin. Voice-Powered Interaction – Search or query the map using natural voice commands. The system responds through a voice agent, transforming exploration into a conversation. Dynamic Filtering & Categorization – Filter events by category (sports, music, protests, traffic, etc.) and instantly see patterns emerge. AI-Powered Insights – Each event is enriched with AI-generated summaries, sentiment analysis, and contextual insights so users don’t just see where something is happening, but also why it matters. Text-to-Speech Narration – Let the system guide you on a narrated tour of the busiest cities and events unfolding worldwide.
How we built it
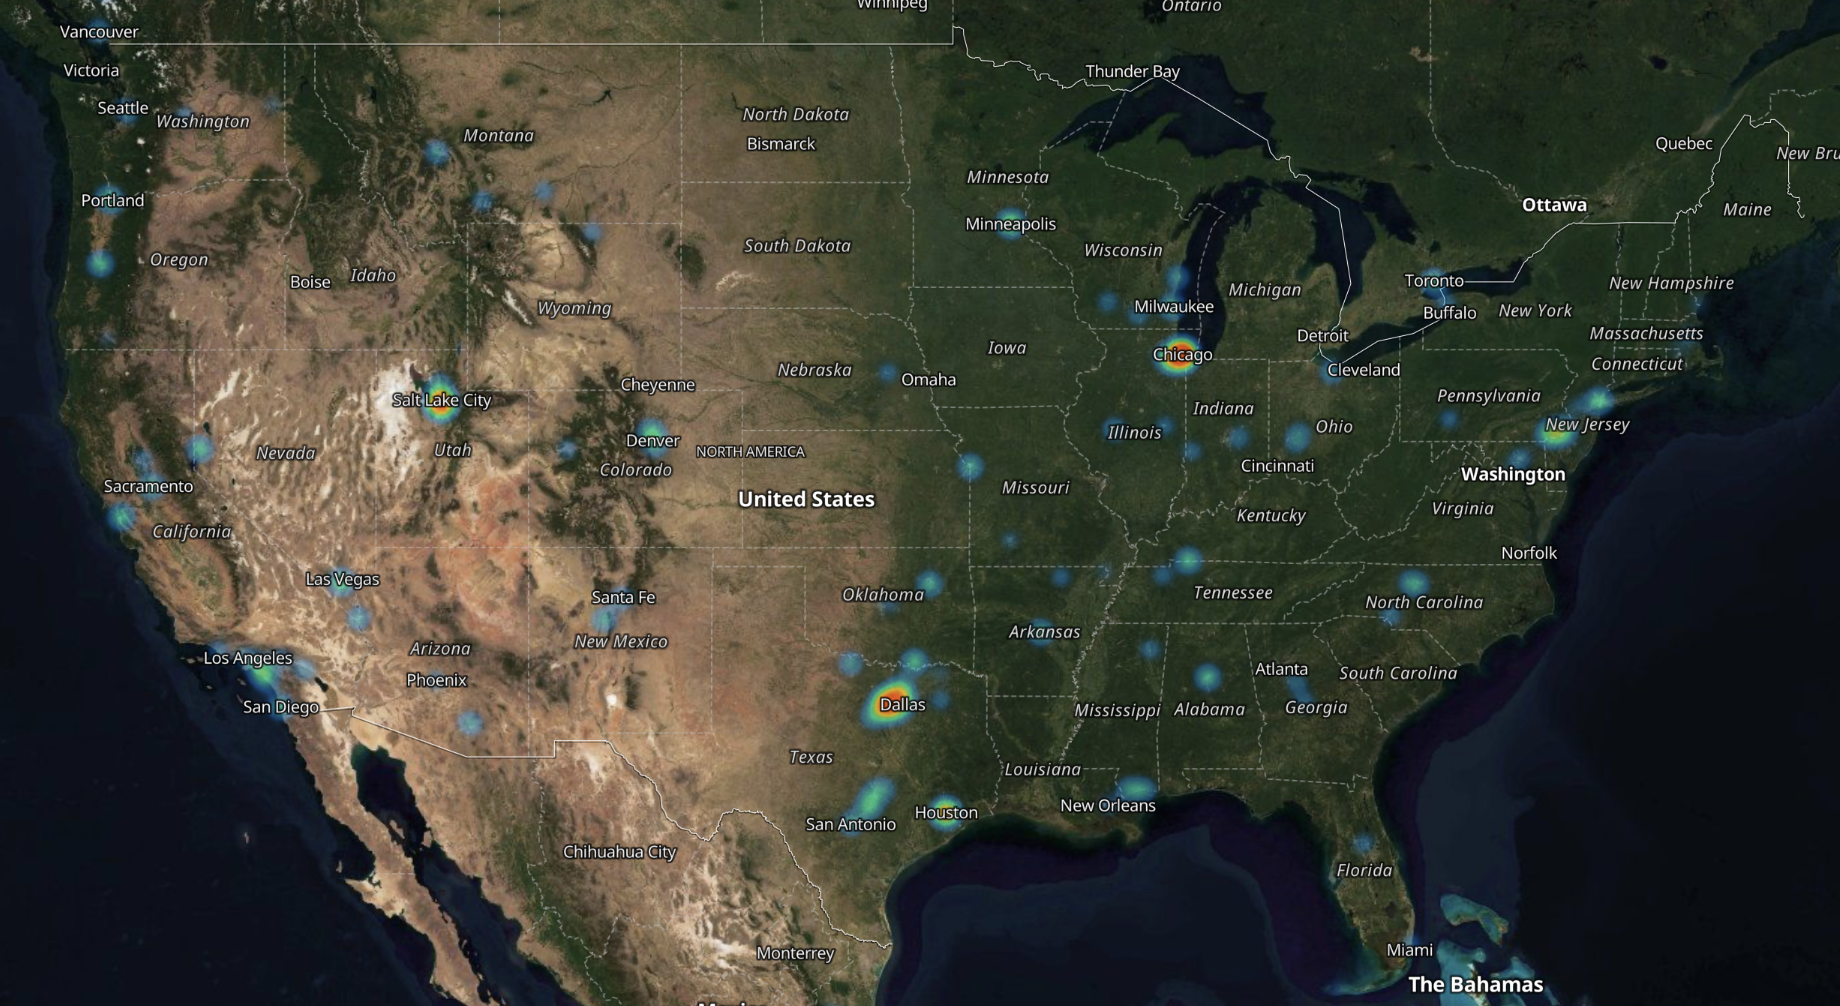
Frontend: Our frontend was built using React with Typescript on Vite. We specifically chose Typescript because of the type-safety benefits it brings during development as well as preventing errors at build time. We used MapLibre GL and Maptiler to create the map and render the event pins, then created custom layers on top of it to create a heatmap represent the density of people in events in the area, along with a layer of clickable points to get more inform. We chose MapLibre GL over Google Maps because it gives a more realistic terrain of the earth, which works quite well with heatmaps! Data-fetching was done using an API wrapper called @tanstack/react-query which provides client-side caching as well for even better performance.
Backend: Our backend was built in Python on FastAPI. Our archicture incorporates 3 databases, our primary database PostgresSQL, our secondary database Redis for caching and Pinecone Vector DB for storing vector embeddings of events which powered our search functionality. We ingested data from PredictHQ on an ETL pipeline, then parsed that data and created vector embeddings with the Gemini gemini-embedding-001 API and indexed them in Pinecone.
Challenges we ran into
- Rate limits on PredictHQ and Gemini embeddings posed a challenge as it limited how much data we could acquire in 36 hours.
- Additionally, vector embeddings posed challenges such as choosing good dimensions for our use case, normalization, and text cleaning.
- Finding a good (free) globe package was also not a cakewalk, as we ended up combining 2 maps packages to get what we wanted.
- Attendance data from PredictHQ were difficult and surprisingly sparse at times, which led us to be careful about our visualization and properly representing density for unexpected outliers.
- We also had to ensure we rendered as much events on the map as possible at one go, while ensuring fast performance. To overcome this we had to ensure we always read events from the Redis cache by implementing a write-through caching strategy that placed events in the cache as soon as they are ingested by the ETL pipeline before sending them to our primary database.
Accomplishments that we're proud of
- The implementation of a fully functioning ETL pipeline that ingested data from the PredictHQ API into our PostgreSQL database
- Fetching of over 1000 event points and rendering on the map with sub 100ms latency by utilizing Redis
- Clean and Fast UI components inspired by Arc Browser's search, and utilization of micro-animations for better UX
- Multimodal search feature with a voice pipelines by utlizing Gemini 2.0 Flash for Transcription and Gemini 2.5 Preview TTS for Text to Speech
- Timeline feature that shows the progression of events over the last 48 hours
- Categorization of events to show what type of events people are interested in
- Generating AI insights on-demand for each event, by integrating web search tools with the Gemini LLM.
What we learned
- Caching is a huge huge huge performance boost and should never be overlooked!
- How to deal with unexpected behavior of external APIs, including oddly formed data and rate limits
- TypeScript/type safety can really make quick development easier, especially in teams
- Broswers are not able to read audio data in PCM format (which was the default returned from Gemini) so it was neccessary to convert all audio data to WAV format
- ETL pipelines are not so difficult to implement after all 🤭
What's next for EventScout
- Eat more data!
- We would love to add related links to our existing event points (i.e. links to buy event tickets, airfare prices, traffic times, etc.).
Built With
- fastapi
- gemini
- maplibre.gl
- maptiler
- postgresql
- predicthq
- python
- react
- redis
- typescript


Log in or sign up for Devpost to join the conversation.