-
-
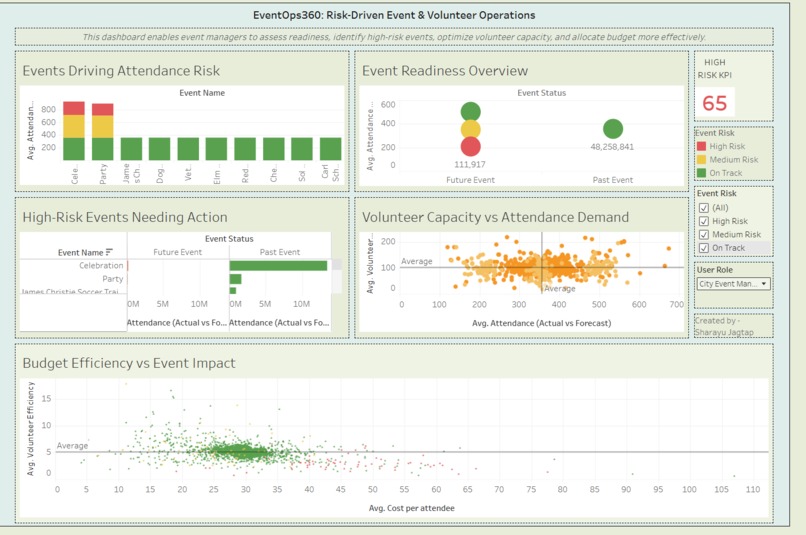
EventOps360 Dashboard
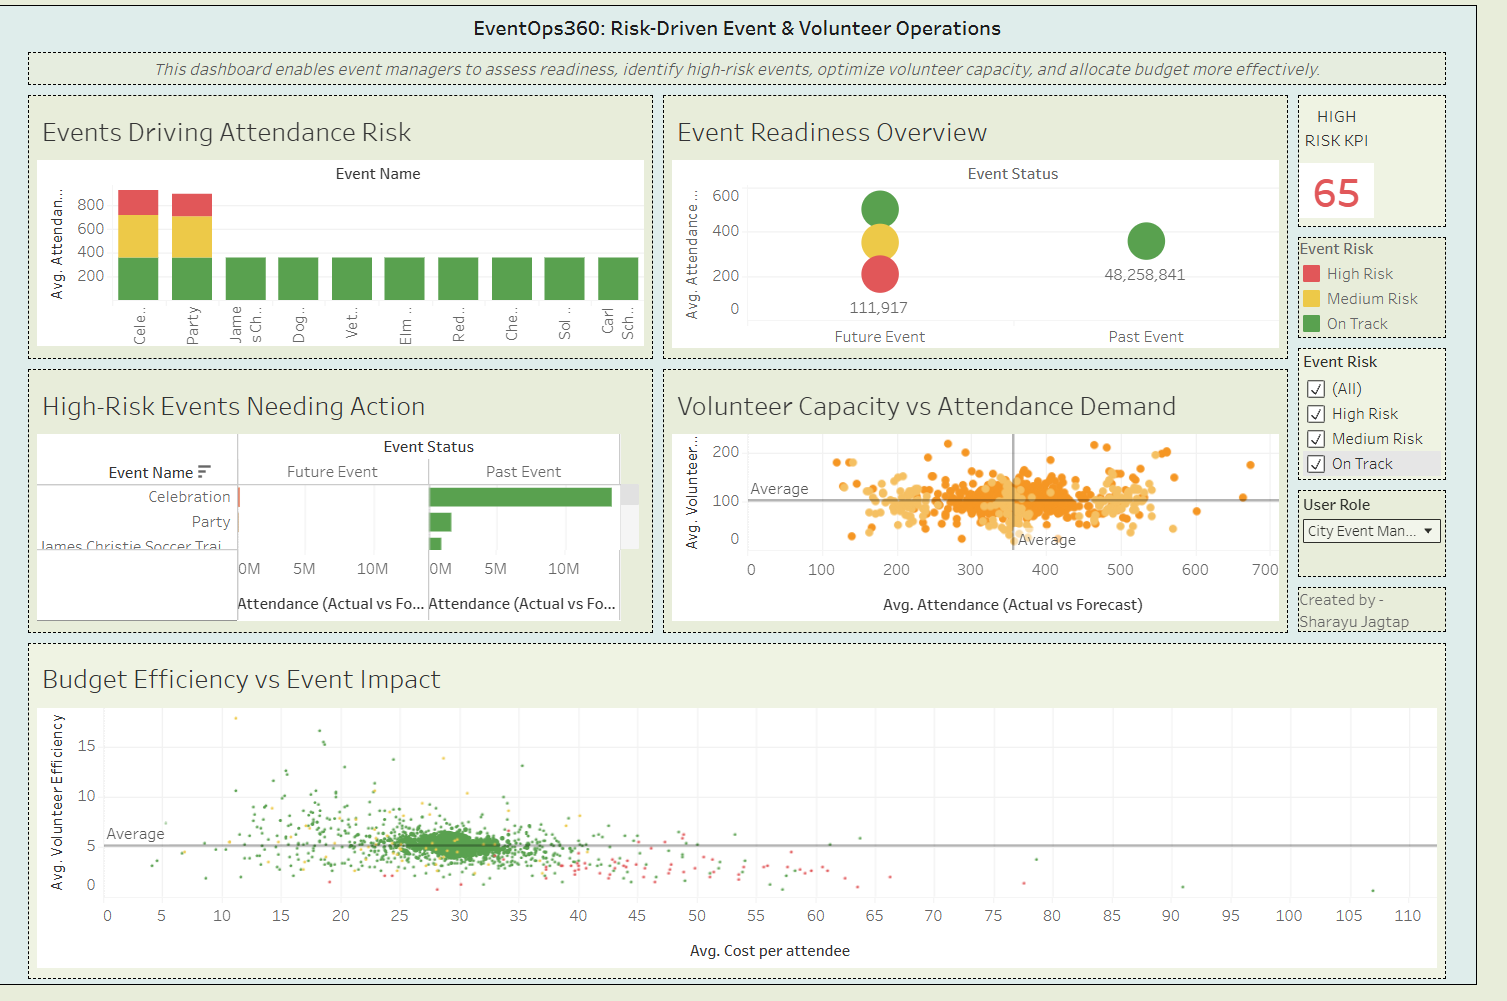
I came up with EventOps360 based on my hands-on experience during my internship at the Office of Student Volunteerism (OSV). While working on events and volunteer coordination, I noticed that many operational decisions were made using fragmented information. Attendance expectations, volunteer availability, and event costs were often reviewed separately, which made it difficult to quickly assess risk or identify issues before an event took place. Analyzing this information efficiently was a recurring challenge, and that gap inspired me to build this project.
EventOps360 is a risk-driven event operations dashboard built on Tableau Cloud that brings these elements together in one place. It helps event managers assess overall event readiness, identify high-risk events that require attention, understand volunteer load relative to attendance demand, and evaluate budget efficiency. Instead of static reporting, the dashboard functions as an operational control center, allowing users to move from insight to action seamlessly.
I chose New York City event data for this project because NYC represents one of the most complex and dynamic event environments. With a high volume of diverse events, varying attendance levels, and significant logistical demands, NYC provides an ideal real-world context to test event risk, volunteer coordination, and operational efficiency at scale. The dataset allowed me to model realistic scenarios where proactive decision-making is essential.
I built the entire project independently using Tableau Cloud, leveraging calculated fields, semantic modeling, interactive filters, and KPI-driven views. Each dashboard component was intentionally designed to answer a specific operational question, and all views are connected through shared risk and capacity logic so that changes in one area are immediately reflected across the system.
One of the main challenges was balancing analytical depth with usability, especially when working with large datasets. I addressed this by applying risk-based filtering, thoughtful aggregation, and a clear visual hierarchy to keep the dashboard focused and actionable. I’m most proud that EventOps360 goes beyond visualization and functions as a decision-support system, reflecting real challenges I observed during my internship.
With more time, EventOps360 could be expanded to include predictive risk scoring, automated alerts for volunteer shortages or budget overruns, and deeper integrations with scheduling and communication tools. The long-term goal is to evolve it into a proactive event intelligence platform that supports smarter planning and faster execution.


Log in or sign up for Devpost to join the conversation.