Inspiration The rapid adoption of electric vehicles has highlighted the need for accessible and well-mapped charging infrastructure. We wanted to create a solution that empowers EV users to quickly locate charging stations while showcasing the potential of data visualization for driving sustainability.
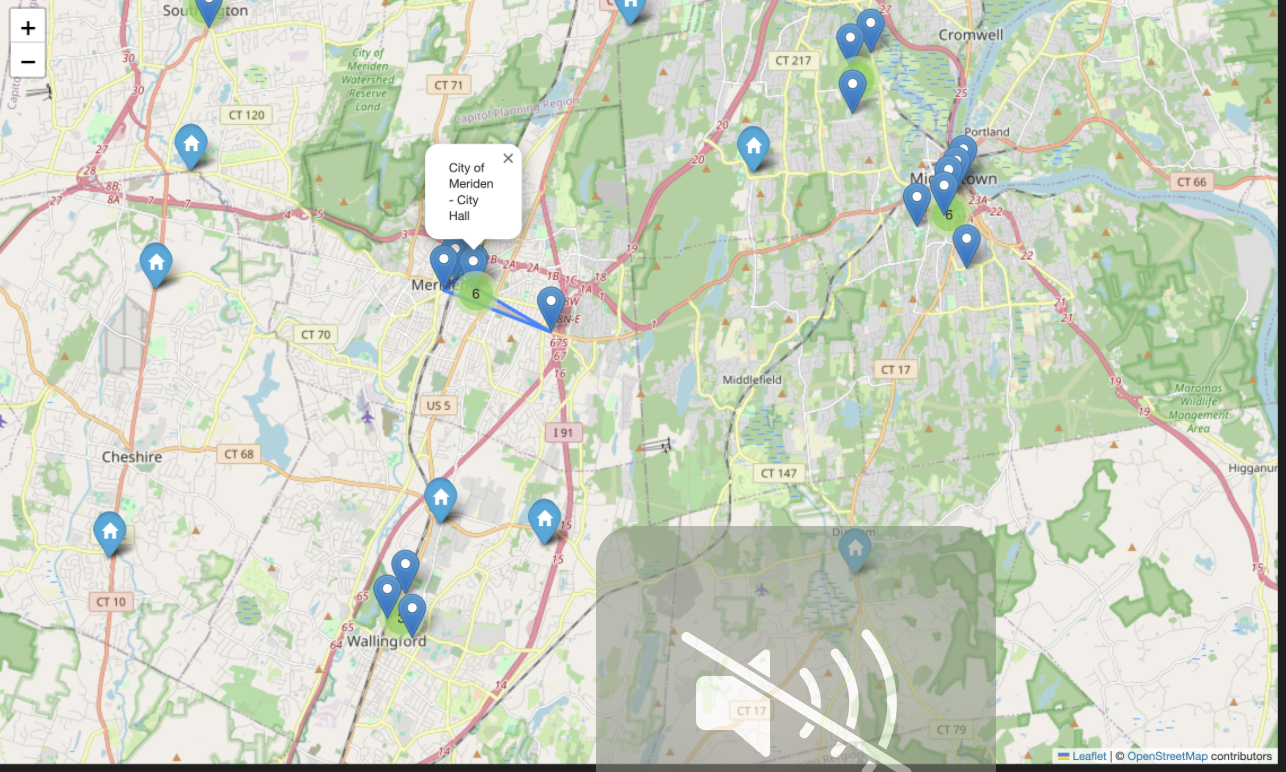
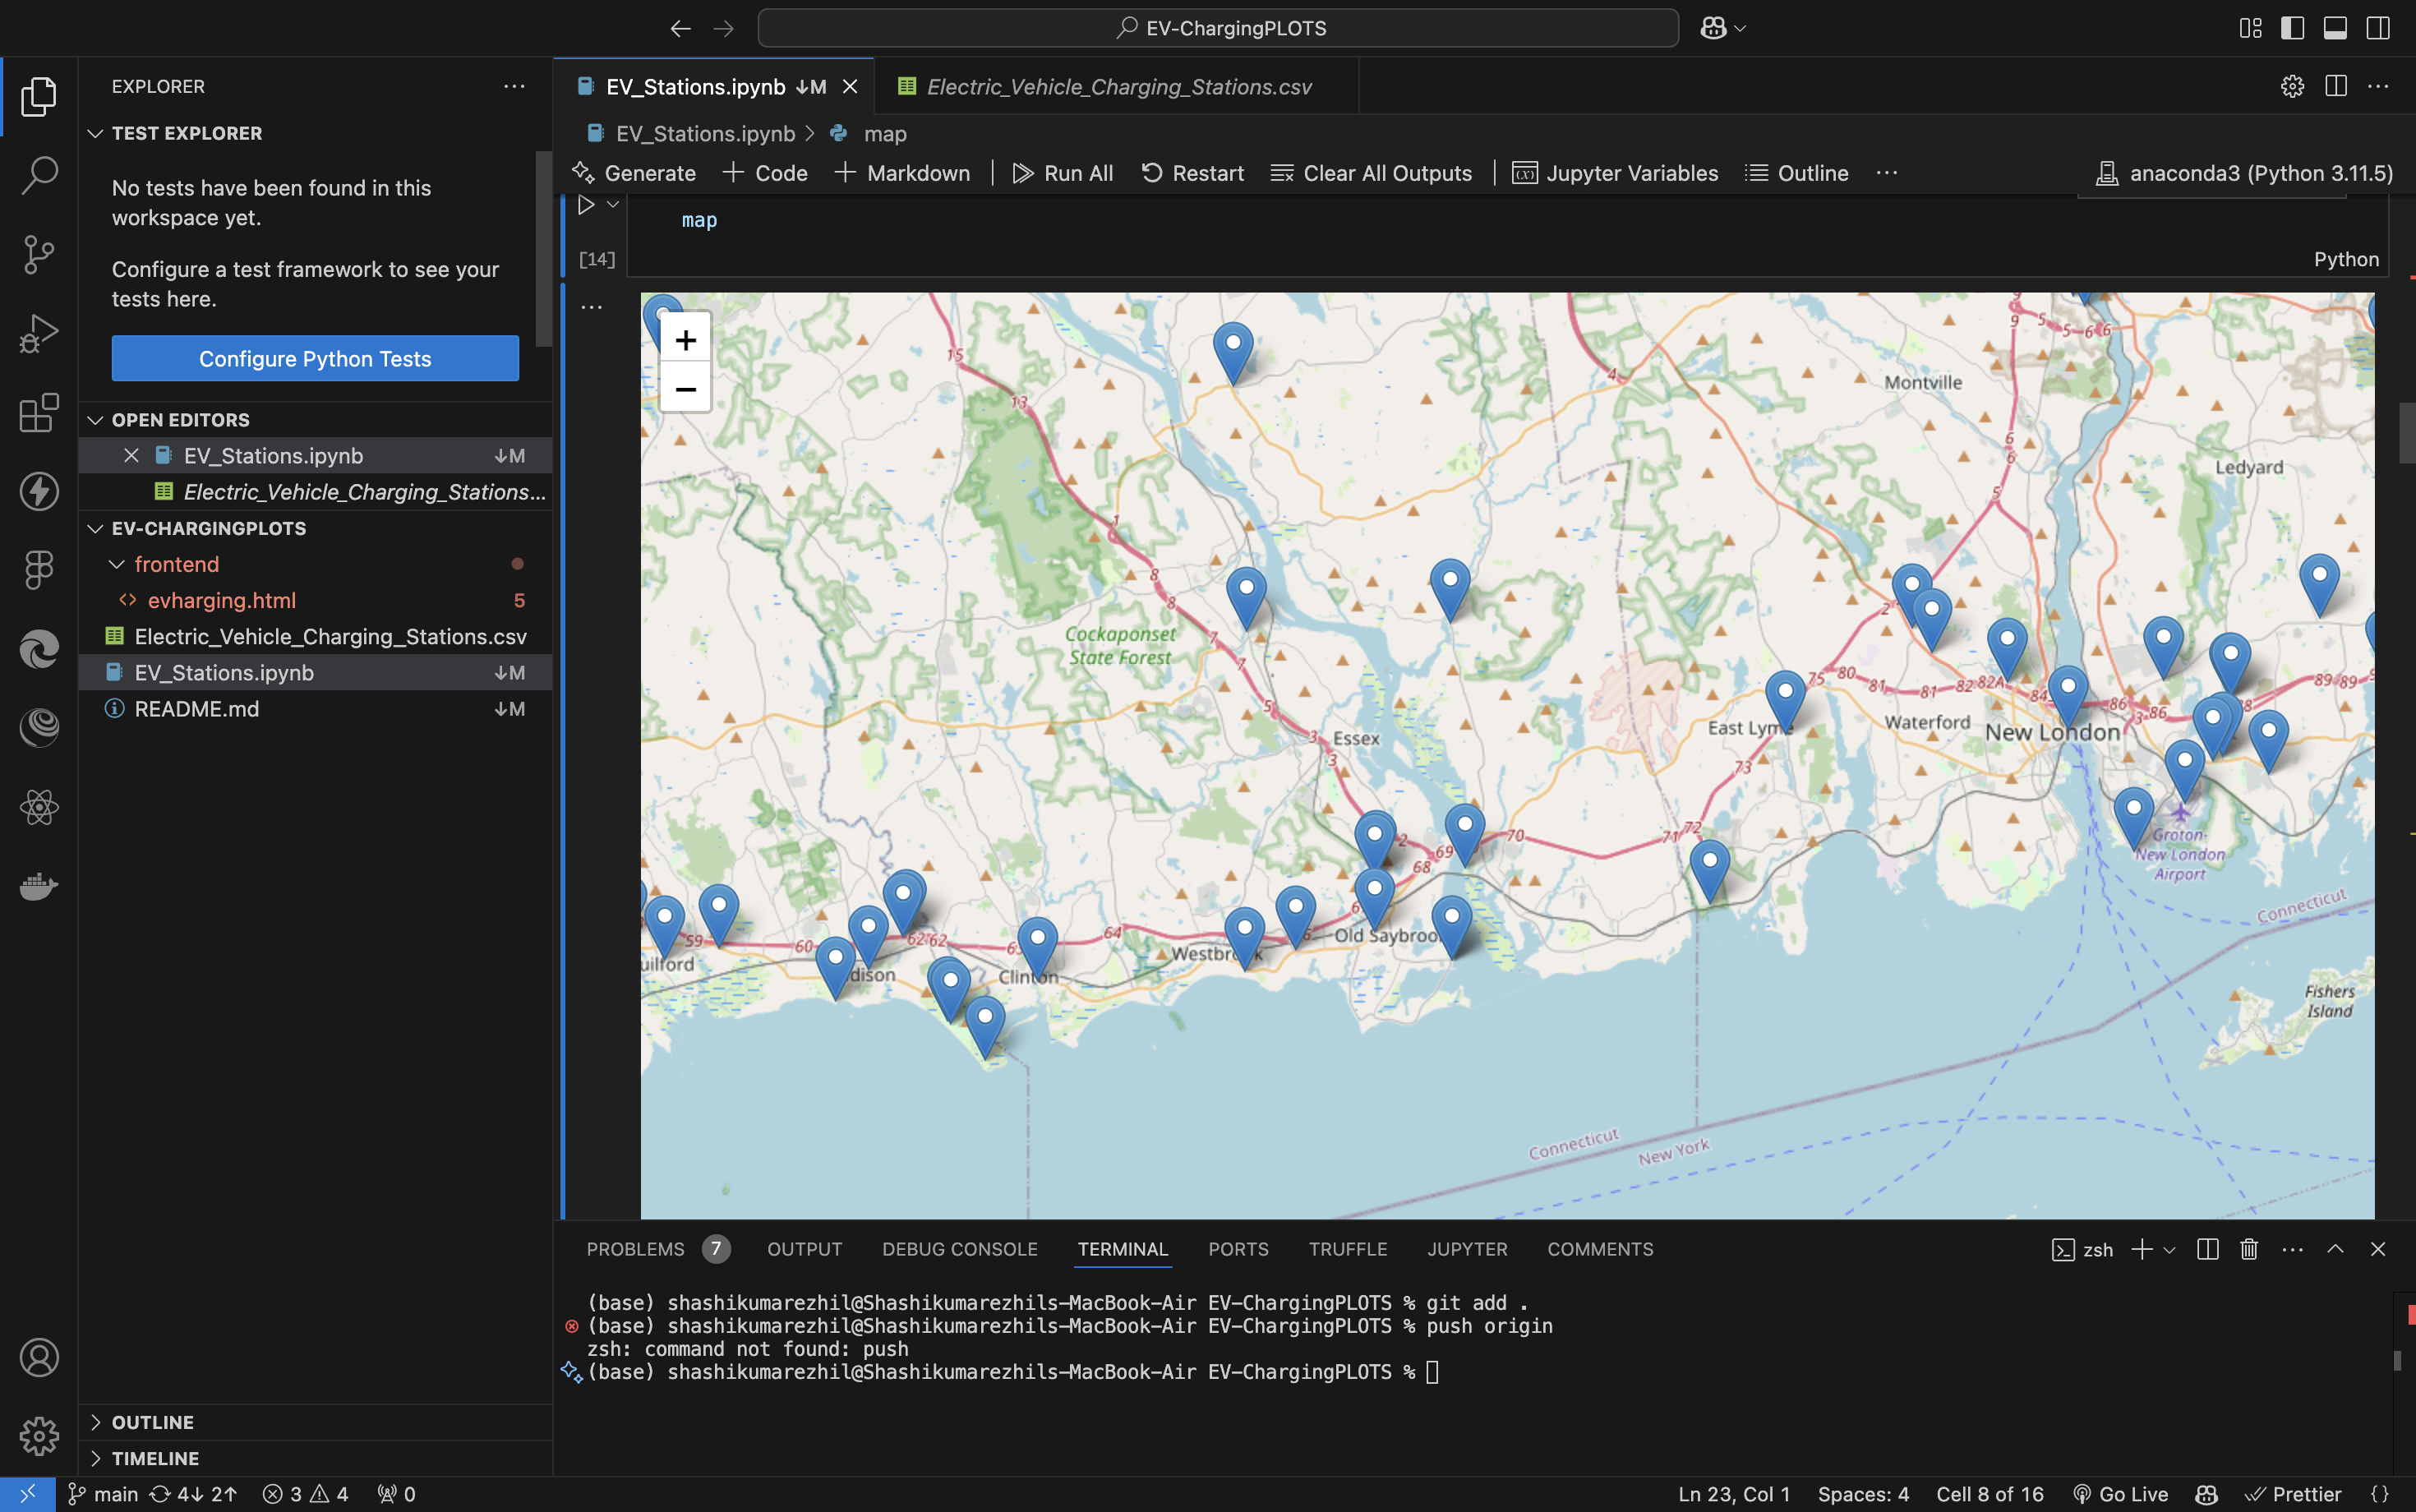
What It Does This project visualizes EV charging stations on an interactive map, making it easy to identify nearby stations and access key details like the station’s name, address, and operational status. Users can explore charging infrastructure intuitively by hovering over map markers for specific information.
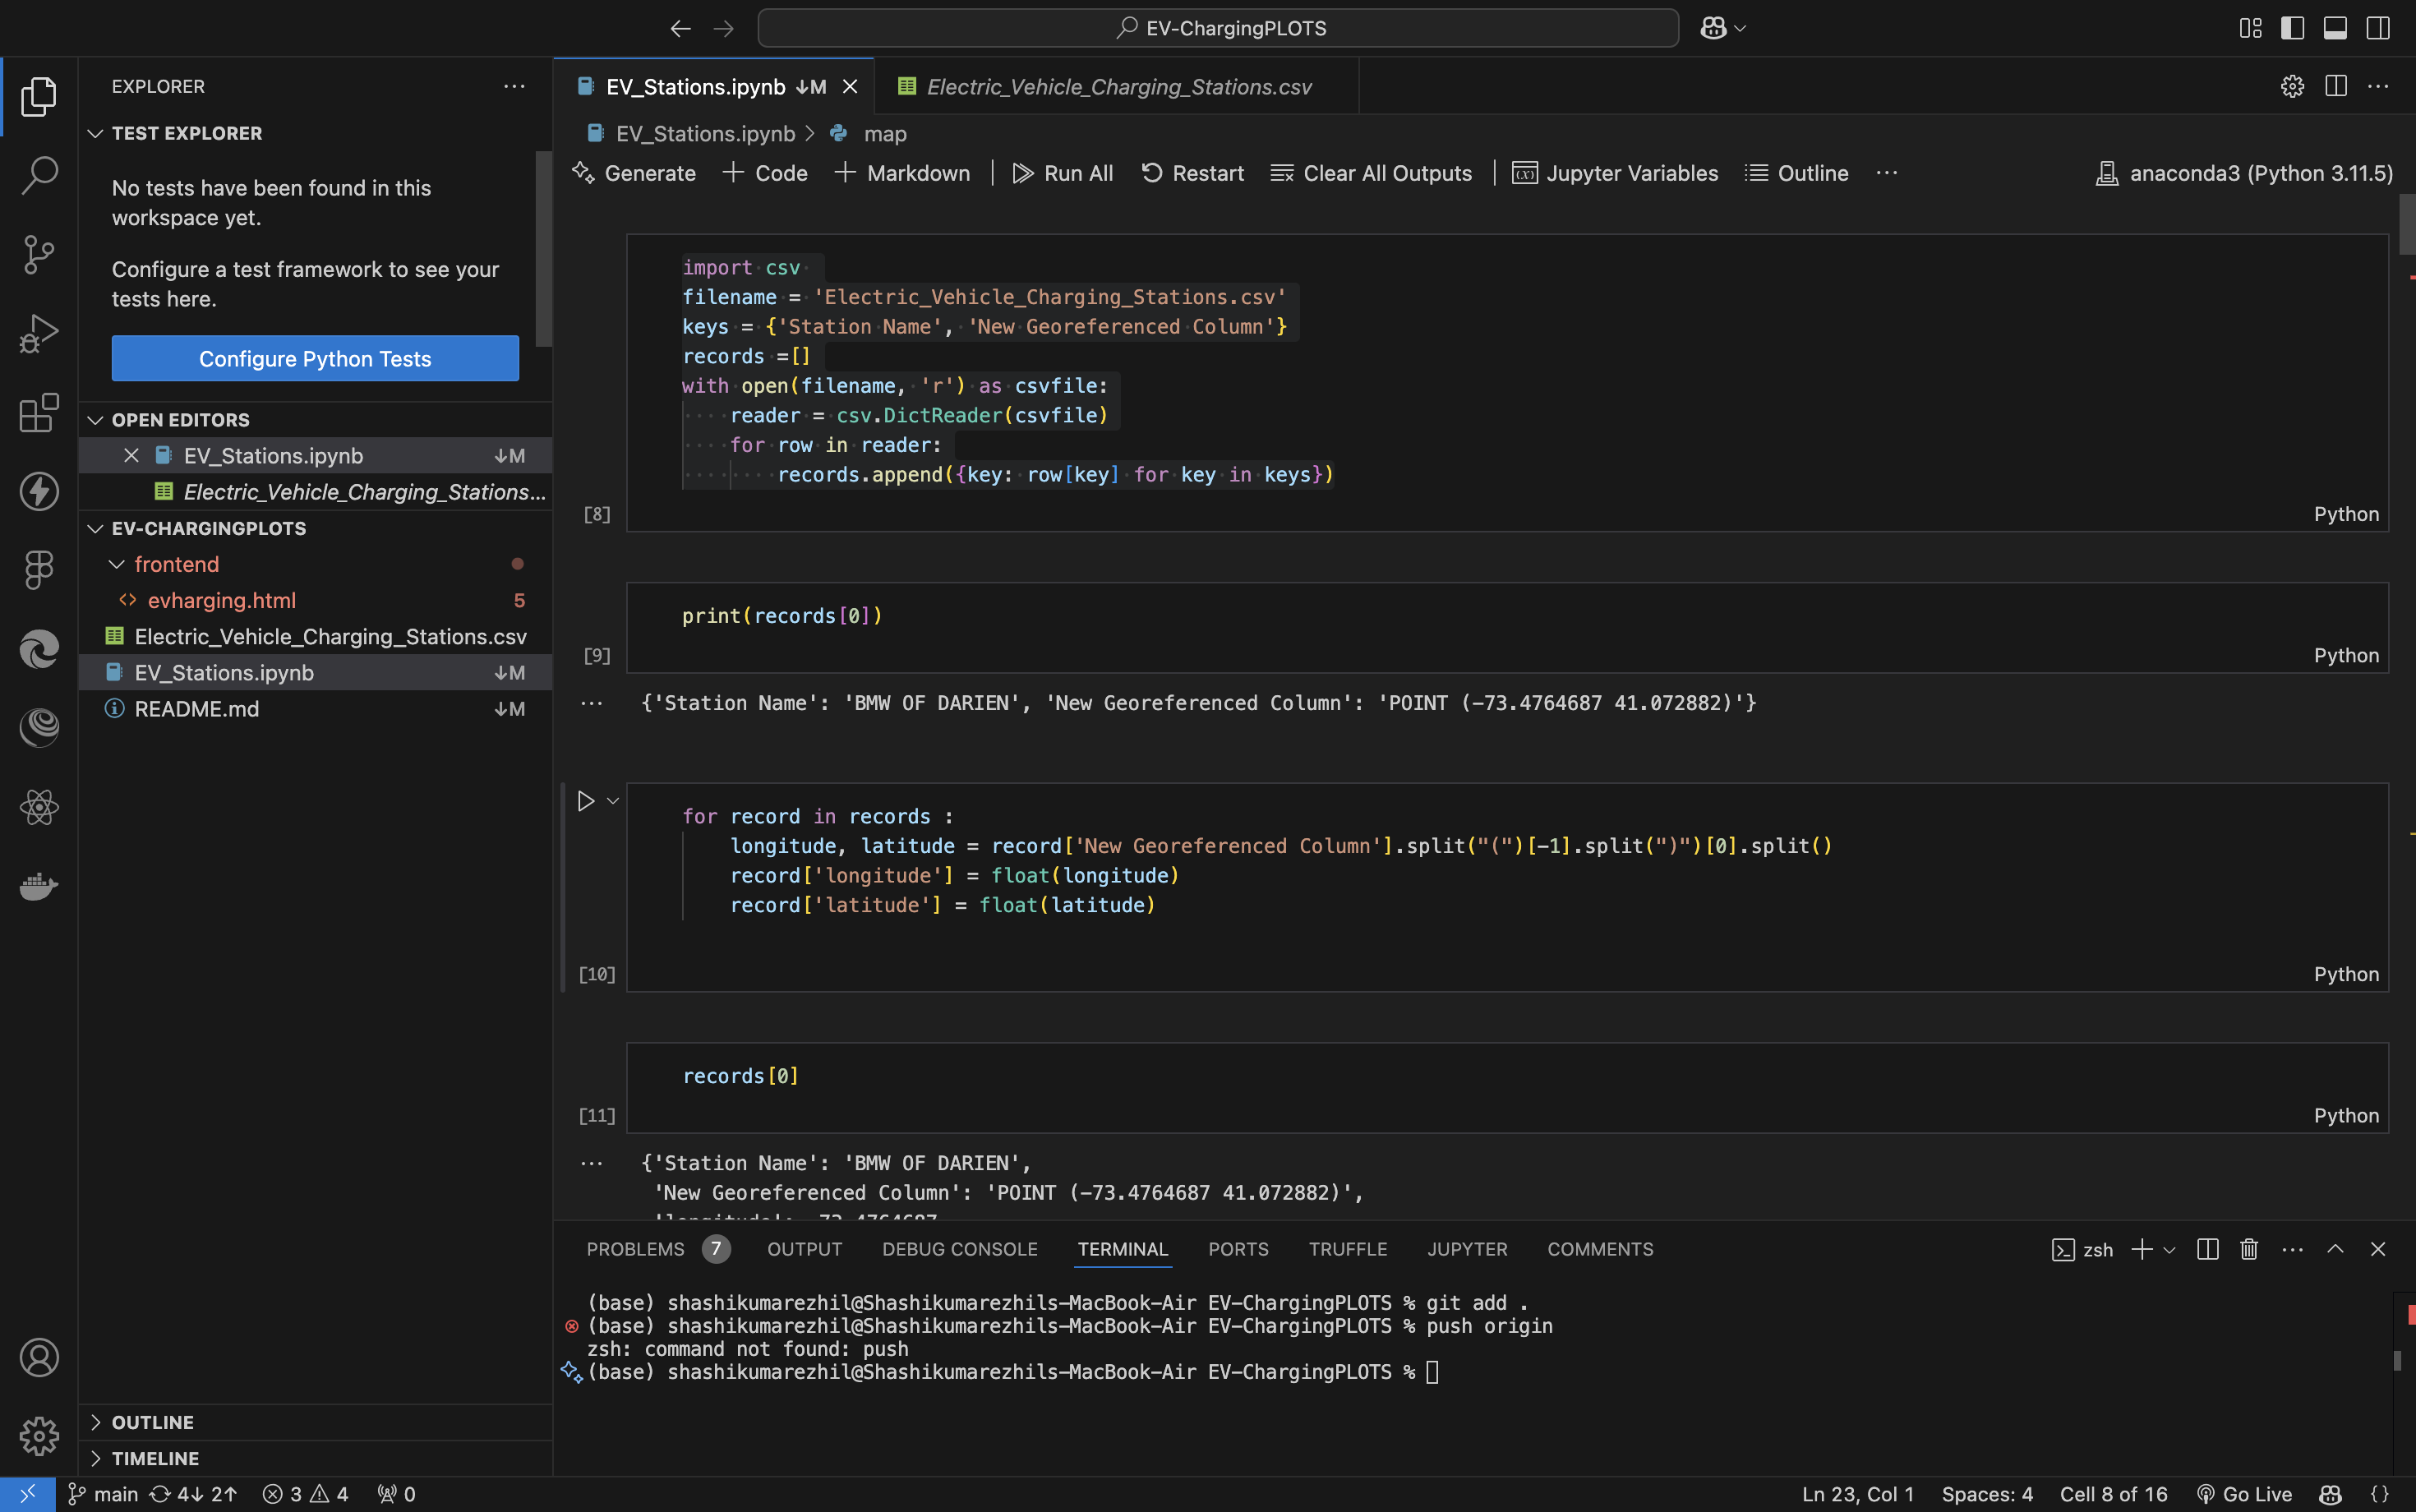
How We Built It We used Python and the Folium library to design the interactive map. The data was sourced from a structured CSV file, which includes details about each charging station, such as latitude, longitude, and other metadata. By processing this data, we plotted dynamic map markers and customized the hover functionality to display station-specific information.
Challenges We Ran Into Data Quality: Ensuring the data was clean and consistent posed initial challenges, as missing or inaccurate entries could affect the map's accuracy. Map Customization: Configuring Folium to meet all our visualization goals required experimenting with styles and features. Scalability: Handling large datasets efficiently to maintain a smooth user experience was a key focus area. Accomplishments That We're Proud Of Successfully creating an intuitive and visually appealing map that delivers real-time insights into EV infrastructure. Overcoming data integration challenges to ensure reliable and accurate visualizations. Building a tool that promotes sustainable transportation and encourages EV adoption. What We Learned The importance of clean, structured data in creating impactful visualizations. Techniques for optimizing Python and Folium to handle larger datasets without compromising performance. How interactive maps can bridge the gap between raw data and actionable insights for end-users. What's Next for EV Charging Plots Using Folium Real-Time Updates: Integrate APIs to display live availability and status of charging stations. Expanded Data Points: Add filters for features like charging speeds, connector types, and operational hours. Mobile-Friendly Version: Develop a responsive interface for better accessibility on smartphones and tablets. User Feedback: Implement user reviews and ratings for charging stations to further assist EV owners. Collaborations: Partner with EV manufacturers and urban planners to enhance infrastructure visibility and planning.
Built With
- folium
- python


Log in or sign up for Devpost to join the conversation.