-
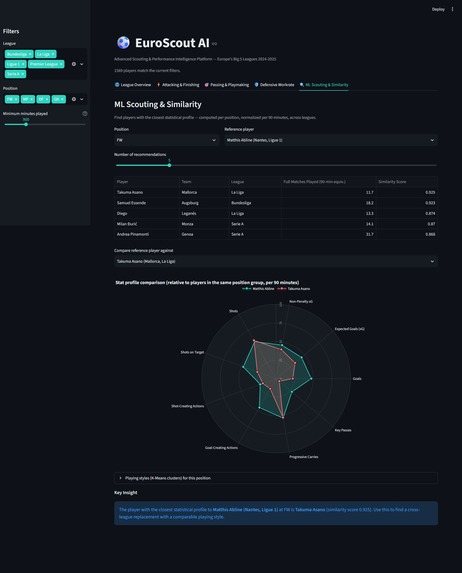
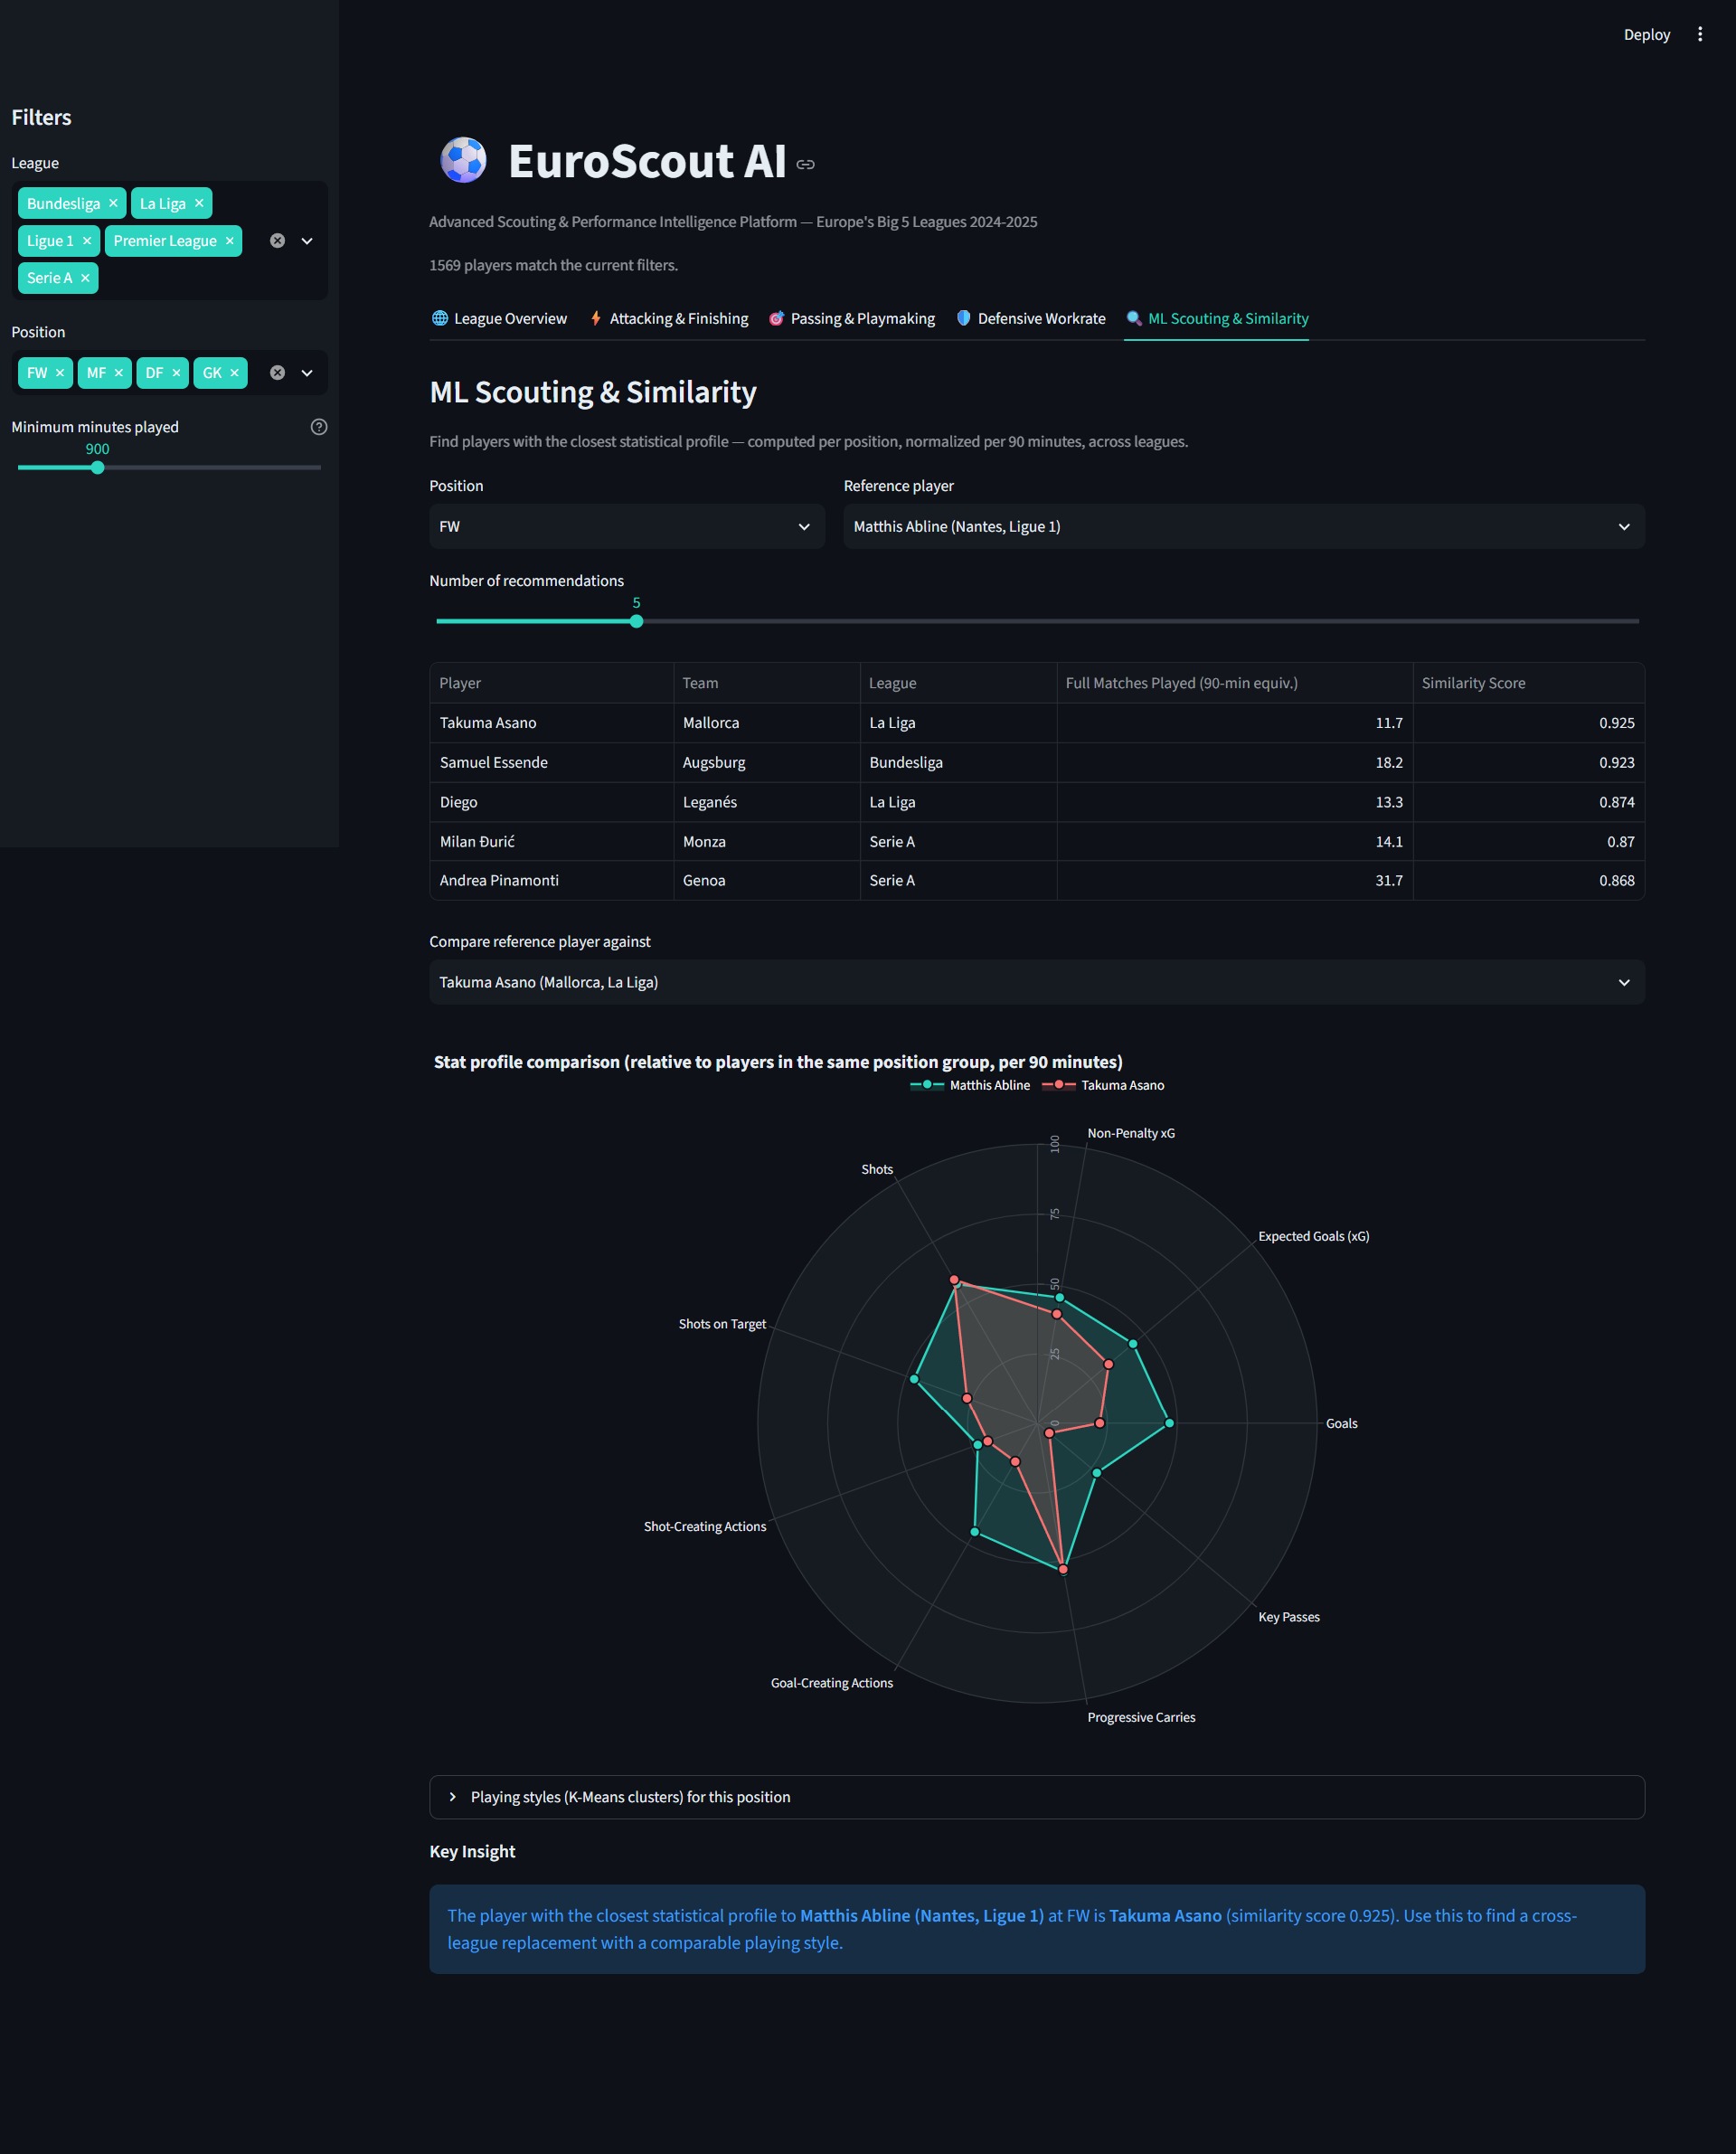
AI-powered player similarity search with radar chart comparison and K-Means playing-style clusters.
-
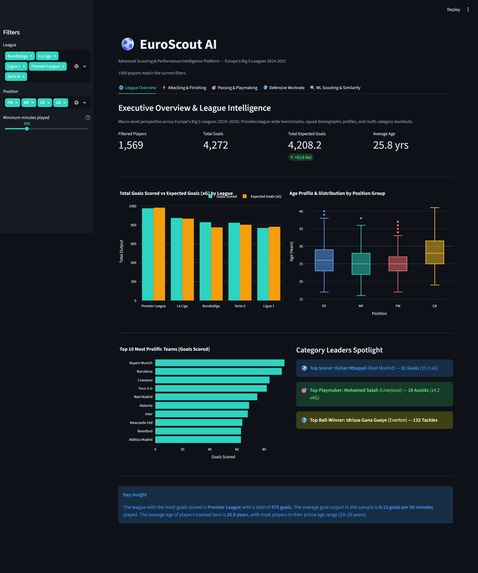
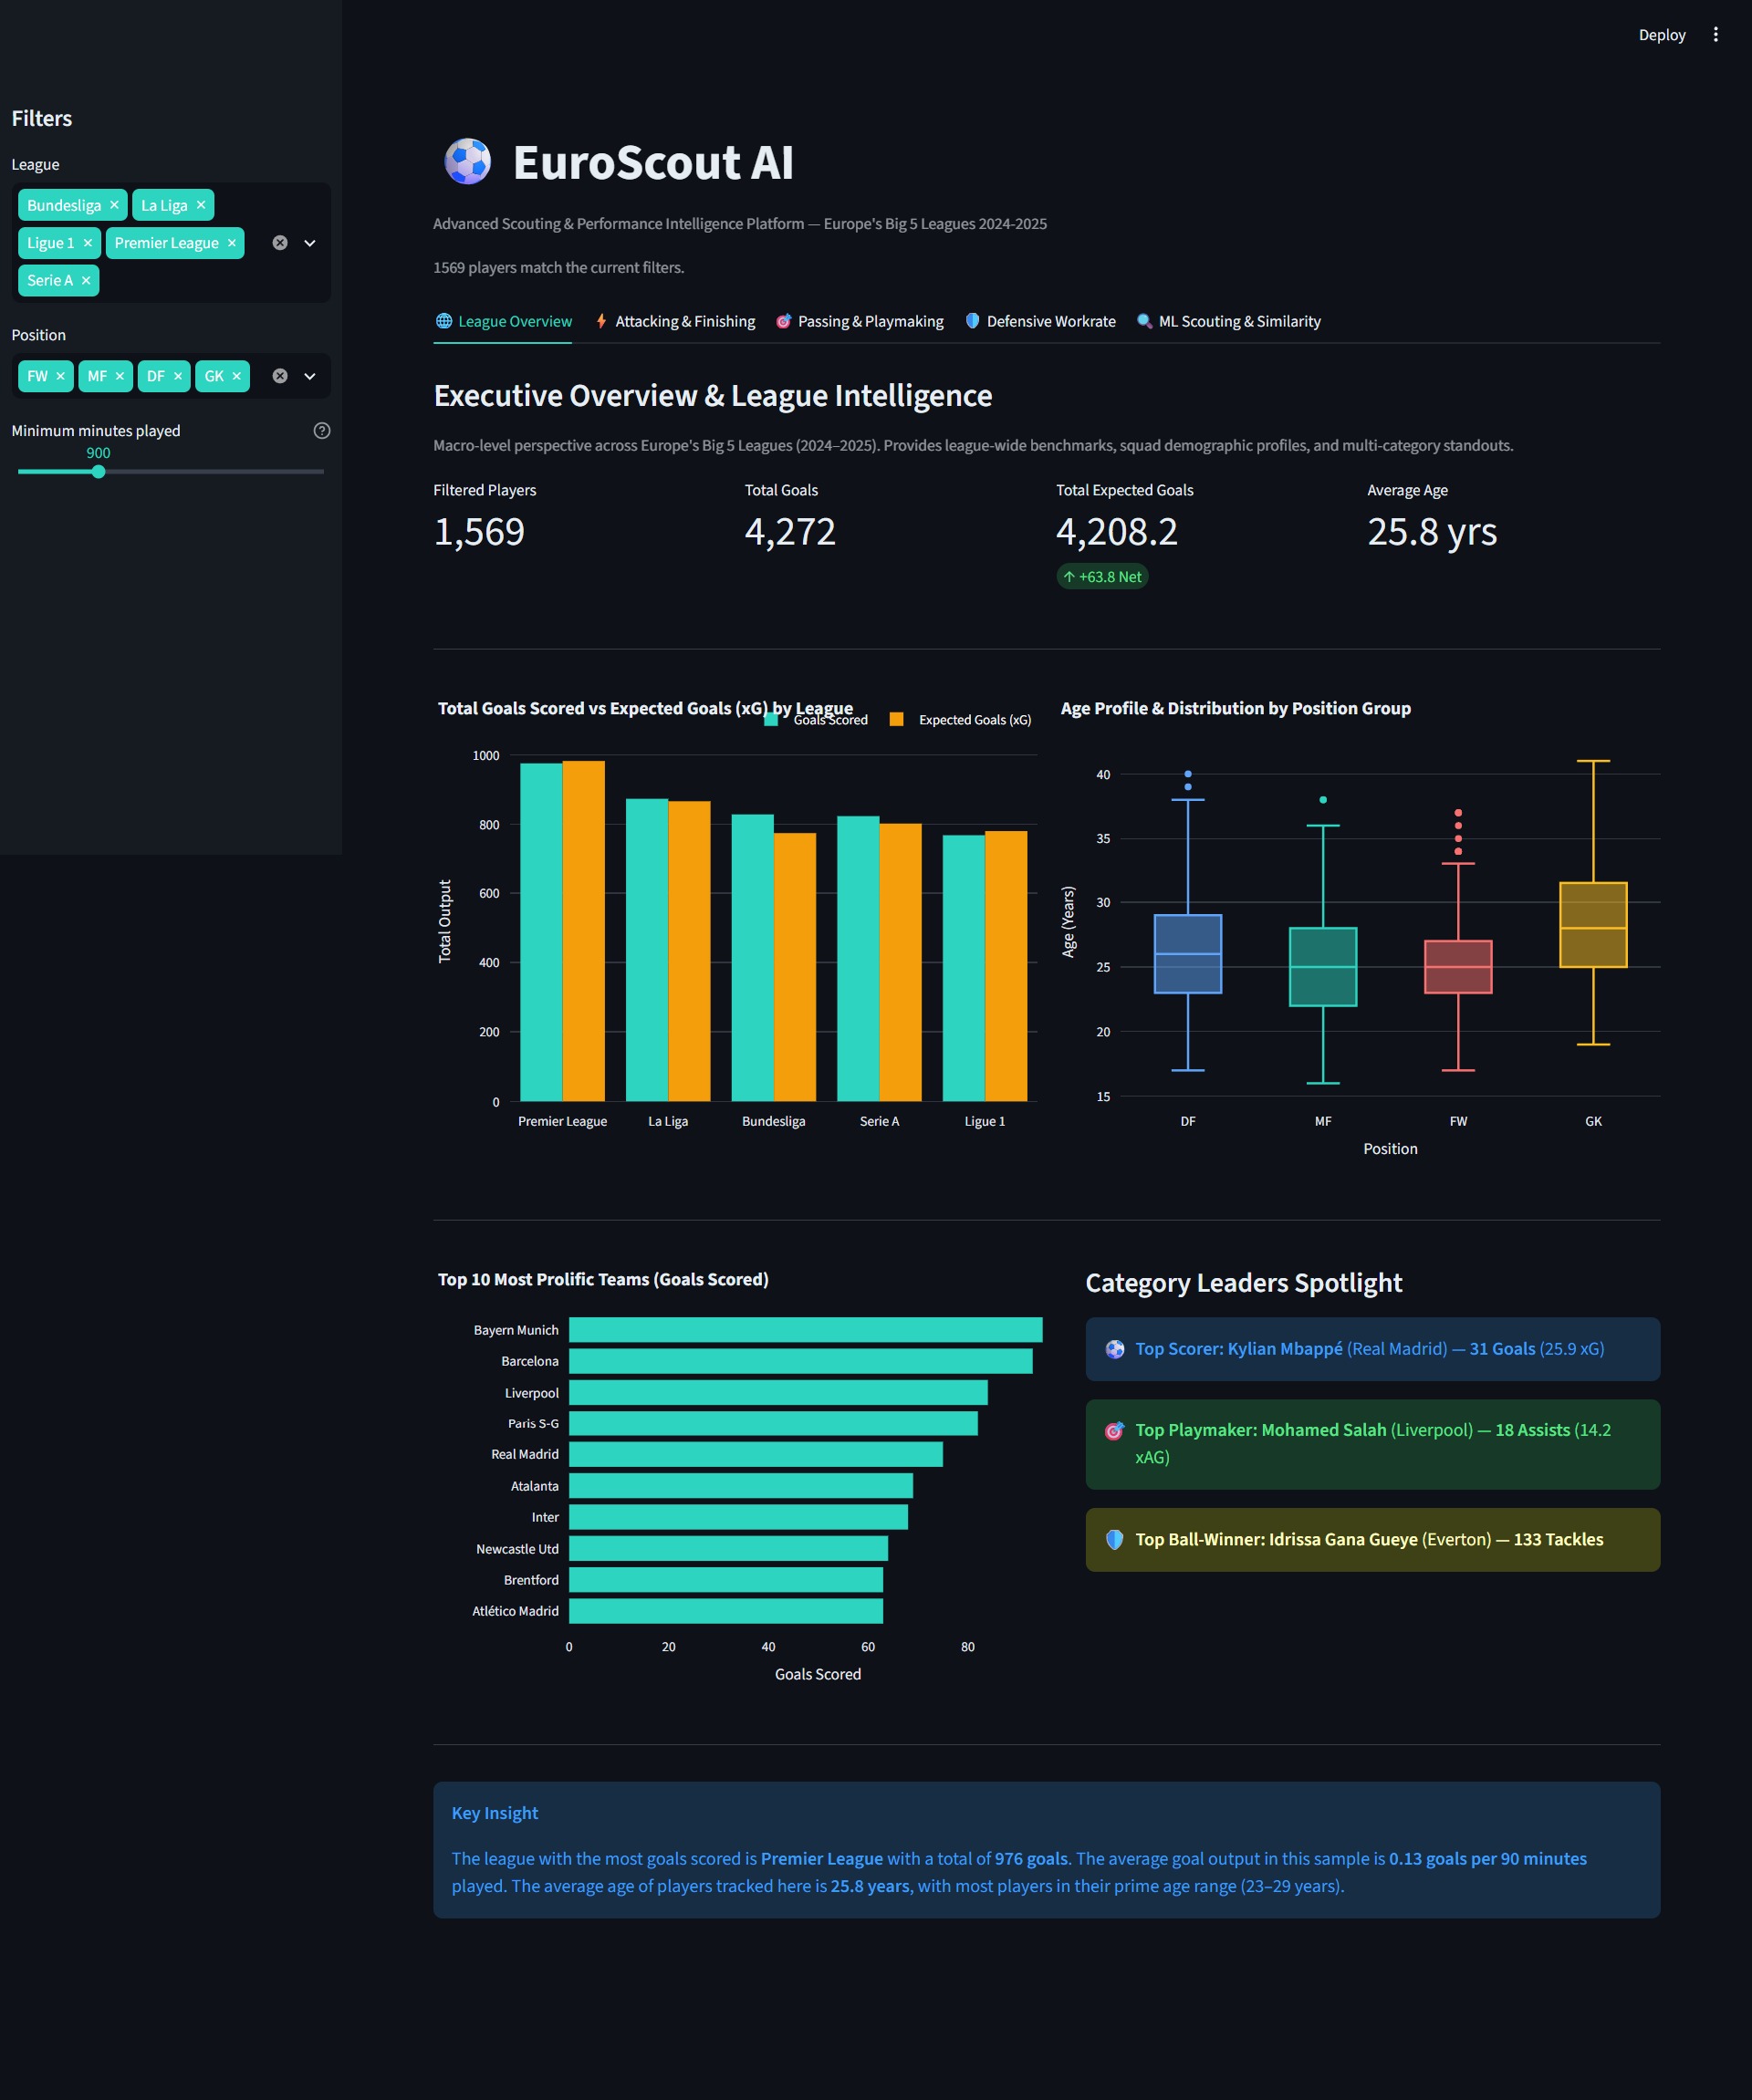
League-wide KPIs, age demographics, and top-player spotlights across Europe's Big 5 leagues.
-
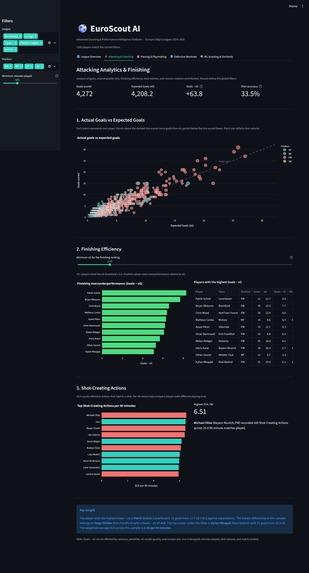
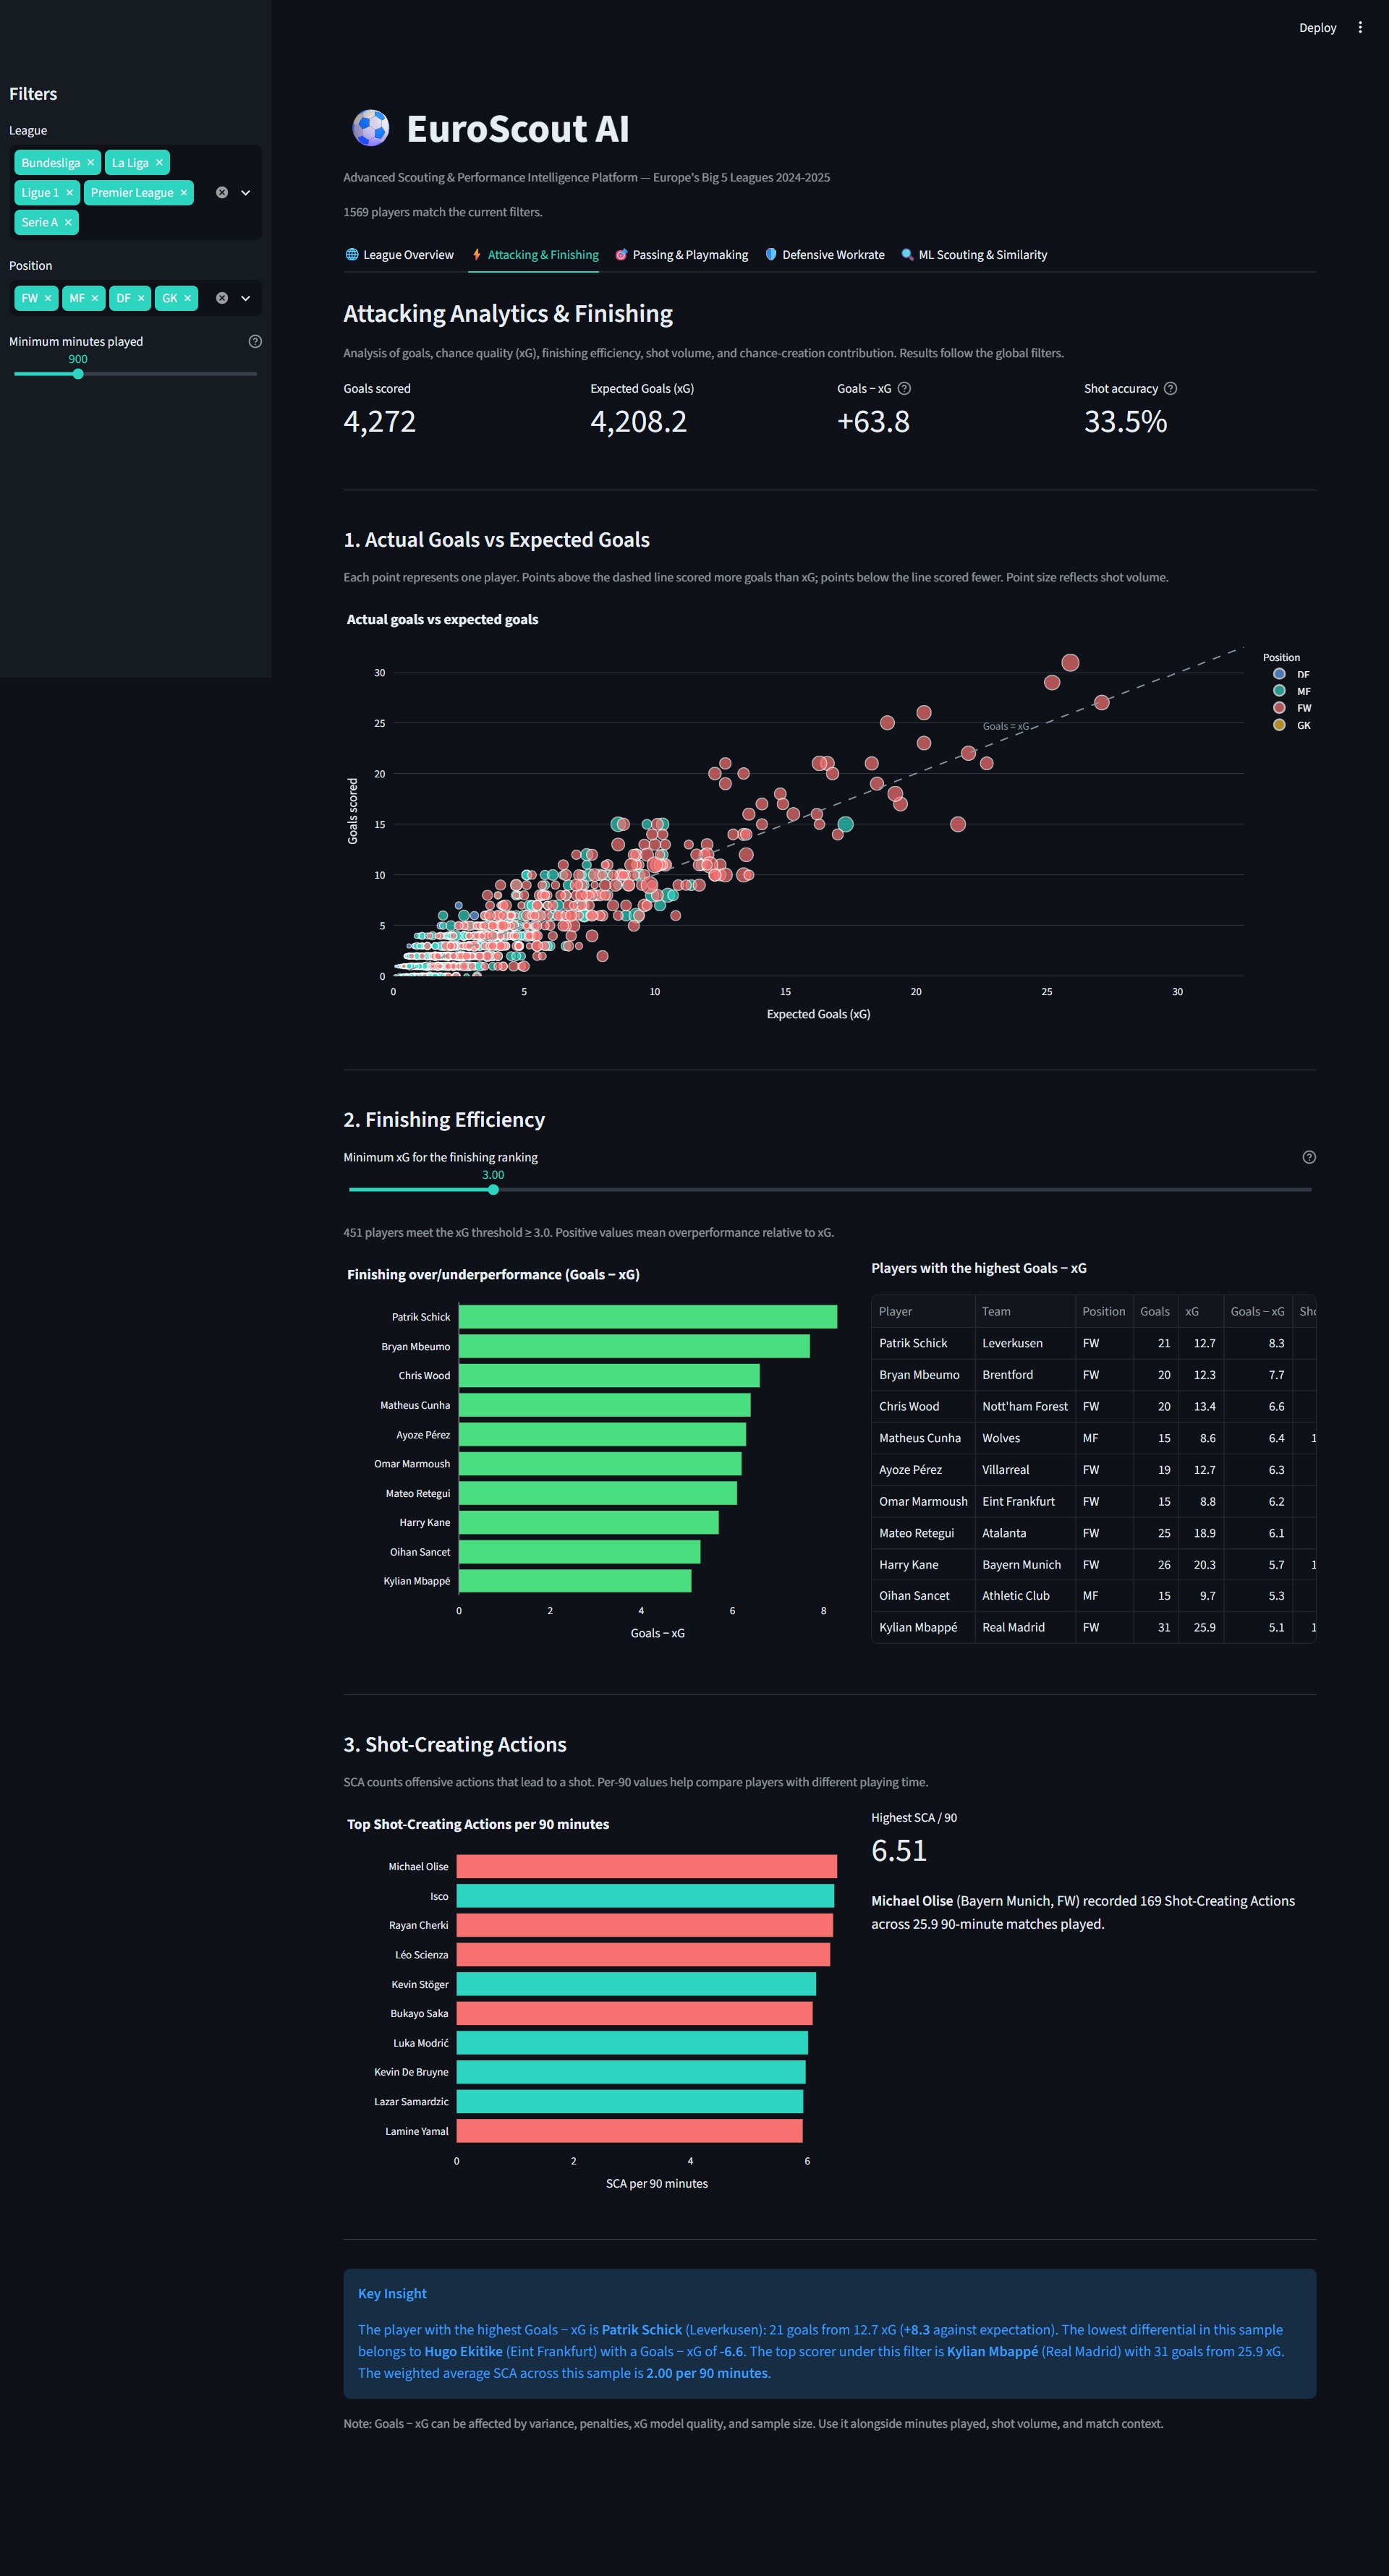
Goals vs xG scatter plot and finishing efficiency rankings to spot over/underperforming strikers.
-
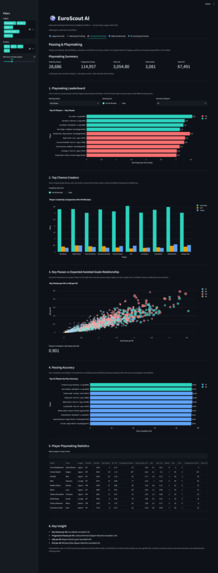
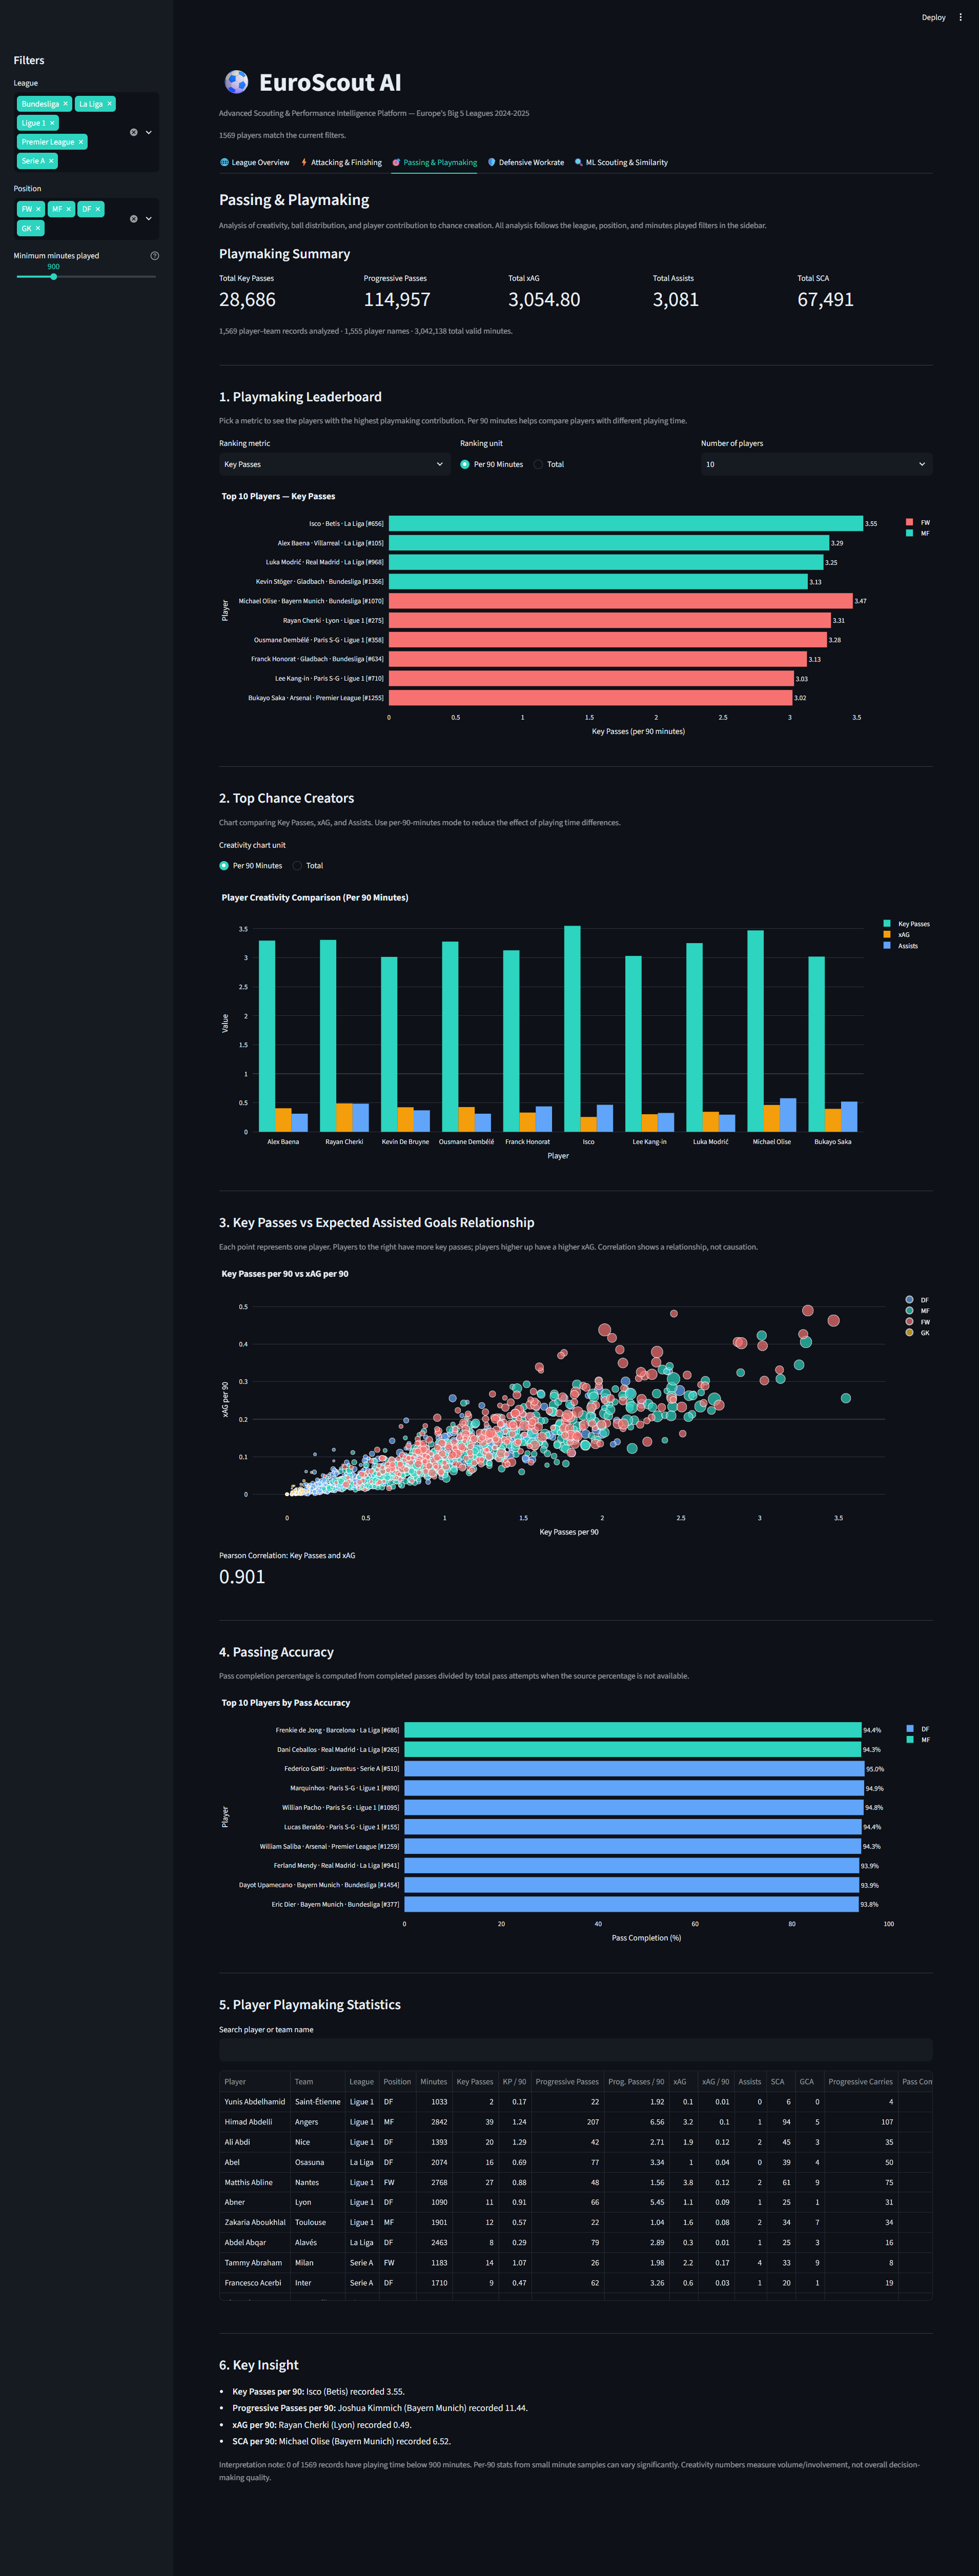
Playmaking leaderboard ranking players by Key Passes, xAG, and Shot-Creating Actions per 90.
-
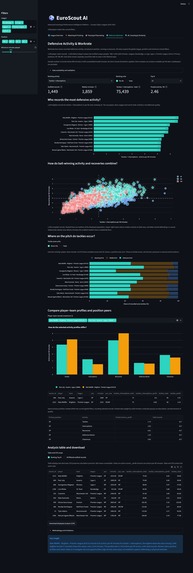
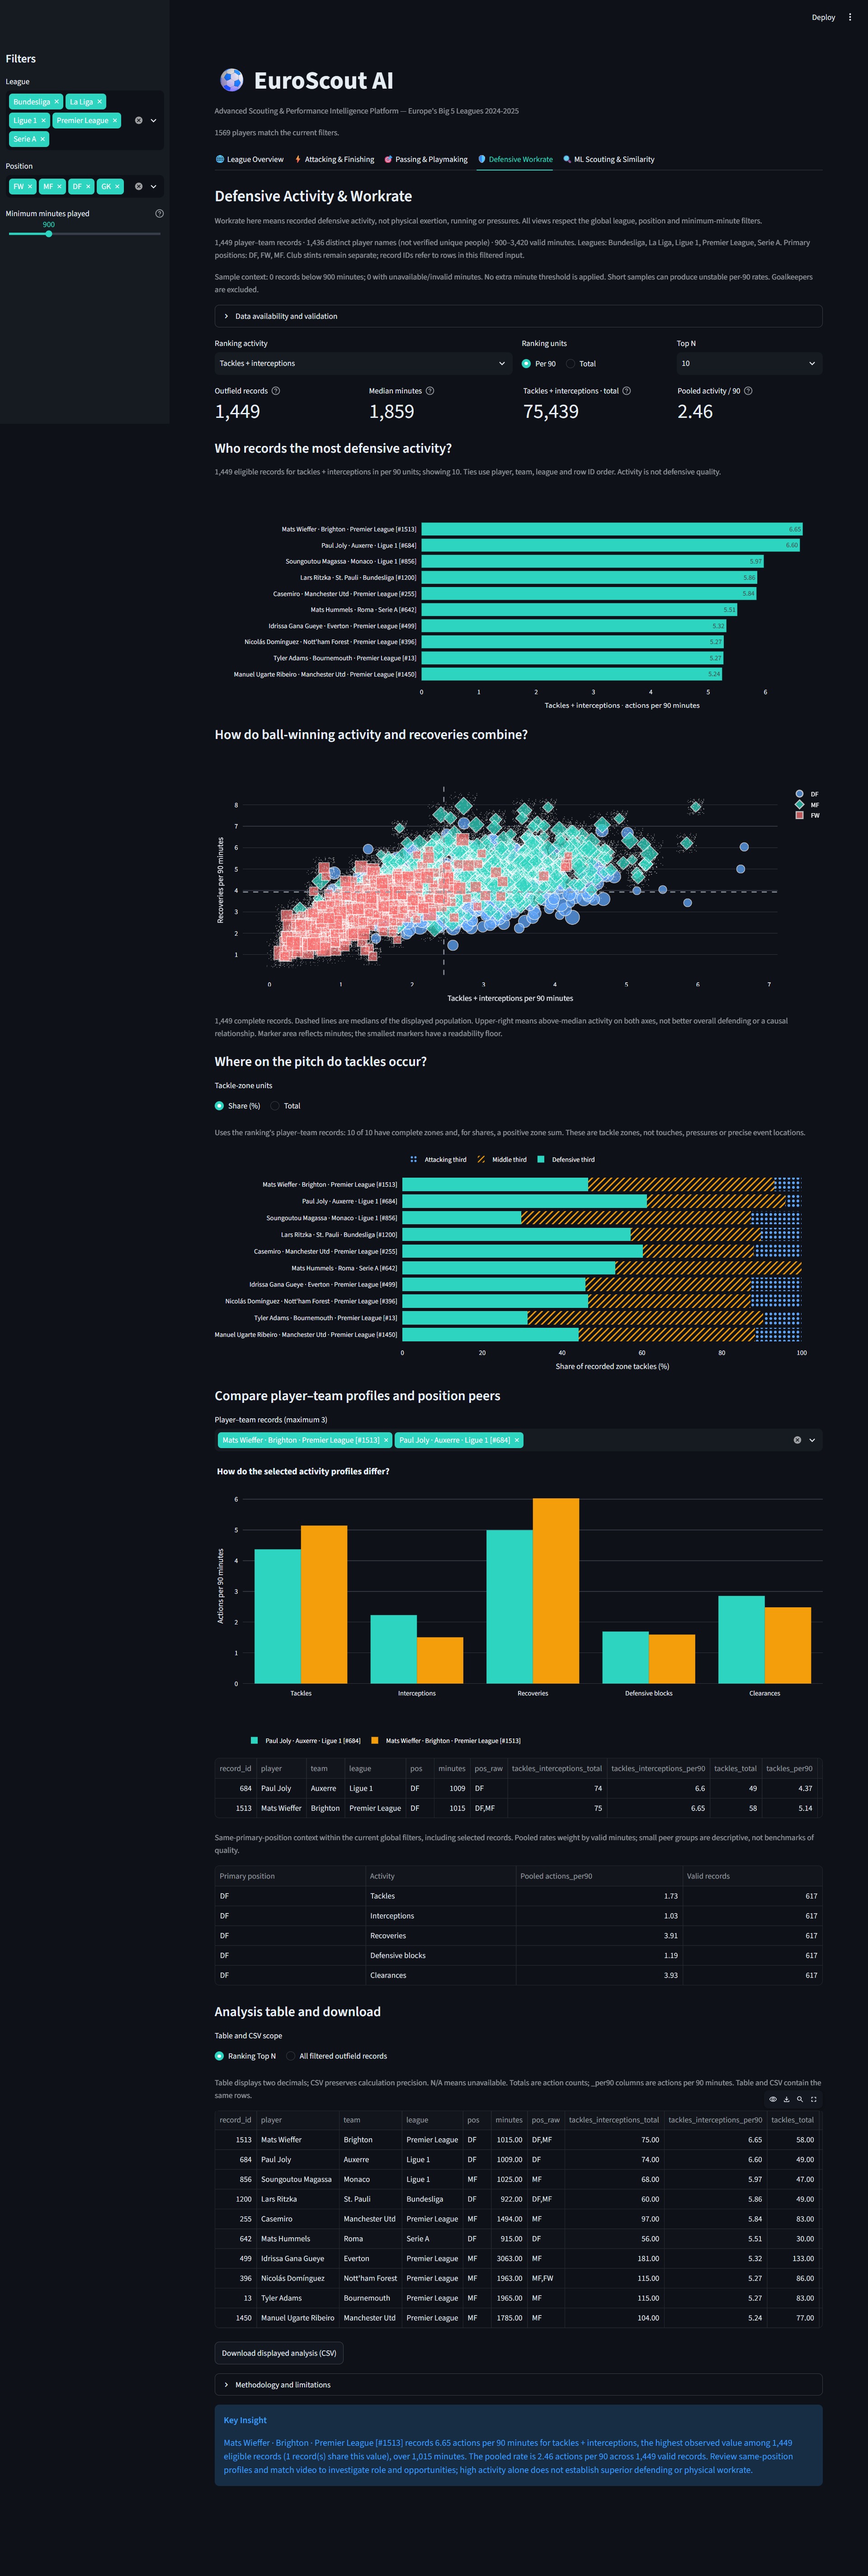
Defensive activity comparison — tackles, interceptions, and recoveries across positions.
Inspiration
Football scouting still relies heavily on intuition and highlight reels, even though rich statistical data (FBref, Big 5 Leagues) is freely available. We wanted to turn thousands of rows of raw player data into insights that scouts, analysts, and fans can actually use to compare players objectively — not just across clubs, but across entire leagues.
What it does
EuroScout AI is an interactive Streamlit dashboard that delivers five analytical perspectives on players from Europe's Big 5 leagues, 2024-2025 season:
League Overview — league-wide performance benchmarks, age demographics, and top-player spotlights across categories.
Attacking & Finishing — finishing efficiency (Goals vs xG) and chance-creation contribution (Shot-Creating Actions).
Passing & Playmaking — creativity, ball distribution, and the relationship between Key Passes and xAG.
Defensive Workrate — defensive activity (tackles, interceptions, recoveries) compared across positions.
ML Scouting & Similarity — our flagship feature: finding players with the closest statistical profile using Cosine Similarity, and grouping players into distinct "playing styles" via K-Means Clustering.
All analysis respects global filters (league, position, minimum minutes played), so users can tailor the player sample to their own needs.
How we built it
The dashboard is built in Python, using Streamlit as the UI framework, Pandas for data processing, Plotly for interactive visualizations, and Scikit-Learn for the machine learning components (StandardScaler, Cosine Similarity, K-Means, PCA). The dataset is sourced from Kaggle: Football Players Stats 2024-2025 (FBref, Big 5 European Leagues).
Our 5-person team split the work into separate modules so we could build in parallel — each member owned one analytical domain (Overview, Attacking, Playmaking, Defensive, ML Scouting), while a single orchestration module (app.py) tied everything together through tabs, global filters, and a shared visual theme. The app is deployed publicly on Streamlit Community Cloud.
For the similarity feature, numeric stats are normalized per-90-minutes and then scaled before computing similarity; for clustering, the optimal number of clusters is determined automatically via Silhouette Score (with the Elbow Method shown as a visual cross-check), and PCA is used to reduce bias from highly correlated raw features.
Challenges we ran into
Data cleaning: the FBref dataset merges many separate stat tables, so a lot of raw column names collided after normalization (e.g. xG vs xG+/-) — we had to build custom column-deduplication logic to avoid parsing errors. Statistical validity in ML Scouting: making sure the radar chart normalization used true percentile rank (not just a percentage of the max value) to avoid outlier bias, and ensuring the K-Means cluster count was chosen objectively (via Silhouette Score) instead of an arbitrary guess. Cross-module collaboration: with 5 members building different modules in parallel, keeping code contracts consistent (render(df), a shared color theme, standardized column names) was essential so every module could integrate cleanly into app.py.
Accomplishments that we're proud of
Building a working ML-based player similarity search that works across leagues, complete with an easy-to-read radar chart visualization. A robust data-cleaning pipeline that handles 191 complex, overlapping raw columns. Five analysis modules integrated seamlessly into a single dashboard with a consistent visual theme. A clustering methodology grounded in objective statistical metrics (Silhouette Score + PCA) rather than arbitrary assumptions.
What we learned
We learned how to responsibly apply unsupervised learning techniques (K-Means, PCA) to real-world sports data — including understanding when a purely statistical result (like the "optimal" number of clusters) needs to be weighed against practical scouting context. We also learned the importance of rigorous data validation before analysis, and how to build a scalable, multi-module Streamlit dashboard for team collaboration.
What's next for EuroScout AI
Adding support for historical seasons to analyze player performance trends over time. Extending the similarity model with user-adjustable feature weighting. Adding a direct head-to-head player comparison feature outside the recommendation results. Exploring predictive models, such as market value estimation or young-player potential projection.
Built With
- cosine-similarity
- kaggle
- kmeans
- machine-learning
- numpy
- pandas
- pca
- plotly
- python
- scikit-learn
- streamlit
- streamlit-cloud


Log in or sign up for Devpost to join the conversation.