Inspiration
The main inspiration was given by 2 of the Hackathon topics: Helthcare and Education.
What it does
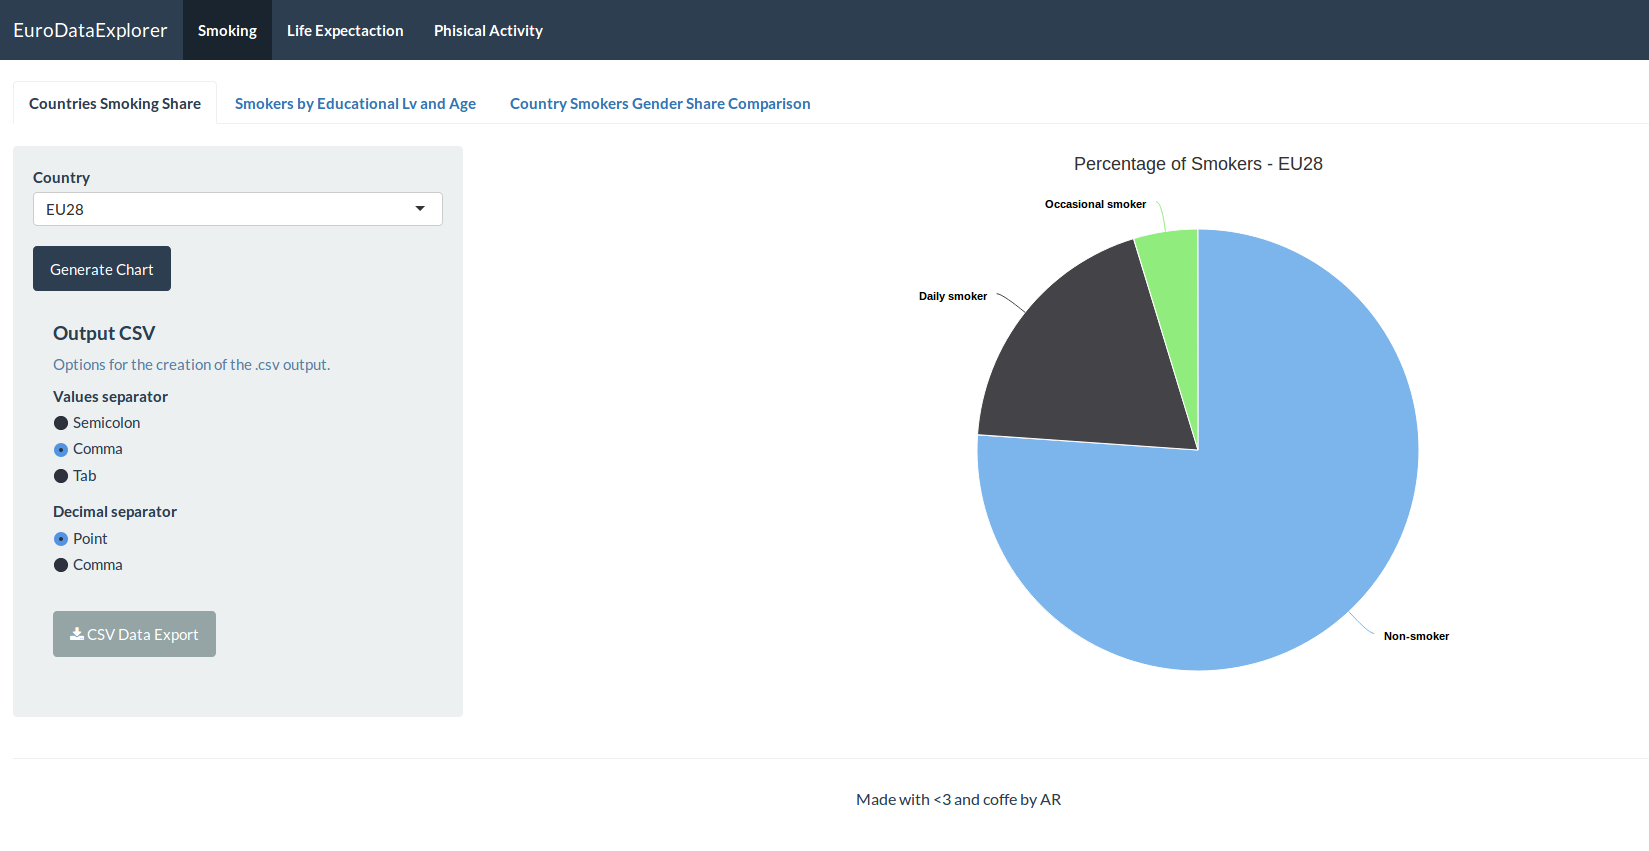
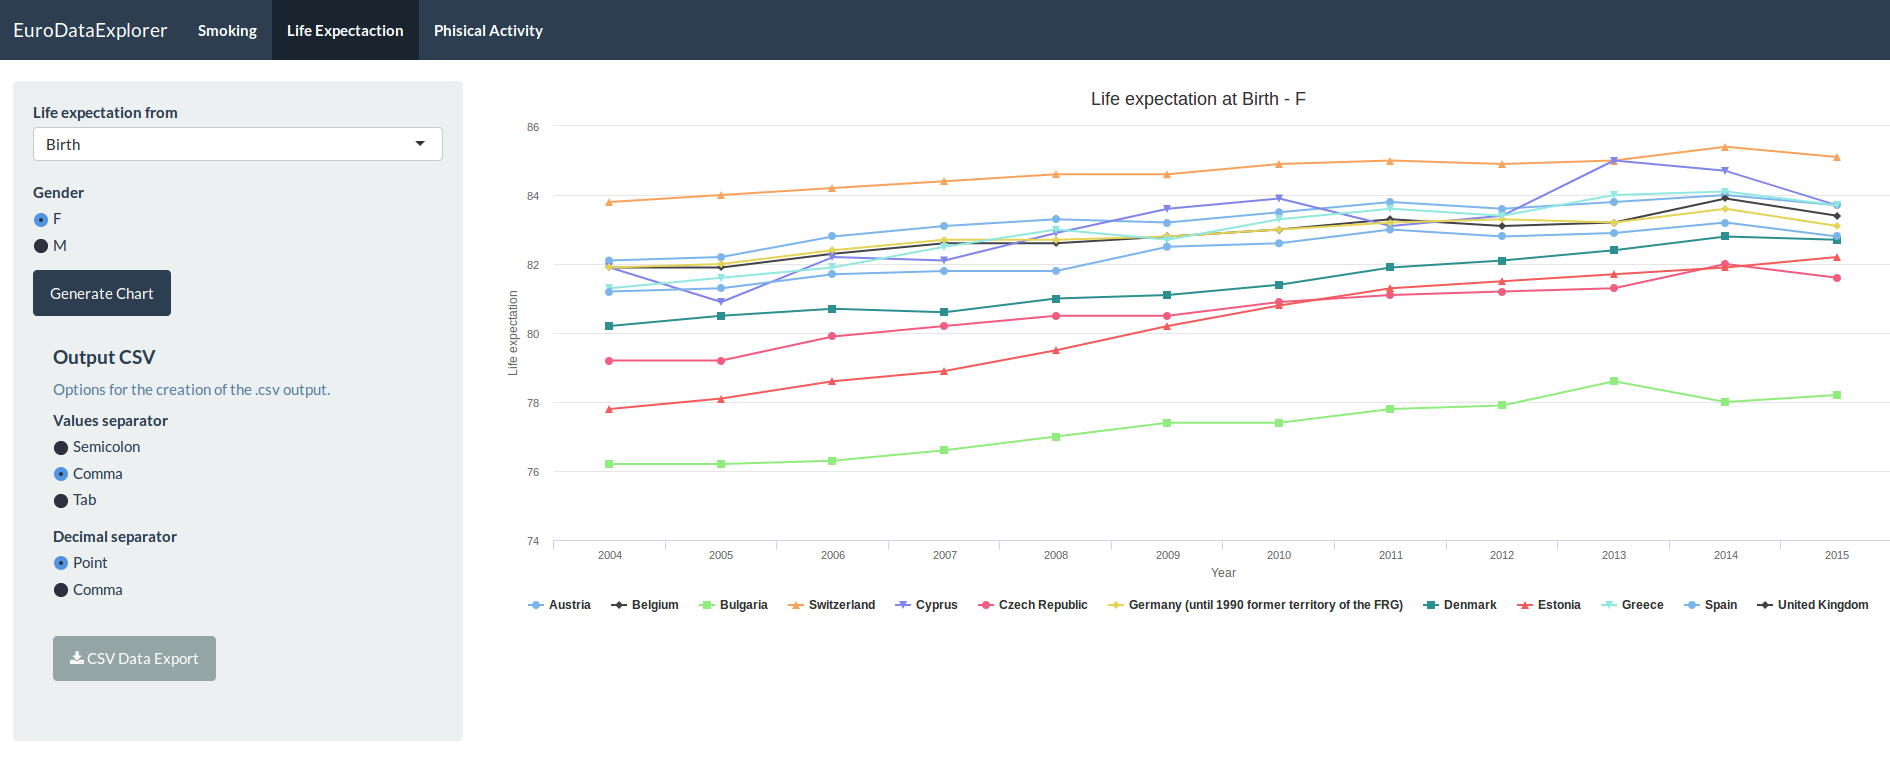
It connects to the Eurostat helthcare databese using an API, then it elaborates the data following some user inputs. Three types of output are provided: charts, pivot table, csv files.
How I built it
Using bootstrap, API, html, R, css, javascript.
Challenges I ran into
Finish all in time.
Accomplishments that I'm proud of
Making it production-ready.
What I learned
Json data manipulation.
What's next for EuroDataExplorer
Increasing the number of database tables analyzed.

Log in or sign up for Devpost to join the conversation.