-
-
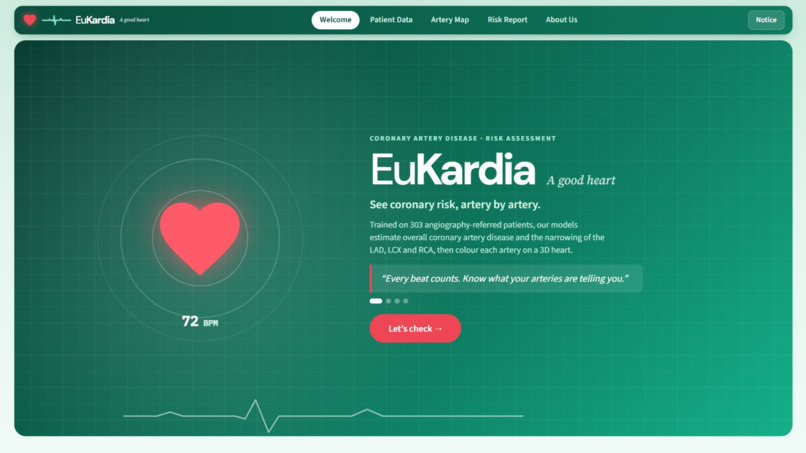
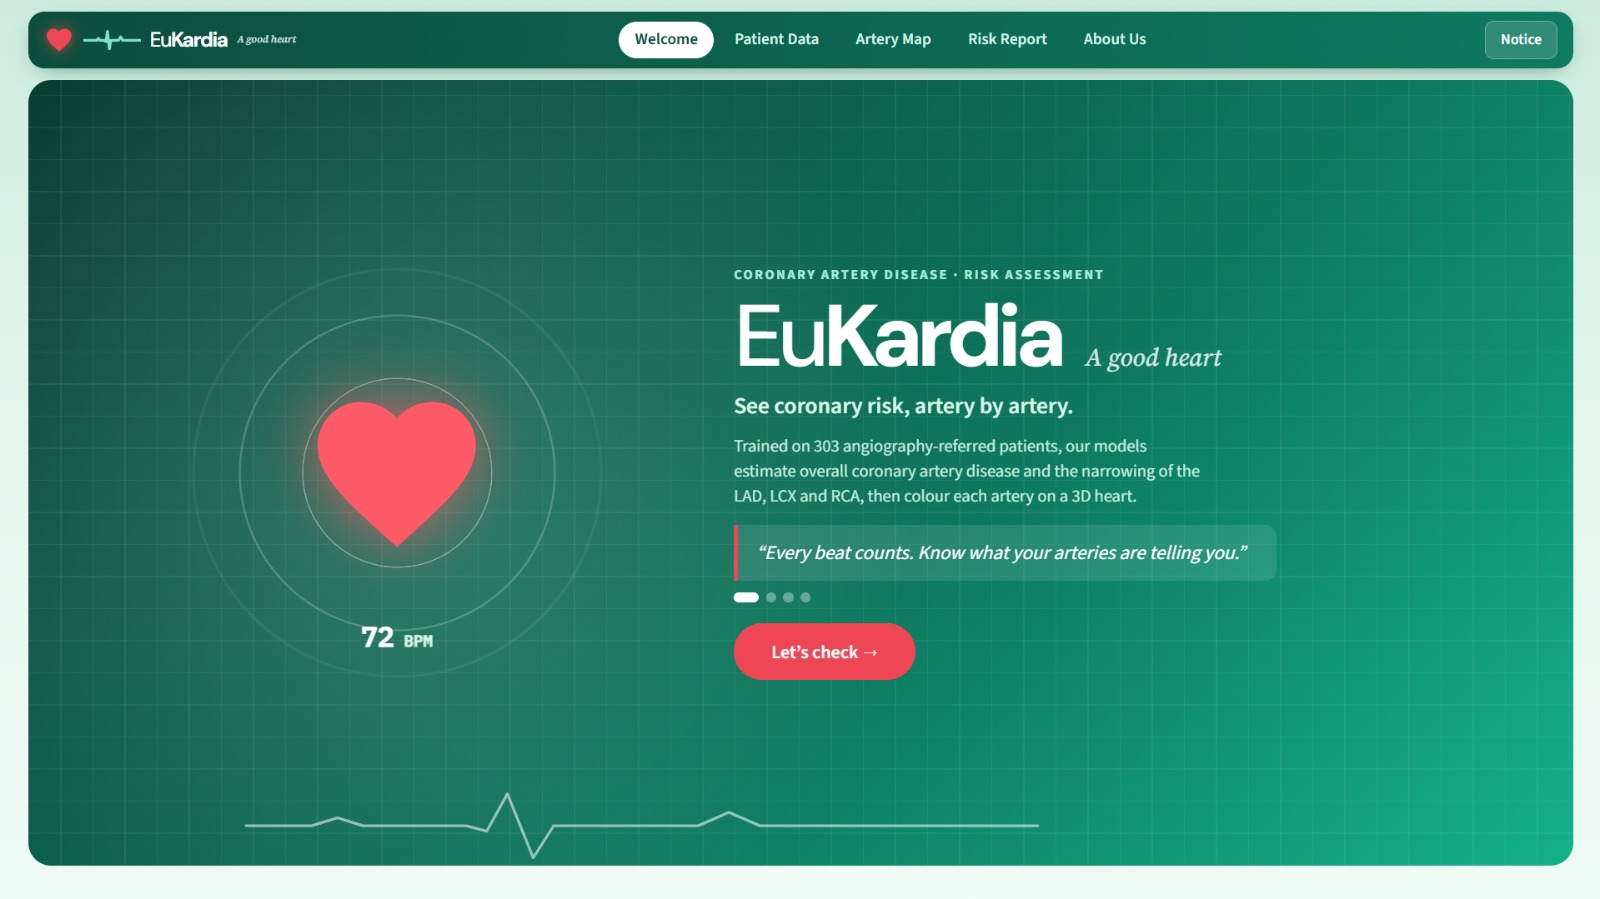
Home Page
-
Inspiration
Coronary artery disease is usually confirmed by coronary angiography, an invasive test, so a tool that estimates risk from routine clinical data would be useful as an early screen. Statistical models usually return a single percentage, which doesn't show where the problem sits in the heart. We wanted a tool that shows which artery is at risk and why.
What it does
EuKardia is a web application. You enter a patient's measurements, or load a demo patient, and it predicts overall coronary artery disease (CAD) and the narrowing of the three main arteries: the LAD, LCX and RCA.
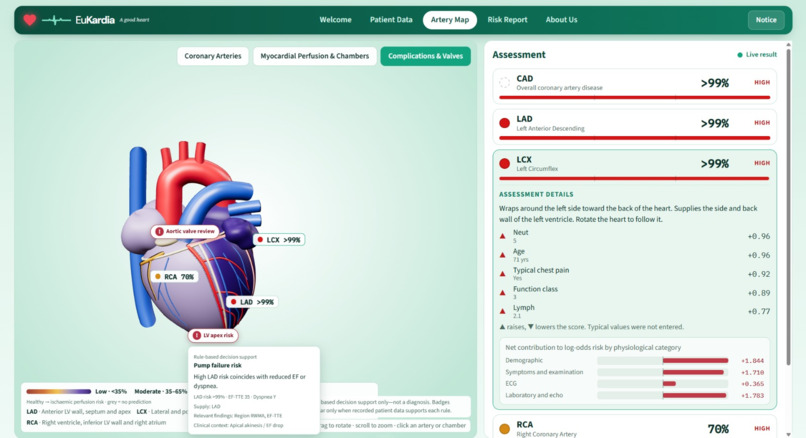
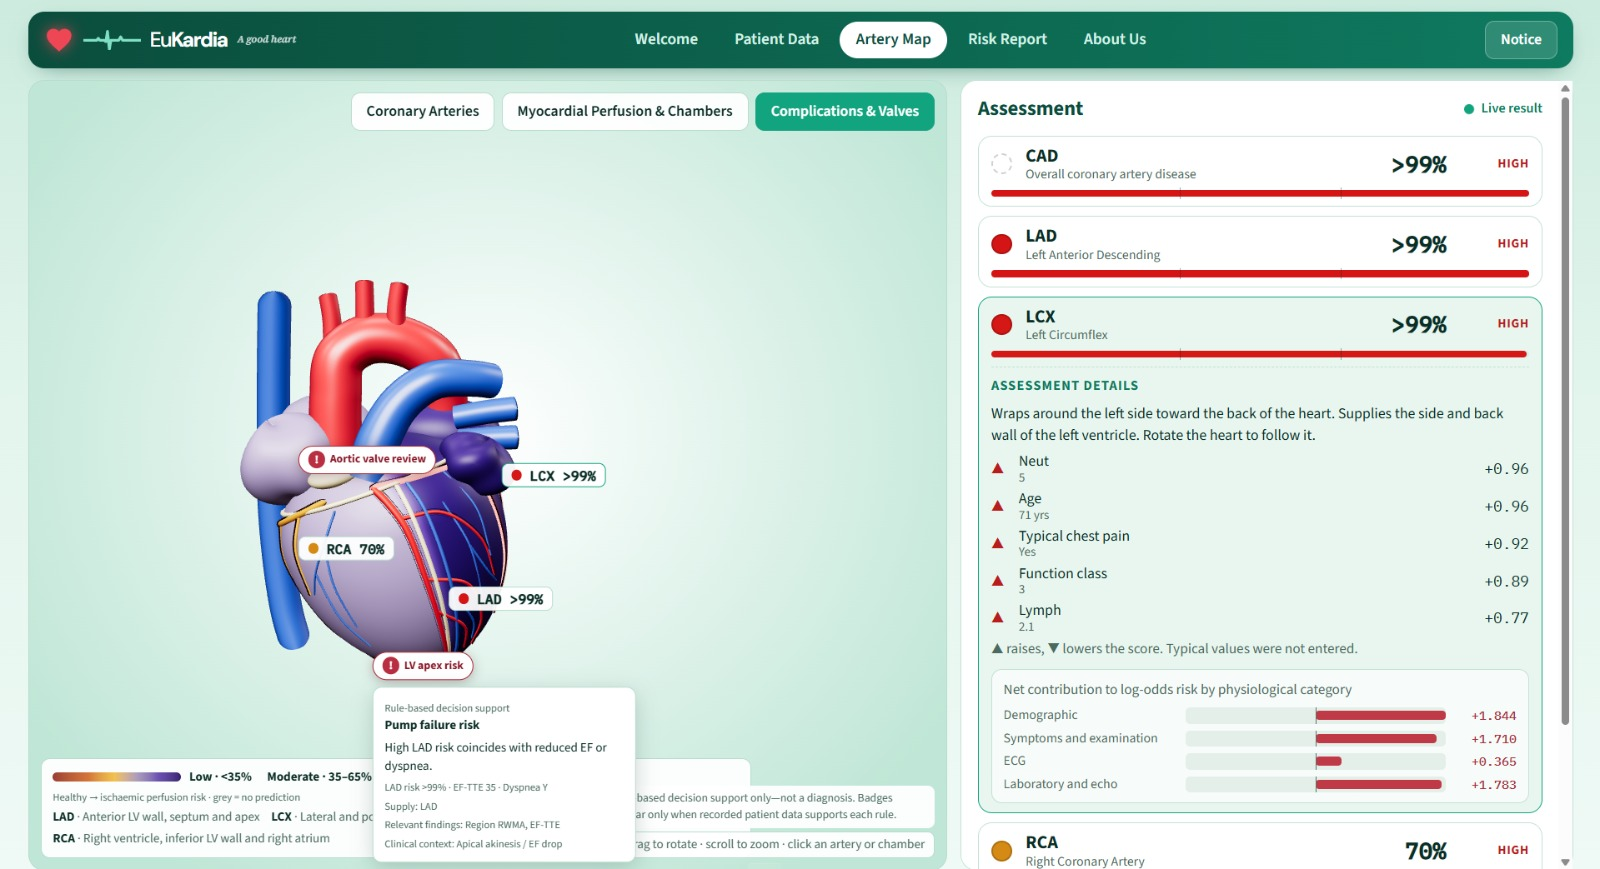
- Artery Map: an interactive 3D heart where each artery is colored from green to red by its predicted risk. You can rotate, zoom, select an artery, show labels, use auto-rotation and switch to a color-blind palette.
- Three views: Coronary Arteries, Myocardial Perfusion & Chambers (which heart muscle each artery supplies), and Complications & Valves (what a narrowed artery may mean for the patient).
- Explanations: every prediction is explained with SHAP, showing the main factors and a breakdown by physiological group.
- Risk Report: a printable summary of the assessment.
How we built it
The project has four parts:
- ML pipeline: Python, pandas and scikit-learn. We trained four logistic regression models (CAD, LAD, LCX, RCA) on the Z-Alizadeh Sani dataset of 303 patients. The Cath result and the vessel labels are never used as inputs, and a unit test checks this. Preprocessing sits inside a scikit-learn Pipeline, so each cross-validation fold learns from its own training data only.
- Backend: FastAPI, which returns probabilities, risk bands and SHAP explanations in a single response.
- Frontend: React, TypeScript and Vite, with one Zustand store feeding both the dashboard and the 3D scene.
- 3D viewer: React Three Fiber. We modelled the heart in Blender (about 13,000 triangles), with LAD, LCX and RCA as separate named objects so that each is colored on its own.
Challenges we ran into
- Small, imbalanced data: 303 patients, with only 61 held out for testing, so the results are noisy and the confidence intervals are wide.
- Weak vessel models: LCX and RCA had the fewest positive cases and were the hardest to learn.
- Data quirks: one record disagreed with the CAD rule, "Fmale" had to be corrected, and one column had the same value in every row.
- Calibration: sigmoid calibration lowered the Brier score but hurt sensitivity for LCX and RCA, so we kept the raw logistic probabilities.
- Connecting four parts: keeping the artery names consistent across the model, API, 3D file and interface.
Accomplishments that we're proud of
- Leakage-safe pipeline: a unit test guarantees that the answer columns never reach the features.
- Exact explanations: SHAP values on a linear model, checked against an independent calculation to within 1e-6, with a fallback if SHAP fails.
- Honest results: overall CAD reached a holdout AUC of 0.89 and LAD 0.79. LCX (0.63) and RCA (0.64) are weak, and we report this openly without tuning toward the holdout.
- More than a color map: the perfusion and complications views connect each artery to the heart muscle it supplies.
- A complete system: it covers training through the 3D interface, with a safety disclaimer throughout.
What we learned
- Simple models suit small data: logistic regression performed as well as a random forest here and gives explanations that are exact.
- Validation matters: retraining on 25 different splits showed how much the results move, so a single holdout number should not be trusted on its own.
- Honesty is a feature: showing the weak vessels openly is more useful than a confident-looking number.
- A shared contract helps: agreeing early on names and a response format kept the four parts working together.
What's next for EuKardia
-Independent validation:test on data from other sources, since this dataset comes from one source only.
- Better LCX and RCA models: more data, better features, and proper calibration, so the probabilities can be read as risk and not only as model scores.
- Lab ranges: confirm the units and normal ranges of the lab fields so the app can flag abnormal values.
- Clinician review: have the anatomy and the perfusion and complications rules checked by a clinician.
- Performance checks: measure the frame rate on laptops without a dedicated GPU.
- Extensibility: make it easier to add new features, models and anatomical structures.
EuKardia is for decision support and education only. It is not a medical device and does not replace formal diagnostic imaging or professional medical judgement.


Log in or sign up for Devpost to join the conversation.